Reports
- Global Locations -
Headquarters
Future Market Insights, Inc.
Christiana Corporate, 200
Continental Drive, Suite 401,
Newark, Delaware - 19713,
United States
Americas
Future Market Insights, Inc.
616 Corporate Way, Suite 2-9018,
Valley Cottage, NY 10989, United States
MEA
Future Market Insights
1602-6 Jumeirah Bay X2 Tower, Plot No: JLT-PH2-X2A,
Jumeirah Lakes Towers, Dubai,
United Arab Emirates
Europe
Future Market Insights
3rd Floor, 207 Regent Street,
W1B 3HH London
United Kingdom
Asia Pacific
Future Market Insights
Office No. 401-A, 4th Floor,
VANTAGE 9, S.No. 36/1/1,
Baner, Pune 411045, India
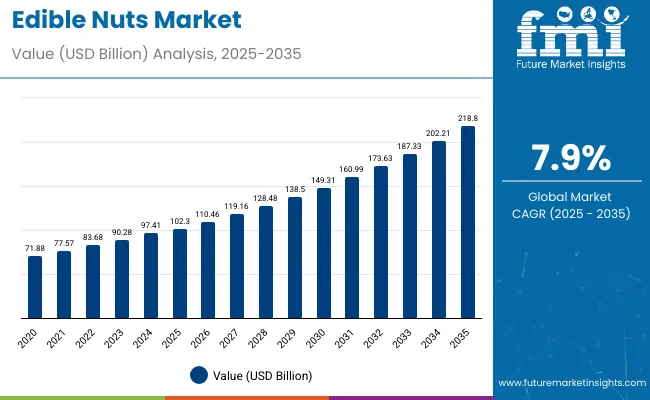
The global edible nuts market is expected to reach a market valuation of US$ 87.9 billion in 2023. It is likely to accelerate at a robust CAGR of 7.9% from 2023 to 2033. In 2033, the market is slated to reach a US$ 191.3 billion.
People around the world are becoming more conscious about their health and lifestyles. As a result, they are changing their eating habits. They are making nuts a regular part of their diet as they are energy-dense and nutrient-rich food sources. The World Health Organization (WHO) also recommends adults to include nuts in their diets as they are found to be rich in antioxidants. Regular consumption of nuts can also reduce cholesterol and manage Type 2 diabetes and multiple metabolic syndromes.
Cashews are among the most popular types of edible nuts. Cashew trees, the sources of cashews, are native to Brazil. However, right now, cultivation of cashew trees happens across several countries with predominantly warm climates. Vietnam and India are the most prolific producers of cashews. Cashews are rich in protein, unsaturated fats, and copper.
These nutrients can lower the risks associated with heart disease and premature death, ensure positive brain development, and boost the immune system. However, raw cashew consumption is controversial owing to urushiol, a toxic, naturally occurring substance found in cashews.
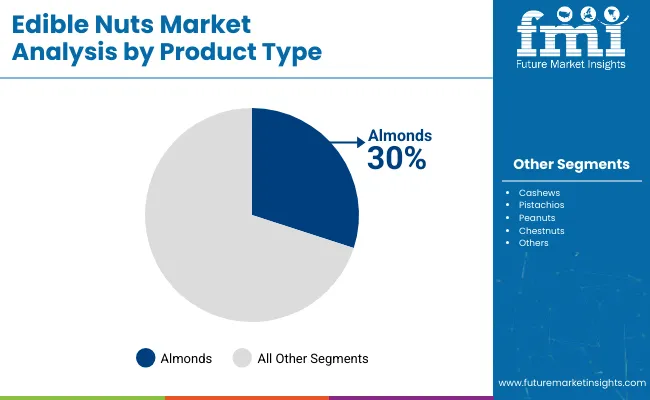
Almonds also have multiple health benefits to offer. For starters, they are rich in antioxidants and Vitamin E, which combine to offer excellent protection against oxidative stress. Almonds are also known for their ability to keep blood pressure and blood sugar levels in check. Regular consumption of almonds can also reduce hunger, which can be beneficial for people looking to cut down on their calorie intake. Almonds are sourced from almond trees, which are native to the Middle East. However, right now, the United States is the most prominent producer of almonds.
Peanuts have also found favor around the world for their health benefits. In developing economies, people tend to prefer peanuts over almonds and cashews owing to their affordability. The peanut plant, which is the source of peanuts, is estimated to have originated in either Peru or Brazil.
However, China and India are among the world’s most substantial peanut producers. Despite being more affordable than almonds and cashews, peanuts offer several health benefits similar to their expensive counterparts. For instance, peanuts are known to reduce cholesterol levels, which can benefit heart health. They can also be effective in lowering inflammation and preventing medical conditions such as type 2 diabetes and cancer.
Chestnuts and pistachios are not as popular as almonds, cashews, and peanuts in terms of raw consumption. However, they are used to compliment a variety of preparations. For instance, chestnuts are known for adding sweet richness to vegetable, meat, and poultry dishes. Pistachios are commonly used to add crunch to desserts such as cakes, ice creams, and pastries.
Attributes | Key Insights |
---|---|
Estimated Edible Nuts Market Value (2023) | US$ 87.9 billion |
Projected Market Value (2033) | US$ 191.3 billion |
Value-based CAGR (2023 to 2033) | 7.9% |
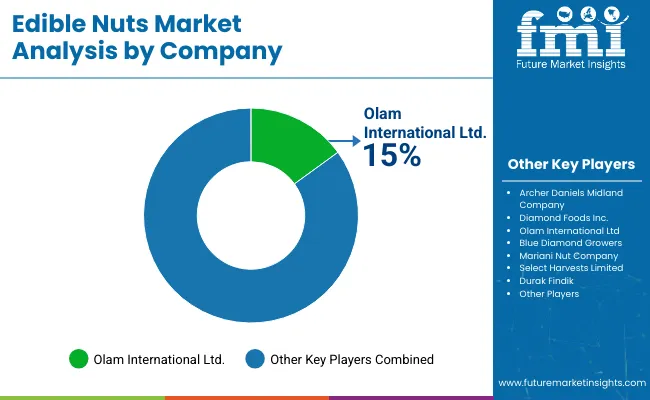
Top Players Share in 2022 | 28.5% |
Don't pay for what you don't need
Customize your report by selecting specific countries or regions and save 30%!
Exercising alone is not enough for individuals to maintain their fitness levels. A proper balanced diet is also important for health as it can ensure proper nutrition. Nuts are rich in protein, carbohydrates, vitamins, minerals, and fiber. From 2018 to 2022, awareness of these qualities of nuts skyrocketed among consumers, which led to the edible nuts market accelerating at a positive 8.7% CAGR.
Compared to the 8.7% CAGR observed by FMI between 2018 and 2022, the anticipated 7.9% CAGR from 2023 to 2033 reflects a marginal dip in the rate of market acceleration. However, this should not do much to deter players in the global market for edible nuts, who would be keen on increasing their production capacities.
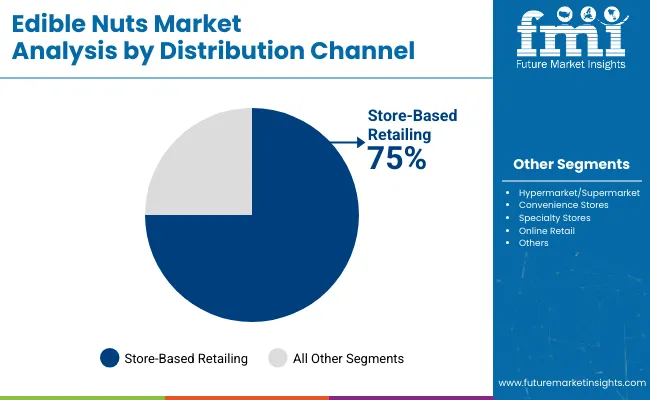
Retail sales channels such as supermarkets and hypermarkets are the most accessible destinations for purchasing edible nuts, specifically among upper and middle-income earners. However, smaller grocery stores are more popular among low-income earners for buying edible nuts. Prominent retail chains such as Walmart and Costco are strongly practicing shelving of edible nuts in their stores and offering attractive discounts to promote nut consumption.
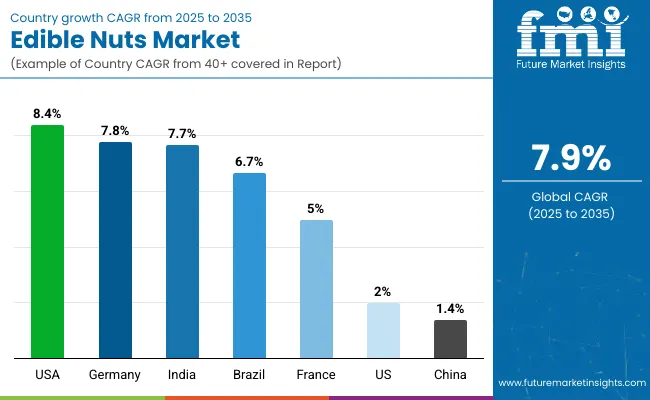
According to FMI research, consumption of edible nuts is likely to soar in developed economies such as the United States, Germany, and Spain. Developing economies such as Brazil and India are also likely to provide lucrative opportunities to market participants in the coming years.
Edible Nuts Market:
Differentiating Aspects | Edible Nuts Market |
---|---|
CAGR in 2023 to 2033 | 7.9% |
Current Valuation in 2023 | US$ 87.9 billion |
Projected Valuation in 2033 | US$ 191.3 billion |
Demand Drivers |
|
Macadamia Market:
Differentiating Aspects | Macadamia Market |
---|---|
CAGR in 2023 to 2033 | 11.2% |
Current Valuation in 2023 | US$ 1.3 billion |
Projected Valuation in 2033 | US$ 3.7 billion |
Demand Drivers |
|
Nut Butters Market:
Differentiating Aspects | Nut Butters Market |
---|---|
CAGR in 2023 to 2033 | 8.7% |
Current Valuation in 2023 | US$ 1.1 billion |
Projected Valuation in 2033 | US$ 2.5 billion |
Demand Drivers |
|
Organic Nut Production to Gain Prominence and Keep Sales of Edible Nuts Ticking
The global focus on sustainable agriculture is mounting. Modern methods that reduce the impact of agriculture on the environment are being leveraged by several firms. These include innovations that are aimed at ensuring water conservation and the reduction of waste production. Consumers are also driving sustainable agriculture by increasingly opting for organic foods. As organic foods are grown without the use of insecticides or pesticides, they are healthier compared to foods cultivated through the use of harmful substances.
To promote sustainable development in the global market for edible nuts, the International Nut & Dried Fruit Council (INC) keeps a watchful eye over regional production. Blue Diamond Growers, one of the most prominent names in edible nuts production, is collaborating with the INC amd engaging in sustainable practices. FMI predicts these developments to be positive for the global market for edible nuts.
Popularity of Pistachios to Boost Sales of Edible Nuts in the United States
According to the United States Department of Agriculture (USDA), the world's pistachio production increased by around 50% from 2015 to 2016. During the same period, pistachio exports worldwide increased by 30%. The United States experienced the greatest increase in pistachio production, according to a USDA study from October 2017. Although Iran is one of the prominent producers of pistachios, the country’s production output did not significantly increase. Pistachio is widely consumed in the United States because of its taste and high nutritional value.
In 2023, the United States is estimated to hold a 21.7% share in the global market. It is projected to hold a market share of 20.2% in 2033. This marginal decrease in the United States’ global market share is indicative of increasing nut production and consumption across the world’s developing economies.
Healthy Eating Trends in Germany to Contribute to Increasing Edible Nut Sales
Germany is one of Europe’s leading markets for cashew nuts. Even though the country’s climate is not fit for the cultivation of cashew trees, it is a prominent cashew nut importer in Europe. Estimates suggest that cashew nut imports in Germany reached a whopping 59,000 tons in 2021. There was a 2.4% increase in cashew nut import volumes from 2017 to 2021. Most of Germany’s cashew nut imports come from Vietnam, and the remainder arrives from India and Indonesia.
In recent years, healthy eating has gained momentum in Germany and this is contributing to the increasing consumption of edible nuts in the country. A significant portion of cashew nut imported by Germany is not consumed by the country, but instead re-exported to other European nations such as France, Luxembourg, and the United Kingdom.
Increasing Per Capita Income Coupled with Festive Celebrations to Fuel Sales of Edible Nuts in India
Edible nut consumption is a cultural phenomenon that is prevalent across the entirety of India. Dry fruit boxes containing almonds, raisins, pistachios, and dried figs are found across shops all over the nation during religious festivities. Pistachios are primarily imported, as opposed to dry fruits and nuts, which are produced in India. However, demand for pistachios is not restricted to the holiday season. Due to their high nutritional value, they are frequently used in Indian cuisine.
India is estimated to gain +60 basis points from 2023 to 2033 as the country’s per capita income has been steadily growing over the last decade. FMI observed a slight dip during the 2021 financial year but it picked up pace in again in 2022 as a per capita income of US$ 150.3 was registered.
Get the data you need at a Fraction of the cost
Personalize your report by choosing insights you need
and save 40%!
Affordability of Peanuts to Make it the Most Attractive Edible Nut Type from 2023 to 2033
By product type, peanuts are the most consumed edible nut in the world with an estimated consumption of 42,596 metric tons. Almonds are at second place with a projected consumption of 1,188 metric tons. The other varieties are walnut, cashew, and pistachio, which had estimated consumptions of 888.67, 792.32 and 669.86 metric tons respectively in 2018.
The fact that peanuts are the most widely consumed edible nut is not a surprise. Peanuts are much more affordable than other edible nut types such as almonds and cashews. In recent years, consumers have also become aware of the fact that in terms of nutritional value, peanuts have just as much to offer as cashews and almonds. FMI anticipates peanut sales to outperform sales of almonds and cashews in the coming years, particularly across developing economies.
Plain, Roasted, and Salted Edible Nuts to Fuel Market Surge Worldwide
Edible nuts are available in various forms in the market such as plain, roasted, and salted. Nuts such as almonds, cashews, and walnuts are incorporated into a diverse array of chocolate products as well. They are also being used in spreads like peanut butter and hazelnut spread, which offer a combination of sophisticated taste and health benefits.
Both prominent and emerging players in the global market for edible nuts are capitalizing on the increasing demand by offering unique products with classy packaging. As a result, FMI anticipates all forms of edible nuts to record skyrocketing sales figures between 2023 and 2033.
Hotel chains and restaurants are working closely with edible nut suppliers and growers to source the best ingredients for their menus. Market participants are currently expanding their reach by creating a reliable distribution network to preserve product quality. A good distribution network guarantees that the product reaches its intended market, narrowing the gap between the finished product and the prospective market.
For instance:
Attribute | Details |
---|---|
Estimated Market Size (2023) | US$ 87.9 billion |
Projected Market Size (2033) | US$ 191.3 billion |
Anticipated Growth Rate (2023 to 2033) | 7.9% |
Forecast Period | 2023 to 2033 |
Historical Data Available for | 2018 to 2022 |
Market Analysis | US$ million for Value |
Key Regions Covered | North America, Latin America, Europe, East Asia, South Asia, Oceania, & Middle East and Africa |
Key Countries Covered | The United States, Canada, Brazil, Mexico, Germany, The United Kingdom, France, Italy, Spain, Nordic, Russia, Poland, China, Japan, South Korea, India, Thailand, Indonesia, Malaysia, Singapore, Australia, New Zealand, GCC countries, North Africa, & South Africa |
Key Segments Covered | Product Type, Nature, Form, End-Use, Distribution Channel, and Region |
Key Companies Profiled |
|
Report Coverage | Market Forecast, Company Share Analysis, Competition Intelligence, Drivers, Restraints, Opportunities, and Threats Analysis, Market Dynamics and Challenges, and Strategic Growth Initiatives |
1. Executive Summary | Edible nuts market 1.1. Global Market Outlook 1.2. Demand-side Trends 1.3. Supply-side Trends 1.4. Technology Roadmap Analysis 1.5. Analysis and Recommendations 2. Market Overview 2.1. Market Coverage / Taxonomy 2.2. Market Definition / Scope / Limitations 3. Market Background 3.1. Market Dynamics 3.1.1. Drivers 3.1.2. Restraints 3.1.3. Opportunity 3.1.4. Trends 3.2. Scenario Forecast 3.2.1. Demand in Optimistic Scenario 3.2.2. Demand in Likely Scenario 3.2.3. Demand in Conservative Scenario 3.3. Product launches & Recent Developments 3.4. Product Life Cycle Analysis 3.5. Value Chain Analysis 3.5.1. Supply Side Participants and their Roles 3.5.1.1. Producers 3.5.1.2. Mid-Level Participants (Traders/ Agents/ Brokers) 3.5.1.3. Wholesalers and Distributors 3.5.2. % of Operating Margin Analysis 3.5.3. List of Existing and Potential Buyer’s 3.6. Pricing Analysis 3.6.1. Price Point Assessment by Region 3.6.2. Price Point Assessment by Application 3.6.3. Price Forecast till 2032 3.6.4. Factors affecting pricing 3.7. Forecast Factors - Relevance & Impact 3.8. Regulatory Landscape 3.9. Regional Parent Market Outlook 3.10. Production and Consumption Statistics 3.11. Consumers Survey Analysis 3.12. Macro-Economic Factors 4. Global Market Analysis 2018 to 2022 and Forecast, 2023 to 2033 4.1. Historical Market Size Value (US$ million) & Volume (MT) Analysis, 2018 to 2022 4.2. Current and Future Market Size Value (US$ million) & Volume (MT) Projections, 2023 to 2033 4.2.1. Y-o-Y Growth Trend Analysis 4.2.2. Absolute $ Opportunity Analysis 5. Global Market Analysis 2018 to 2022 and Forecast 2023 to 2033, By Product Type 5.1. Introduction / Key Findings 5.2. Historical Market Size Value (US$ million) & Volume (MT) Analysis By Product Type, 2018 to 2022 5.3. Current and Future Market Size Value (US$ million) & Volume (MT) Analysis and Forecast By Product Type, 2023 to 2033 5.3.1. Cashews 5.3.2. Almonds 5.3.3. Pistachios 5.3.4. Peanuts 5.3.5. Chestnuts 5.4. Y-o-Y Growth Trend Analysis By Product Type, 2018 to 2022 5.5. Absolute $ Opportunity Analysis By Product Type, 2023 to 2033 6. Global Market Analysis 2018 to 2022 and Forecast 2023 to 2033, By Nature 6.1. Introduction / Key Findings 6.2. Historical Market Size Value (US$ million) & Volume (MT) Analysis By Nature, 2018 to 2022 6.3. Current and Future Market Size Value (US$ million) & Volume (MT) Analysis and Forecast By Nature, 2023 to 2033 6.3.1. Organic 6.3.2. Conventional 6.4. Y-o-Y Growth Trend Analysis By Nature, 2018 to 2022 6.5. Absolute $ Opportunity Analysis By Nature, 2023 to 2033 7. Global Market Analysis 2018 to 2022 and Forecast 2023 to 2033, By Form 7.1. Introduction / Key Findings 7.2. Historical Market Size Value (US$ million) & Volume (MT) Analysis By Form, 2018 to 2022 7.3. Current and Future Market Size Value (US$ million) & Volume (MT) Analysis and Forecast By Form, 2023 to 2033 7.3.1. Whole 7.3.2. Powder 7.3.2.1. Plain 7.3.2.2. Roasted 7.3.2.3. Salted 7.3.2.4. Others (Glazed, Flavored etc.) 7.3.3. Splits 7.4. Y-o-Y Growth Trend Analysis By Form, 2018 to 2022 7.5. Absolute $ Opportunity Analysis By Form, 2023 to 2033 8. Global Market Analysis 2018 to 2022 and Forecast 2023 to 2033, By End-Use 8.1. Introduction / Key Findings 8.2. Historical Market Size Value (US$ million) & Volume (MT) Analysis By End-Use, 2018 to 2022 8.3. Current and Future Market Size Value (US$ million) & Volume (MT) Analysis and Forecast By End-Use, 2023 to 2033 8.3.1. Foodservice industry 8.3.2. Household 8.4. Y-o-Y Growth Trend Analysis By End-Use, 2018 to 2022 8.5. Absolute $ Opportunity Analysis By End-Use, 2023 to 2033 9. Global Market Analysis 2018 to 2022 and Forecast 2023 to 2033, By Region 9.1. Introduction 9.2. Historical Market Size Value (US$ million) & Volume (MT) Analysis By Region, 2018 to 2022 9.3. Current Market Size Value (US$ million) & Volume (MT) Analysis and Forecast By Region, 2023 to 2033 9.3.1. North America 9.3.2. Latin America 9.3.3. Europe 9.3.4. East Asia 9.3.5. South Asia 9.3.6. Oceania 9.3.7. Middle East and Africa 9.4. Market Attractiveness Analysis By Region 10. North America Market Analysis 2018 to 2022 and Forecast 2023 to 2033, By Country 10.1. Historical Market Size Value (US$ million) & Volume (MT) Trend Analysis By Market Taxonomy, 2018 to 2022 10.2. Market Size Value (US$ million) & Volume (MT) Forecast By Market Taxonomy, 2023 to 2033 10.2.1. By Country 10.2.1.1. The United States 10.2.1.2. Canada 10.2.2. By Product Type 10.2.3. By Nature 10.2.4. By Form 10.2.5. By End-Use 10.3. Market Attractiveness Analysis 10.3.1. By Country 10.3.2. By Product Type 10.3.3. By Nature 10.3.4. By Form 10.3.5. By End-Use 10.4. Key Takeaways 11. Latin America Market Analysis 2018 to 2022 and Forecast 2023 to 2033, By Country 11.1. Historical Market Size Value (US$ million) & Volume (MT) Trend Analysis By Market Taxonomy, 2018 to 2022 11.2. Market Size Value (US$ million) & Volume (MT) Forecast By Market Taxonomy, 2023 to 2033 11.2.1. By Country 11.2.1.1. Brazil 11.2.1.2. Mexico 11.2.1.3. Argentina 11.2.1.4. Chile 11.2.1.5. Peru 11.2.1.6. Rest of Latin America 11.2.2. By Product Type 11.2.3. By Nature 11.2.4. By Form 11.2.5. By End-Use 11.3. Market Attractiveness Analysis 11.3.1. By Country 11.3.2. By Product Type 11.3.3. By Nature 11.3.4. By Form 11.3.5. By End-Use 11.4. Key Takeaways 12. Europe Market Analysis 2018 to 2022 and Forecast 2023 to 2033, By Country 12.1. Historical Market Size Value (US$ million) & Volume (MT) Trend Analysis By Market Taxonomy, 2018 to 2022 12.2. Market Size Value (US$ million) & Volume (MT) Forecast By Market Taxonomy, 2023 to 2033 12.2.1. By Country 12.2.1.1. Germany 12.2.1.2. Italy 12.2.1.3. France 12.2.1.4. The United Kingdom 12.2.1.5. Spain 12.2.1.6. Russia 12.2.1.7. BENELUX 12.2.1.8. Poland 12.2.1.9. Nordic Countries 12.2.1.10. Rest of Europe 12.2.2. By Product Type 12.2.3. By Nature 12.2.4. By Form 12.2.5. By End-Use 12.3. Market Attractiveness Analysis 12.3.1. By Country 12.3.2. By Product Type 12.3.3. By Nature 12.3.4. By Form 12.3.5. By End-Use 12.4. Key Takeaways 13. East Asia Market Analysis 2018 to 2022 and Forecast 2023 to 2033, By Country 13.1. Historical Market Size Value (US$ million) & Volume (MT) Trend Analysis By Market Taxonomy, 2018 to 2022 13.2. Market Size Value (US$ million) & Volume (MT) Forecast By Market Taxonomy, 2023 to 2033 13.2.1. By Country 13.2.1.1. China 13.2.1.2. Japan 13.2.1.3. South Korea 13.2.2. By Product Type 13.2.3. By Nature 13.2.4. By Form 13.2.5. By End-Use 13.3. Market Attractiveness Analysis 13.3.1. By Country 13.3.2. By Product Type 13.3.3. By Nature 13.3.4. By Form 13.3.5. By End-Use 13.4. Key Takeaways 14. South Asia Market Analysis 2018 to 2022 and Forecast 2023 to 2033, By Country 14.1. Historical Market Size Value (US$ million) & Volume (MT) Trend Analysis By Market Taxonomy, 2018 to 2022 14.2. Market Size Value (US$ million) & Volume (MT) Forecast By Market Taxonomy, 2023 to 2033 14.2.1. By Country 14.2.1.1. India 14.2.1.2. Thailand 14.2.1.3. Malaysia 14.2.1.4. Indonesia 14.2.1.5. Singapore 14.2.1.6. Rest of South Asia 14.2.2. By Product Type 14.2.3. By Nature 14.2.4. By Form 14.2.5. By End-Use 14.3. Market Attractiveness Analysis 14.3.1. By Country 14.3.2. By Product Type 14.3.3. By Nature 14.3.4. By Form 14.3.5. By End-Use 14.4. Key Takeaways 15. Oceania Market Analysis 2018 to 2022 and Forecast 2023 to 2033, By Country 15.1. Historical Market Size Value (US$ million) & Volume (MT) Trend Analysis By Market Taxonomy, 2018 to 2022 15.2. Market Size Value (US$ million) & Volume (MT) Forecast By Market Taxonomy, 2023 to 2033 15.2.1. By Country 15.2.1.1. Australia 15.2.1.2. New Zealand 15.2.2. By Product Type 15.2.3. By Nature 15.2.4. By Form 15.2.5. By End-Use 15.3. Market Attractiveness Analysis 15.3.1. By Country 15.3.2. By Product Type 15.3.3. By Nature 15.3.4. By Form 15.3.5. By End-Use 15.4. Key Takeaways 16. Middle East and Africa Market Analysis 2018 to 2022 and Forecast 2023 to 2033, By Country 16.1. Historical Market Size Value (US$ million) & Volume (MT) Trend Analysis By Market Taxonomy, 2018 to 2022 16.2. Market Size Value (US$ million) & Volume (MT) Forecast By Market Taxonomy, 2023 to 2033 16.2.1. By Country 16.2.1.1. GCC Countries 16.2.1.2. South Africa 16.2.1.3. Central Africa 16.2.1.4. North Africa 16.2.2. By Product Type 16.2.3. By Nature 16.2.4. By Form 16.2.5. By End-Use 16.3. Market Attractiveness Analysis 16.3.1. By Country 16.3.2. By Product Type 16.3.3. By Nature 16.3.4. By Form 16.3.5. By End-Use 16.4. Key Takeaways 17. Key Countries Market Analysis 17.1. The United States 17.1.1. Pricing Analysis 17.1.2. Market Share Analysis, 2022 17.1.2.1. By Product Type 17.1.2.2. By Nature 17.1.2.3. By Form 17.1.2.4. By End-Use 17.2. Canada 17.2.1. Pricing Analysis 17.2.2. Market Share Analysis, 2022 17.2.2.1. By Product Type 17.2.2.2. By Nature 17.2.2.3. By Form 17.2.2.4. By End-Use 17.3. Brazil 17.3.1. Pricing Analysis 17.3.2. Market Share Analysis, 2022 17.3.2.1. By Product Type 17.3.2.2. By Nature 17.3.2.3. By Form 17.3.2.4. By End-Use 17.4. Mexico 17.4.1. Pricing Analysis 17.4.2. Market Share Analysis, 2022 17.4.2.1. By Product Type 17.4.2.2. By Nature 17.4.2.3. By Form 17.4.2.4. By End-Use 17.5. Argentina 17.5.1. Pricing Analysis 17.5.2. Market Share Analysis, 2022 17.5.2.1. By Product Type 17.5.2.2. By Nature 17.5.2.3. By Form 17.5.2.4. By End-Use 17.6. Chile 17.6.1. Pricing Analysis 17.6.2. Market Share Analysis, 2022 17.6.2.1. By Product Type 17.6.2.2. By Nature 17.6.2.3. By Form 17.6.2.4. By End-Use 17.7. Peru 17.7.1. Pricing Analysis 17.7.2. Market Share Analysis, 2022 17.7.2.1. By Product Type 17.7.2.2. By Nature 17.7.2.3. By Form 17.7.2.4. By End-Use 17.8. Germany 17.8.1. Pricing Analysis 17.8.2. Market Share Analysis, 2022 17.8.2.1. By Product Type 17.8.2.2. By Nature 17.8.2.3. By Form 17.8.2.4. By End-Use 17.9. Italy 17.9.1. Pricing Analysis 17.9.2. Market Share Analysis, 2022 17.9.2.1. By Product Type 17.9.2.2. By Nature 17.9.2.3. By Form 17.9.2.4. By End-Use 17.10. France 17.10.1. Pricing Analysis 17.10.2. Market Share Analysis, 2022 17.10.2.1. By Product Type 17.10.2.2. By Nature 17.10.2.3. By Form 17.10.2.4. By End-Use 17.11. Spain 17.11.1. Pricing Analysis 17.11.2. Market Share Analysis, 2022 17.11.2.1. By Product Type 17.11.2.2. By Nature 17.11.2.3. By Form 17.11.2.4. By End-Use 17.12. The United Kingdom 17.12.1. Pricing Analysis 17.12.2. Market Share Analysis, 2022 17.12.2.1. By Product Type 17.12.2.2. By Nature 17.12.2.3. By Form 17.12.2.4. By End-Use 17.13. Russia 17.13.1. Pricing Analysis 17.13.2. Market Share Analysis, 2022 17.13.2.1. By Product Type 17.13.2.2. By Nature 17.13.2.3. By Form 17.13.2.4. By End-Use 17.14. Poland 17.14.1. Pricing Analysis 17.14.2. Market Share Analysis, 2022 17.14.2.1. By Product Type 17.14.2.2. By Nature 17.14.2.3. By Form 17.14.2.4. By End-Use 17.15. BENELUX 17.15.1. Pricing Analysis 17.15.2. Market Share Analysis, 2022 17.15.2.1. By Product Type 17.15.2.2. By Nature 17.15.2.3. By Form 17.15.2.4. By End-Use 17.16. Nordic Countries 17.16.1. Pricing Analysis 17.16.2. Market Share Analysis, 2022 17.16.2.1. By Product Type 17.16.2.2. By Nature 17.16.2.3. By Form 17.16.2.4. By End-Use 17.17. China 17.17.1. Pricing Analysis 17.17.2. Market Share Analysis, 2022 17.17.2.1. By Product Type 17.17.2.2. By Nature 17.17.2.3. By Form 17.17.2.4. By End-Use 17.18. Japan 17.18.1. Pricing Analysis 17.18.2. Market Share Analysis, 2022 17.18.2.1. By Product Type 17.18.2.2. By Nature 17.18.2.3. By Form 17.18.2.4. By End-Use 17.19. South Korea 17.19.1. Pricing Analysis 17.19.2. Market Share Analysis, 2022 17.19.2.1. By Product Type 17.19.2.2. By Nature 17.19.2.3. By Form 17.19.2.4. By End-Use 17.20. India 17.20.1. Pricing Analysis 17.20.2. Market Share Analysis, 2022 17.20.2.1. By Product Type 17.20.2.2. By Nature 17.20.2.3. By Form 17.20.2.4. By End-Use 17.21. Thailand 17.21.1. Pricing Analysis 17.21.2. Market Share Analysis, 2022 17.21.2.1. By Product Type 17.21.2.2. By Nature 17.21.2.3. By Form 17.21.2.4. By End-Use 17.22. Indonesia 17.22.1. Pricing Analysis 17.22.2. Market Share Analysis, 2022 17.22.2.1. By Product Type 17.22.2.2. By Nature 17.22.2.3. By Form 17.22.2.4. By End-Use 17.23. Malaysia 17.23.1. Pricing Analysis 17.23.2. Market Share Analysis, 2022 17.23.2.1. By Product Type 17.23.2.2. By Nature 17.23.2.3. By Form 17.23.2.4. By End-Use 17.24. Singapore 17.24.1. Pricing Analysis 17.24.2. Market Share Analysis, 2022 17.24.2.1. By Product Type 17.24.2.2. By Nature 17.24.2.3. By Form 17.24.2.4. By End-Use 17.25. Australia 17.25.1. Pricing Analysis 17.25.2. Market Share Analysis, 2022 17.25.2.1. By Product Type 17.25.2.2. By Nature 17.25.2.3. By Form 17.25.2.4. By End-Use 17.26. New Zealand 17.26.1. Pricing Analysis 17.26.2. Market Share Analysis, 2022 17.26.2.1. By Product Type 17.26.2.2. By Nature 17.26.2.3. By Form 17.26.2.4. By End-Use 17.27. GCC Countries 17.27.1. Pricing Analysis 17.27.2. Market Share Analysis, 2022 17.27.2.1. By Product Type 17.27.2.2. By Nature 17.27.2.3. By Form 17.27.2.4. By End-Use 17.28. South Africa 17.28.1. Pricing Analysis 17.28.2. Market Share Analysis, 2022 17.28.2.1. By Product Type 17.28.2.2. By Nature 17.28.2.3. By Form 17.28.2.4. By End-Use 17.29. North Africa 17.29.1. Pricing Analysis 17.29.2. Market Share Analysis, 2022 17.29.2.1. By Product Type 17.29.2.2. By Nature 17.29.2.3. By Form 17.29.2.4. By End-Use 17.30. Central Africa 17.30.1. Pricing Analysis 17.30.2. Market Share Analysis, 2022 17.30.2.1. By Product Type 17.30.2.2. By Nature 17.30.2.3. By Form 17.30.2.4. By End-Use 18. Market Structure Analysis 18.1. Competition Dashboard 18.2. Competition Benchmarking 18.3. Market Share Analysis of Top Players 18.3.1. By Region 18.3.2. By Product Type 18.3.3. By Nature 18.3.4. By Form 18.3.5. By End-Use 19. Competition Analysis 19.1. Competition Deep Dive 19.1.1. Archer Daniels Midland Company 19.1.1.1. Overview 19.1.1.2. Product Portfolio 19.1.1.3. Profitability by Market Segments (Product/Age /Sales Channel/Region) 19.1.1.4. Sales Footprint 19.1.1.5. Strategy Overview 19.1.1.5.1. Marketing Strategy 19.1.1.5.2. Product Strategy 19.1.1.5.3. Channel Strategy 19.1.2. Diamond Foods, Inc. 19.1.2.1. Overview 19.1.2.2. Product Portfolio 19.1.2.3. Profitability by Market Segments (Product/Age /Sales Channel/Region) 19.1.2.4. Sales Footprint 19.1.2.5. Strategy Overview 19.1.2.5.1. Marketing Strategy 19.1.2.5.2. Product Strategy 19.1.2.5.3. Channel Strategy 19.1.3. Olam International Ltd 19.1.3.1. Overview 19.1.3.2. Product Portfolio 19.1.3.3. Profitability by Market Segments (Product/Age /Sales Channel/Region) 19.1.3.4. Sales Footprint 19.1.3.5. Strategy Overview 19.1.3.5.1. Marketing Strategy 19.1.3.5.2. Product Strategy 19.1.3.5.3. Channel Strategy 19.1.4. Blue Diamond Growers 19.1.4.1. Overview 19.1.4.2. Product Portfolio 19.1.4.3. Profitability by Market Segments (Product/Age /Sales Channel/Region) 19.1.4.4. Sales Footprint 19.1.4.5. Strategy Overview 19.1.4.5.1. Marketing Strategy 19.1.4.5.2. Product Strategy 19.1.4.5.3. Channel Strategy 19.1.5. Mariani Nut Company 19.1.5.1. Overview 19.1.5.2. Product Portfolio 19.1.5.3. Profitability by Market Segments (Product/Age /Sales Channel/Region) 19.1.5.4. Sales Footprint 19.1.5.5. Strategy Overview 19.1.5.5.1. Marketing Strategy 19.1.5.5.2. Product Strategy 19.1.5.5.3. Channel Strategy 19.1.6. Select Harvests Limited 19.1.6.1. Overview 19.1.6.2. Product Portfolio 19.1.6.3. Profitability by Market Segments (Product/Age /Sales Channel/Region) 19.1.6.4. Sales Footprint 19.1.6.5. Strategy Overview 19.1.6.5.1. Marketing Strategy 19.1.6.5.2. Product Strategy 19.1.6.5.3. Channel Strategy 19.1.7. Durak Findik 19.1.7.1. Overview 19.1.7.2. Product Portfolio 19.1.7.3. Profitability by Market Segments (Product/Age /Sales Channel/Region) 19.1.7.4. Sales Footprint 19.1.7.5. Strategy Overview 19.1.7.5.1. Marketing Strategy 19.1.7.5.2. Product Strategy 19.1.7.5.3. Channel Strategy 19.1.8. Grower Direct Nut Co. Ltd 19.1.8.1. Overview 19.1.8.2. Product Portfolio 19.1.8.3. Profitability by Market Segments (Product/Age /Sales Channel/Region) 19.1.8.4. Sales Footprint 19.1.8.5. Strategy Overview 19.1.8.5.1. Marketing Strategy 19.1.8.5.2. Product Strategy 19.1.8.5.3. Channel Strategy 19.1.9. Sun-Maid Growers of California 19.1.9.1. Overview 19.1.9.2. Product Portfolio 19.1.9.3. Profitability by Market Segments (Product/Age /Sales Channel/Region) 19.1.9.4. Sales Footprint 19.1.9.5. Strategy Overview 19.1.9.5.1. Marketing Strategy 19.1.9.5.2. Product Strategy 19.1.9.5.3. Channel Strategy 19.1.10. Hines Nut Company 19.1.10.1. Overview 19.1.10.2. Product Portfolio 19.1.10.3. Profitability by Market Segments (Product/Age /Sales Channel/Region) 19.1.10.4. Sales Footprint 19.1.10.5. Strategy Overview 19.1.10.5.1. Marketing Strategy 19.1.10.5.2. Product Strategy 19.1.10.5.3. Channel Strategy 19.1.11. John B. Sanfilippo & Son 19.1.11.1. Overview 19.1.11.2. Product Portfolio 19.1.11.3. Profitability by Market Segments (Product/Age /Sales Channel/Region) 19.1.11.4. Sales Footprint 19.1.11.5. Strategy Overview 19.1.11.5.1. Marketing Strategy 19.1.11.5.2. Product Strategy 19.1.11.5.3. Channel Strategy 19.1.12. Borges Agricultural & Industrial Nuts 19.1.12.1. Overview 19.1.12.2. Product Portfolio 19.1.12.3. Profitability by Market Segments (Product/Age /Sales Channel/Region) 19.1.12.4. Sales Footprint 19.1.12.5. Strategy Overview 19.1.12.5.1. Marketing Strategy 19.1.12.5.2. Product Strategy 19.1.12.5.3. Channel Strategy 19.1.13. The Wonderful Company LLC 19.1.13.1. Overview 19.1.13.2. Product Portfolio 19.1.13.3. Profitability by Market Segments (Product/Age /Sales Channel/Region) 19.1.13.4. Sales Footprint 19.1.13.5. Strategy Overview 19.1.13.5.1. Marketing Strategy 19.1.13.5.2. Product Strategy 19.1.13.5.3. Channel Strategy 19.1.14. Germack Pistachio Company 19.1.14.1. Overview 19.1.14.2. Product Portfolio 19.1.14.3. Profitability by Market Segments (Product/Age /Sales Channel/Region) 19.1.14.4. Sales Footprint 19.1.14.5. Strategy Overview 19.1.14.5.1. Marketing Strategy 19.1.14.5.2. Product Strategy 19.1.14.5.3. Channel Strategy 19.1.15. Nichols Farms 19.1.15.1. Overview 19.1.15.2. Product Portfolio 19.1.15.3. Profitability by Market Segments (Product/Age /Sales Channel/Region) 19.1.15.4. Sales Footprint 19.1.15.5. Strategy Overview 19.1.15.5.1. Marketing Strategy 19.1.15.5.2. Product Strategy 19.1.15.5.3. Channel Strategy 19.1.16. Setton Pistachio of Terra Bella Inc. 19.1.16.1. Overview 19.1.16.2. Product Portfolio 19.1.16.3. Profitability by Market Segments (Product/Age /Sales Channel/Region) 19.1.16.4. Sales Footprint 19.1.16.5. Strategy Overview 19.1.16.5.1. Marketing Strategy 19.1.16.5.2. Product Strategy 19.1.16.5.3. Channel Strategy 19.1.17. Other 19.1.17.1. Overview 19.1.17.2. Product Portfolio 19.1.17.3. Profitability by Market Segments (Product/Age /Sales Channel/Region) 19.1.17.4. Sales Footprint 19.1.17.5. Strategy Overview 19.1.17.5.1. Marketing Strategy 19.1.17.5.2. Product Strategy 19.1.17.5.3. Channel Strategy 20. Assumptions & Acronyms Used 21. Research Methodology
Don't pay for what you don't need
Customize your report by selecting specific countries or regions and save 30%!
Table 1: Global Market Value (US$ million) Forecast by Region, 2018 to 2033 Table 2: Global Market Volume (MT) Forecast by Region, 2018 to 2033 Table 3: Global Market Value (US$ million) Forecast by Product Type, 2018 to 2033 Table 4: Global Market Volume (MT) Forecast by Product Type, 2018 to 2033 Table 5: Global Market Value (US$ million) Forecast by Nature, 2018 to 2033 Table 6: Global Market Volume (MT) Forecast by Nature, 2018 to 2033 Table 7: Global Market Value (US$ million) Forecast by Form, 2018 to 2033 Table 8: Global Market Volume (MT) Forecast by Form, 2018 to 2033 Table 9: Global Market Value (US$ million) Forecast by End-Use, 2018 to 2033 Table 10: Global Market Volume (MT) Forecast by End-Use, 2018 to 2033 Table 11: North America Market Value (US$ million) Forecast by Country, 2018 to 2033 Table 12: North America Market Volume (MT) Forecast by Country, 2018 to 2033 Table 13: North America Market Value (US$ million) Forecast by Product Type, 2018 to 2033 Table 14: North America Market Volume (MT) Forecast by Product Type, 2018 to 2033 Table 15: North America Market Value (US$ million) Forecast by Nature, 2018 to 2033 Table 16: North America Market Volume (MT) Forecast by Nature, 2018 to 2033 Table 17: North America Market Value (US$ million) Forecast by Form, 2018 to 2033 Table 18: North America Market Volume (MT) Forecast by Form, 2018 to 2033 Table 19: North America Market Value (US$ million) Forecast by End-Use, 2018 to 2033 Table 20: North America Market Volume (MT) Forecast by End-Use, 2018 to 2033 Table 21: Latin America Market Value (US$ million) Forecast by Country, 2018 to 2033 Table 22: Latin America Market Volume (MT) Forecast by Country, 2018 to 2033 Table 23: Latin America Market Value (US$ million) Forecast by Product Type, 2018 to 2033 Table 24: Latin America Market Volume (MT) Forecast by Product Type, 2018 to 2033 Table 25: Latin America Market Value (US$ million) Forecast by Nature, 2018 to 2033 Table 26: Latin America Market Volume (MT) Forecast by Nature, 2018 to 2033 Table 27: Latin America Market Value (US$ million) Forecast by Form, 2018 to 2033 Table 28: Latin America Market Volume (MT) Forecast by Form, 2018 to 2033 Table 29: Latin America Market Value (US$ million) Forecast by End-Use, 2018 to 2033 Table 30: Latin America Market Volume (MT) Forecast by End-Use, 2018 to 2033 Table 31: Europe Market Value (US$ million) Forecast by Country, 2018 to 2033 Table 32: Europe Market Volume (MT) Forecast by Country, 2018 to 2033 Table 33: Europe Market Value (US$ million) Forecast by Product Type, 2018 to 2033 Table 34: Europe Market Volume (MT) Forecast by Product Type, 2018 to 2033 Table 35: Europe Market Value (US$ million) Forecast by Nature, 2018 to 2033 Table 36: Europe Market Volume (MT) Forecast by Nature, 2018 to 2033 Table 37: Europe Market Value (US$ million) Forecast by Form, 2018 to 2033 Table 38: Europe Market Volume (MT) Forecast by Form, 2018 to 2033 Table 39: Europe Market Value (US$ million) Forecast by End-Use, 2018 to 2033 Table 40: Europe Market Volume (MT) Forecast by End-Use, 2018 to 2033 Table 41: East Asia Market Value (US$ million) Forecast by Country, 2018 to 2033 Table 42: East Asia Market Volume (MT) Forecast by Country, 2018 to 2033 Table 43: East Asia Market Value (US$ million) Forecast by Product Type, 2018 to 2033 Table 44: East Asia Market Volume (MT) Forecast by Product Type, 2018 to 2033 Table 45: East Asia Market Value (US$ million) Forecast by Nature, 2018 to 2033 Table 46: East Asia Market Volume (MT) Forecast by Nature, 2018 to 2033 Table 47: East Asia Market Value (US$ million) Forecast by Form, 2018 to 2033 Table 48: East Asia Market Volume (MT) Forecast by Form, 2018 to 2033 Table 49: East Asia Market Value (US$ million) Forecast by End-Use, 2018 to 2033 Table 50: East Asia Market Volume (MT) Forecast by End-Use, 2018 to 2033 Table 51: South Asia Market Value (US$ million) Forecast by Country, 2018 to 2033 Table 52: South Asia Market Volume (MT) Forecast by Country, 2018 to 2033 Table 53: South Asia Market Value (US$ million) Forecast by Product Type, 2018 to 2033 Table 54: South Asia Market Volume (MT) Forecast by Product Type, 2018 to 2033 Table 55: South Asia Market Value (US$ million) Forecast by Nature, 2018 to 2033 Table 56: South Asia Market Volume (MT) Forecast by Nature, 2018 to 2033 Table 57: South Asia Market Value (US$ million) Forecast by Form, 2018 to 2033 Table 58: South Asia Market Volume (MT) Forecast by Form, 2018 to 2033 Table 59: South Asia Market Value (US$ million) Forecast by End-Use, 2018 to 2033 Table 60: South Asia Market Volume (MT) Forecast by End-Use, 2018 to 2033 Table 61: Oceania Market Value (US$ million) Forecast by Country, 2018 to 2033 Table 62: Oceania Market Volume (MT) Forecast by Country, 2018 to 2033 Table 63: Oceania Market Value (US$ million) Forecast by Product Type, 2018 to 2033 Table 64: Oceania Market Volume (MT) Forecast by Product Type, 2018 to 2033 Table 65: Oceania Market Value (US$ million) Forecast by Nature, 2018 to 2033 Table 66: Oceania Market Volume (MT) Forecast by Nature, 2018 to 2033 Table 67: Oceania Market Value (US$ million) Forecast by Form, 2018 to 2033 Table 68: Oceania Market Volume (MT) Forecast by Form, 2018 to 2033 Table 69: Oceania Market Value (US$ million) Forecast by End-Use, 2018 to 2033 Table 70: Oceania Market Volume (MT) Forecast by End-Use, 2018 to 2033 Table 71: Middle East and Africa Market Value (US$ million) Forecast by Country, 2018 to 2033 Table 72: Middle East and Africa Market Volume (MT) Forecast by Country, 2018 to 2033 Table 73: Middle East and Africa Market Value (US$ million) Forecast by Product Type, 2018 to 2033 Table 74: Middle East and Africa Market Volume (MT) Forecast by Product Type, 2018 to 2033 Table 75: Middle East and Africa Market Value (US$ million) Forecast by Nature, 2018 to 2033 Table 76: Middle East and Africa Market Volume (MT) Forecast by Nature, 2018 to 2033 Table 77: Middle East and Africa Market Value (US$ million) Forecast by Form, 2018 to 2033 Table 78: Middle East and Africa Market Volume (MT) Forecast by Form, 2018 to 2033 Table 79: Middle East and Africa Market Value (US$ million) Forecast by End-Use, 2018 to 2033 Table 80: Middle East and Africa Market Volume (MT) Forecast by End-Use, 2018 to 2033
Figure 1: Global Market Value (US$ million) by Product Type, 2023 to 2033 Figure 2: Global Market Value (US$ million) by Nature, 2023 to 2033 Figure 3: Global Market Value (US$ million) by Form, 2023 to 2033 Figure 4: Global Market Value (US$ million) by End-Use, 2023 to 2033 Figure 5: Global Market Value (US$ million) by Region, 2023 to 2033 Figure 6: Global Market Value (US$ million) Analysis by Region, 2018 to 2033 Figure 7: Global Market Volume (MT) Analysis by Region, 2018 to 2033 Figure 8: Global Market Value Share (%) and BPS Analysis by Region, 2023 to 2033 Figure 9: Global Market Y-o-Y Growth (%) Projections by Region, 2023 to 2033 Figure 10: Global Market Value (US$ million) Analysis by Product Type, 2018 to 2033 Figure 11: Global Market Volume (MT) Analysis by Product Type, 2018 to 2033 Figure 12: Global Market Value Share (%) and BPS Analysis by Product Type, 2023 to 2033 Figure 13: Global Market Y-o-Y Growth (%) Projections by Product Type, 2023 to 2033 Figure 14: Global Market Value (US$ million) Analysis by Nature, 2018 to 2033 Figure 15: Global Market Volume (MT) Analysis by Nature, 2018 to 2033 Figure 16: Global Market Value Share (%) and BPS Analysis by Nature, 2023 to 2033 Figure 17: Global Market Y-o-Y Growth (%) Projections by Nature, 2023 to 2033 Figure 18: Global Market Value (US$ million) Analysis by Form, 2018 to 2033 Figure 19: Global Market Volume (MT) Analysis by Form, 2018 to 2033 Figure 20: Global Market Value Share (%) and BPS Analysis by Form, 2023 to 2033 Figure 21: Global Market Y-o-Y Growth (%) Projections by Form, 2023 to 2033 Figure 22: Global Market Value (US$ million) Analysis by End-Use, 2018 to 2033 Figure 23: Global Market Volume (MT) Analysis by End-Use, 2018 to 2033 Figure 24: Global Market Value Share (%) and BPS Analysis by End-Use, 2023 to 2033 Figure 25: Global Market Y-o-Y Growth (%) Projections by End-Use, 2023 to 2033 Figure 26: Global Market Attractiveness by Product Type, 2023 to 2033 Figure 27: Global Market Attractiveness by Nature, 2023 to 2033 Figure 28: Global Market Attractiveness by Form, 2023 to 2033 Figure 29: Global Market Attractiveness by End-Use, 2023 to 2033 Figure 30: Global Market Attractiveness by Region, 2023 to 2033 Figure 31: North America Market Value (US$ million) by Product Type, 2023 to 2033 Figure 32: North America Market Value (US$ million) by Nature, 2023 to 2033 Figure 33: North America Market Value (US$ million) by Form, 2023 to 2033 Figure 34: North America Market Value (US$ million) by End-Use, 2023 to 2033 Figure 35: North America Market Value (US$ million) by Country, 2023 to 2033 Figure 36: North America Market Value (US$ million) Analysis by Country, 2018 to 2033 Figure 37: North America Market Volume (MT) Analysis by Country, 2018 to 2033 Figure 38: North America Market Value Share (%) and BPS Analysis by Country, 2023 to 2033 Figure 39: North America Market Y-o-Y Growth (%) Projections by Country, 2023 to 2033 Figure 40: North America Market Value (US$ million) Analysis by Product Type, 2018 to 2033 Figure 41: North America Market Volume (MT) Analysis by Product Type, 2018 to 2033 Figure 42: North America Market Value Share (%) and BPS Analysis by Product Type, 2023 to 2033 Figure 43: North America Market Y-o-Y Growth (%) Projections by Product Type, 2023 to 2033 Figure 44: North America Market Value (US$ million) Analysis by Nature, 2018 to 2033 Figure 45: North America Market Volume (MT) Analysis by Nature, 2018 to 2033 Figure 46: North America Market Value Share (%) and BPS Analysis by Nature, 2023 to 2033 Figure 47: North America Market Y-o-Y Growth (%) Projections by Nature, 2023 to 2033 Figure 48: North America Market Value (US$ million) Analysis by Form, 2018 to 2033 Figure 49: North America Market Volume (MT) Analysis by Form, 2018 to 2033 Figure 50: North America Market Value Share (%) and BPS Analysis by Form, 2023 to 2033 Figure 51: North America Market Y-o-Y Growth (%) Projections by Form, 2023 to 2033 Figure 52: North America Market Value (US$ million) Analysis by End-Use, 2018 to 2033 Figure 53: North America Market Volume (MT) Analysis by End-Use, 2018 to 2033 Figure 54: North America Market Value Share (%) and BPS Analysis by End-Use, 2023 to 2033 Figure 55: North America Market Y-o-Y Growth (%) Projections by End-Use, 2023 to 2033 Figure 56: North America Market Attractiveness by Product Type, 2023 to 2033 Figure 57: North America Market Attractiveness by Nature, 2023 to 2033 Figure 58: North America Market Attractiveness by Form, 2023 to 2033 Figure 59: North America Market Attractiveness by End-Use, 2023 to 2033 Figure 60: North America Market Attractiveness by Country, 2023 to 2033 Figure 61: Latin America Market Value (US$ million) by Product Type, 2023 to 2033 Figure 62: Latin America Market Value (US$ million) by Nature, 2023 to 2033 Figure 63: Latin America Market Value (US$ million) by Form, 2023 to 2033 Figure 64: Latin America Market Value (US$ million) by End-Use, 2023 to 2033 Figure 65: Latin America Market Value (US$ million) by Country, 2023 to 2033 Figure 66: Latin America Market Value (US$ million) Analysis by Country, 2018 to 2033 Figure 67: Latin America Market Volume (MT) Analysis by Country, 2018 to 2033 Figure 68: Latin America Market Value Share (%) and BPS Analysis by Country, 2023 to 2033 Figure 69: Latin America Market Y-o-Y Growth (%) Projections by Country, 2023 to 2033 Figure 70: Latin America Market Value (US$ million) Analysis by Product Type, 2018 to 2033 Figure 71: Latin America Market Volume (MT) Analysis by Product Type, 2018 to 2033 Figure 72: Latin America Market Value Share (%) and BPS Analysis by Product Type, 2023 to 2033 Figure 73: Latin America Market Y-o-Y Growth (%) Projections by Product Type, 2023 to 2033 Figure 74: Latin America Market Value (US$ million) Analysis by Nature, 2018 to 2033 Figure 75: Latin America Market Volume (MT) Analysis by Nature, 2018 to 2033 Figure 76: Latin America Market Value Share (%) and BPS Analysis by Nature, 2023 to 2033 Figure 77: Latin America Market Y-o-Y Growth (%) Projections by Nature, 2023 to 2033 Figure 78: Latin America Market Value (US$ million) Analysis by Form, 2018 to 2033 Figure 79: Latin America Market Volume (MT) Analysis by Form, 2018 to 2033 Figure 80: Latin America Market Value Share (%) and BPS Analysis by Form, 2023 to 2033 Figure 81: Latin America Market Y-o-Y Growth (%) Projections by Form, 2023 to 2033 Figure 82: Latin America Market Value (US$ million) Analysis by End-Use, 2018 to 2033 Figure 83: Latin America Market Volume (MT) Analysis by End-Use, 2018 to 2033 Figure 84: Latin America Market Value Share (%) and BPS Analysis by End-Use, 2023 to 2033 Figure 85: Latin America Market Y-o-Y Growth (%) Projections by End-Use, 2023 to 2033 Figure 86: Latin America Market Attractiveness by Product Type, 2023 to 2033 Figure 87: Latin America Market Attractiveness by Nature, 2023 to 2033 Figure 88: Latin America Market Attractiveness by Form, 2023 to 2033 Figure 89: Latin America Market Attractiveness by End-Use, 2023 to 2033 Figure 90: Latin America Market Attractiveness by Country, 2023 to 2033 Figure 91: Europe Market Value (US$ million) by Product Type, 2023 to 2033 Figure 92: Europe Market Value (US$ million) by Nature, 2023 to 2033 Figure 93: Europe Market Value (US$ million) by Form, 2023 to 2033 Figure 94: Europe Market Value (US$ million) by End-Use, 2023 to 2033 Figure 95: Europe Market Value (US$ million) by Country, 2023 to 2033 Figure 96: Europe Market Value (US$ million) Analysis by Country, 2018 to 2033 Figure 97: Europe Market Volume (MT) Analysis by Country, 2018 to 2033 Figure 98: Europe Market Value Share (%) and BPS Analysis by Country, 2023 to 2033 Figure 99: Europe Market Y-o-Y Growth (%) Projections by Country, 2023 to 2033 Figure 100: Europe Market Value (US$ million) Analysis by Product Type, 2018 to 2033 Figure 101: Europe Market Volume (MT) Analysis by Product Type, 2018 to 2033 Figure 102: Europe Market Value Share (%) and BPS Analysis by Product Type, 2023 to 2033 Figure 103: Europe Market Y-o-Y Growth (%) Projections by Product Type, 2023 to 2033 Figure 104: Europe Market Value (US$ million) Analysis by Nature, 2018 to 2033 Figure 105: Europe Market Volume (MT) Analysis by Nature, 2018 to 2033 Figure 106: Europe Market Value Share (%) and BPS Analysis by Nature, 2023 to 2033 Figure 107: Europe Market Y-o-Y Growth (%) Projections by Nature, 2023 to 2033 Figure 108: Europe Market Value (US$ million) Analysis by Form, 2018 to 2033 Figure 109: Europe Market Volume (MT) Analysis by Form, 2018 to 2033 Figure 110: Europe Market Value Share (%) and BPS Analysis by Form, 2023 to 2033 Figure 111: Europe Market Y-o-Y Growth (%) Projections by Form, 2023 to 2033 Figure 112: Europe Market Value (US$ million) Analysis by End-Use, 2018 to 2033 Figure 113: Europe Market Volume (MT) Analysis by End-Use, 2018 to 2033 Figure 114: Europe Market Value Share (%) and BPS Analysis by End-Use, 2023 to 2033 Figure 115: Europe Market Y-o-Y Growth (%) Projections by End-Use, 2023 to 2033 Figure 116: Europe Market Attractiveness by Product Type, 2023 to 2033 Figure 117: Europe Market Attractiveness by Nature, 2023 to 2033 Figure 118: Europe Market Attractiveness by Form, 2023 to 2033 Figure 119: Europe Market Attractiveness by End-Use, 2023 to 2033 Figure 120: Europe Market Attractiveness by Country, 2023 to 2033 Figure 121: East Asia Market Value (US$ million) by Product Type, 2023 to 2033 Figure 122: East Asia Market Value (US$ million) by Nature, 2023 to 2033 Figure 123: East Asia Market Value (US$ million) by Form, 2023 to 2033 Figure 124: East Asia Market Value (US$ million) by End-Use, 2023 to 2033 Figure 125: East Asia Market Value (US$ million) by Country, 2023 to 2033 Figure 126: East Asia Market Value (US$ million) Analysis by Country, 2018 to 2033 Figure 127: East Asia Market Volume (MT) Analysis by Country, 2018 to 2033 Figure 128: East Asia Market Value Share (%) and BPS Analysis by Country, 2023 to 2033 Figure 129: East Asia Market Y-o-Y Growth (%) Projections by Country, 2023 to 2033 Figure 130: East Asia Market Value (US$ million) Analysis by Product Type, 2018 to 2033 Figure 131: East Asia Market Volume (MT) Analysis by Product Type, 2018 to 2033 Figure 132: East Asia Market Value Share (%) and BPS Analysis by Product Type, 2023 to 2033 Figure 133: East Asia Market Y-o-Y Growth (%) Projections by Product Type, 2023 to 2033 Figure 134: East Asia Market Value (US$ million) Analysis by Nature, 2018 to 2033 Figure 135: East Asia Market Volume (MT) Analysis by Nature, 2018 to 2033 Figure 136: East Asia Market Value Share (%) and BPS Analysis by Nature, 2023 to 2033 Figure 137: East Asia Market Y-o-Y Growth (%) Projections by Nature, 2023 to 2033 Figure 138: East Asia Market Value (US$ million) Analysis by Form, 2018 to 2033 Figure 139: East Asia Market Volume (MT) Analysis by Form, 2018 to 2033 Figure 140: East Asia Market Value Share (%) and BPS Analysis by Form, 2023 to 2033 Figure 141: East Asia Market Y-o-Y Growth (%) Projections by Form, 2023 to 2033 Figure 142: East Asia Market Value (US$ million) Analysis by End-Use, 2018 to 2033 Figure 143: East Asia Market Volume (MT) Analysis by End-Use, 2018 to 2033 Figure 144: East Asia Market Value Share (%) and BPS Analysis by End-Use, 2023 to 2033 Figure 145: East Asia Market Y-o-Y Growth (%) Projections by End-Use, 2023 to 2033 Figure 146: East Asia Market Attractiveness by Product Type, 2023 to 2033 Figure 147: East Asia Market Attractiveness by Nature, 2023 to 2033 Figure 148: East Asia Market Attractiveness by Form, 2023 to 2033 Figure 149: East Asia Market Attractiveness by End-Use, 2023 to 2033 Figure 150: East Asia Market Attractiveness by Country, 2023 to 2033 Figure 151: South Asia Market Value (US$ million) by Product Type, 2023 to 2033 Figure 152: South Asia Market Value (US$ million) by Nature, 2023 to 2033 Figure 153: South Asia Market Value (US$ million) by Form, 2023 to 2033 Figure 154: South Asia Market Value (US$ million) by End-Use, 2023 to 2033 Figure 155: South Asia Market Value (US$ million) by Country, 2023 to 2033 Figure 156: South Asia Market Value (US$ million) Analysis by Country, 2018 to 2033 Figure 157: South Asia Market Volume (MT) Analysis by Country, 2018 to 2033 Figure 158: South Asia Market Value Share (%) and BPS Analysis by Country, 2023 to 2033 Figure 159: South Asia Market Y-o-Y Growth (%) Projections by Country, 2023 to 2033 Figure 160: South Asia Market Value (US$ million) Analysis by Product Type, 2018 to 2033 Figure 161: South Asia Market Volume (MT) Analysis by Product Type, 2018 to 2033 Figure 162: South Asia Market Value Share (%) and BPS Analysis by Product Type, 2023 to 2033 Figure 163: South Asia Market Y-o-Y Growth (%) Projections by Product Type, 2023 to 2033 Figure 164: South Asia Market Value (US$ million) Analysis by Nature, 2018 to 2033 Figure 165: South Asia Market Volume (MT) Analysis by Nature, 2018 to 2033 Figure 166: South Asia Market Value Share (%) and BPS Analysis by Nature, 2023 to 2033 Figure 167: South Asia Market Y-o-Y Growth (%) Projections by Nature, 2023 to 2033 Figure 168: South Asia Market Value (US$ million) Analysis by Form, 2018 to 2033 Figure 169: South Asia Market Volume (MT) Analysis by Form, 2018 to 2033 Figure 170: South Asia Market Value Share (%) and BPS Analysis by Form, 2023 to 2033 Figure 171: South Asia Market Y-o-Y Growth (%) Projections by Form, 2023 to 2033 Figure 172: South Asia Market Value (US$ million) Analysis by End-Use, 2018 to 2033 Figure 173: South Asia Market Volume (MT) Analysis by End-Use, 2018 to 2033 Figure 174: South Asia Market Value Share (%) and BPS Analysis by End-Use, 2023 to 2033 Figure 175: South Asia Market Y-o-Y Growth (%) Projections by End-Use, 2023 to 2033 Figure 176: South Asia Market Attractiveness by Product Type, 2023 to 2033 Figure 177: South Asia Market Attractiveness by Nature, 2023 to 2033 Figure 178: South Asia Market Attractiveness by Form, 2023 to 2033 Figure 179: South Asia Market Attractiveness by End-Use, 2023 to 2033 Figure 180: South Asia Market Attractiveness by Country, 2023 to 2033 Figure 181: Oceania Market Value (US$ million) by Product Type, 2023 to 2033 Figure 182: Oceania Market Value (US$ million) by Nature, 2023 to 2033 Figure 183: Oceania Market Value (US$ million) by Form, 2023 to 2033 Figure 184: Oceania Market Value (US$ million) by End-Use, 2023 to 2033 Figure 185: Oceania Market Value (US$ million) by Country, 2023 to 2033 Figure 186: Oceania Market Value (US$ million) Analysis by Country, 2018 to 2033 Figure 187: Oceania Market Volume (MT) Analysis by Country, 2018 to 2033 Figure 188: Oceania Market Value Share (%) and BPS Analysis by Country, 2023 to 2033 Figure 189: Oceania Market Y-o-Y Growth (%) Projections by Country, 2023 to 2033 Figure 190: Oceania Market Value (US$ million) Analysis by Product Type, 2018 to 2033 Figure 191: Oceania Market Volume (MT) Analysis by Product Type, 2018 to 2033 Figure 192: Oceania Market Value Share (%) and BPS Analysis by Product Type, 2023 to 2033 Figure 193: Oceania Market Y-o-Y Growth (%) Projections by Product Type, 2023 to 2033 Figure 194: Oceania Market Value (US$ million) Analysis by Nature, 2018 to 2033 Figure 195: Oceania Market Volume (MT) Analysis by Nature, 2018 to 2033 Figure 196: Oceania Market Value Share (%) and BPS Analysis by Nature, 2023 to 2033 Figure 197: Oceania Market Y-o-Y Growth (%) Projections by Nature, 2023 to 2033 Figure 198: Oceania Market Value (US$ million) Analysis by Form, 2018 to 2033 Figure 199: Oceania Market Volume (MT) Analysis by Form, 2018 to 2033 Figure 200: Oceania Market Value Share (%) and BPS Analysis by Form, 2023 to 2033 Figure 201: Oceania Market Y-o-Y Growth (%) Projections by Form, 2023 to 2033 Figure 202: Oceania Market Value (US$ million) Analysis by End-Use, 2018 to 2033 Figure 203: Oceania Market Volume (MT) Analysis by End-Use, 2018 to 2033 Figure 204: Oceania Market Value Share (%) and BPS Analysis by End-Use, 2023 to 2033 Figure 205: Oceania Market Y-o-Y Growth (%) Projections by End-Use, 2023 to 2033 Figure 206: Oceania Market Attractiveness by Product Type, 2023 to 2033 Figure 207: Oceania Market Attractiveness by Nature, 2023 to 2033 Figure 208: Oceania Market Attractiveness by Form, 2023 to 2033 Figure 209: Oceania Market Attractiveness by End-Use, 2023 to 2033 Figure 210: Oceania Market Attractiveness by Country, 2023 to 2033 Figure 211: Middle East and Africa Market Value (US$ million) by Product Type, 2023 to 2033 Figure 212: Middle East and Africa Market Value (US$ million) by Nature, 2023 to 2033 Figure 213: Middle East and Africa Market Value (US$ million) by Form, 2023 to 2033 Figure 214: Middle East and Africa Market Value (US$ million) by End-Use, 2023 to 2033 Figure 215: Middle East and Africa Market Value (US$ million) by Country, 2023 to 2033 Figure 216: Middle East and Africa Market Value (US$ million) Analysis by Country, 2018 to 2033 Figure 217: Middle East and Africa Market Volume (MT) Analysis by Country, 2018 to 2033 Figure 218: Middle East and Africa Market Value Share (%) and BPS Analysis by Country, 2023 to 2033 Figure 219: Middle East and Africa Market Y-o-Y Growth (%) Projections by Country, 2023 to 2033 Figure 220: Middle East and Africa Market Value (US$ million) Analysis by Product Type, 2018 to 2033 Figure 221: Middle East and Africa Market Volume (MT) Analysis by Product Type, 2018 to 2033 Figure 222: Middle East and Africa Market Value Share (%) and BPS Analysis by Product Type, 2023 to 2033 Figure 223: Middle East and Africa Market Y-o-Y Growth (%) Projections by Product Type, 2023 to 2033 Figure 224: Middle East and Africa Market Value (US$ million) Analysis by Nature, 2018 to 2033 Figure 225: Middle East and Africa Market Volume (MT) Analysis by Nature, 2018 to 2033 Figure 226: Middle East and Africa Market Value Share (%) and BPS Analysis by Nature, 2023 to 2033 Figure 227: Middle East and Africa Market Y-o-Y Growth (%) Projections by Nature, 2023 to 2033 Figure 228: Middle East and Africa Market Value (US$ million) Analysis by Form, 2018 to 2033 Figure 229: Middle East and Africa Market Volume (MT) Analysis by Form, 2018 to 2033 Figure 230: Middle East and Africa Market Value Share (%) and BPS Analysis by Form, 2023 to 2033 Figure 231: Middle East and Africa Market Y-o-Y Growth (%) Projections by Form, 2023 to 2033 Figure 232: Middle East and Africa Market Value (US$ million) Analysis by End-Use, 2018 to 2033 Figure 233: Middle East and Africa Market Volume (MT) Analysis by End-Use, 2018 to 2033 Figure 234: Middle East and Africa Market Value Share (%) and BPS Analysis by End-Use, 2023 to 2033 Figure 235: Middle East and Africa Market Y-o-Y Growth (%) Projections by End-Use, 2023 to 2033 Figure 236: Middle East and Africa Market Attractiveness by Product Type, 2023 to 2033 Figure 237: Middle East and Africa Market Attractiveness by Nature, 2023 to 2033 Figure 238: Middle East and Africa Market Attractiveness by Form, 2023 to 2033 Figure 239: Middle East and Africa Market Attractiveness by End-Use, 2023 to 2033 Figure 240: Middle East and Africa Market Attractiveness by Country, 2023 to 2033
Recommendations
Explore Food and Beverage Insights
View Reports