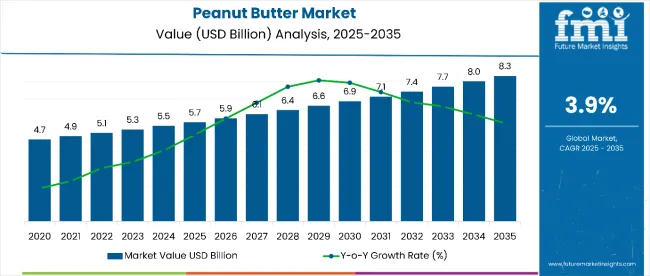
The global peanut butter market is expected to grow significantly over the next decade, with its value projected to increase from USD 5.68 billion in 2025 to USD 8.33 billion by 2035. This growth reflects a steady CAGR of 3.9% during the forecast period.
| Metric | Value |
|---|---|
| Industry Size (2025E) | USD 5.68 billion |
| Industry Value (2035F) | USD 8.33 billion |
| CAGR (2025 to 2035) | 3.9% |
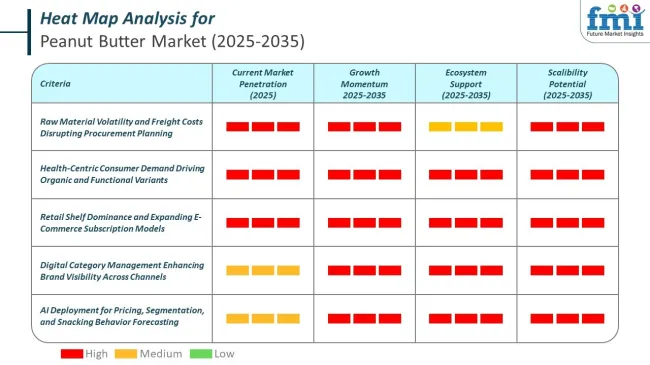
The market’s upward trajectory highlights increasing global demand for healthier, more convenient food choices, particularly as lifestyles become more fast-paced and consumers prioritize nutrient-dense snacking options. The expanding middle class and rising disposable incomes in many regions, especially in Asia Pacific and parts of Europe, are also contributing to increased purchasing power and changing food preferences, further fueling market growth.
A major driving force behind the rising demand for peanut butter is the global shift toward health and wellness. Consumers, particularly millennials and Gen Z, are increasingly focused on protein-rich, plant-based, and low-sugar food alternatives. Peanut butter fits neatly into this category, offering a convenient source of plant-based protein, healthy fats, and essential nutrients.
The growing awareness about the role of diet in preventing chronic diseases such as obesity, diabetes, and heart conditions has positioned peanut butter as a favorable choice among health-conscious consumers. Additionally, the market is benefitting from innovation in flavors and formats, with companies introducing new variants such as honey-infused, white chocolate, gluten-free, and seasonal offerings that appeal to diverse consumer preferences.
The peanut butter market holds a significant share in several parent markets. Within the nut and seed butter market, peanut butter dominates with approximately 60-65% share, being the most widely consumed and produced product. In the broader spreads market, it accounts for around 15-20%, competing with jams, honey, and other savory spreads.
Within the processed food market, peanut butter represents about 3-5%, reflecting its role as a packaged, shelf-stable product. In the health and wellness food segment, peanut butter holds roughly 8-10%, driven by its high protein and natural ingredient appeal. Lastly, in the plant-based protein market, peanut butter contributes around 5-7%, serving as a convenient and affordable source of plant protein amid growing demand for meat alternatives.
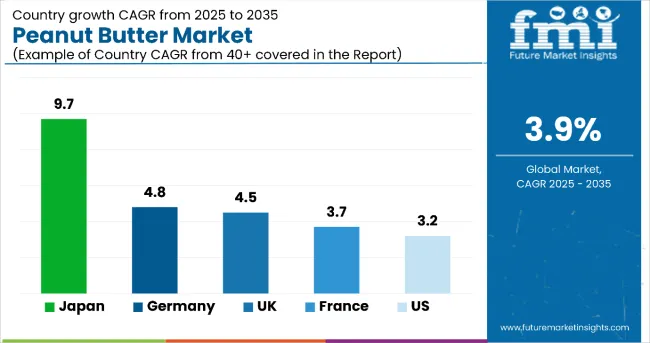
Japan is expected to be the fastest-growing market for peanut butter, with a projected CAGR of 9.7%. Smooth peanut butter holds the largest market share in the global peanut butter market, accounting for over 50% market share. The B2C (business-to-consumer) segment dominates the global peanut butter market, accounting for 61% of total market sales in 2025. The USA and the UK are also expected to experience notable growth, with projected CAGRs of 3.2% and 4.5%, respectively.
Peanut butter remains a staple spread with strong demand across North America and rising use in Asia, supported by large-scale peanut production and a structured supply chain.
Peanut butter’s production and trade are governed by food safety standards and quality grading, while its nutrient profile makes it both a dietary staple and a regulated commodity.
As of 2025, smooth peanut butter leads the global market with over 50% share due to its creamy texture, broad appeal, and versatility. The B2C segment accounts for 61% of sales, driven by household consumption, health trends, and growing retail and e-commerce presence.
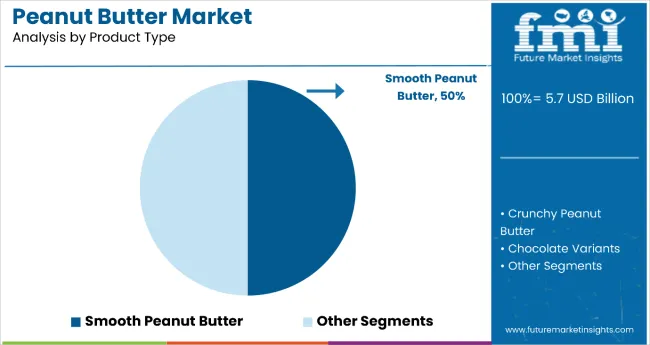
Smooth peanut butter holds the largest market share in the global peanut butter market, accounting for over 50% of total sales as of 2025. Its widespread popularity is attributed to its creamy texture, easy spread ability, and broad consumer appeal across all age groups.
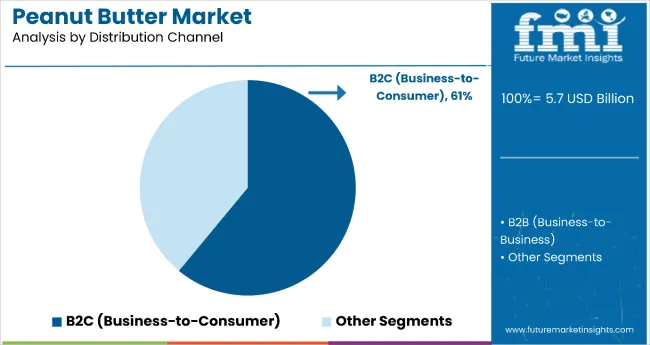
The B2C (business-to-consumer) segment dominates the global peanut butter market, accounting for 61% of total market sales in 2025. This segment's dominance is driven by the widespread consumption of peanut butter as a household staple, especially among health-conscious individuals, families, and younger demographics.
Demand Fueled by Healthy Food Eating
The market is witnessing a marked shift towards healthier and functional variants, including natural, organic, low-sodium, and high-protein options. Consumers increasingly prefer clean-label products free from artificial additives and preservatives, which has prompted manufacturers to innovate with fortifications such as added vitamins, minerals, and plant-based proteins.
Another prominent trend is premiumization, where artisanal and specialty product brands are gaining traction by offering unique flavors, sustainable packaging, and ethical sourcing. Additionally, the rise of e-commerce and omnichannel retail is transforming distribution, enhancing product accessibility, and enabling direct-to-consumer engagement, especially among younger, tech-savvy demographics.
Allergic Reactions May Pose Hurdles to Product Adoption
Despite positive momentum, the market faces some restraints that may limit growth. Allergies related to peanuts pose a significant barrier, prompting regulatory agencies to impose strict labeling and safety standards, which can increase compliance costs for manufacturers.
Price sensitivity, especially in emerging markets, affects consumer purchasing decisions, given the premium pricing of organic and specialty variants. Additionally, competition from alternative nut butters (such as almond, cashew, and sunflower) challenges peanut butter’s market share. Lastly, supply chain disruptions, fluctuations in raw material prices, and environmental concerns linked to peanut farming can impact production costs and availability, potentially restraining market expansion.
Rising Disposable Incomes to Augment Product Sales
Growing disposable income across emerging and developed markets is significantly boosting the market by enabling consumers to spend more on premium and specialty food products. As household incomes rise, there is increased demand for high-quality, nutritious, and convenient snack options, driving greater consumption of product varieties that offer added health benefits, unique flavors, and organic or natural ingredients.
Higher purchasing power also encourages consumers to explore innovative and indulgent products, such as flavored spreads and fortified formulations. Moreover, expanding middle-class populations in regions like Asia-Pacific and Latin America are increasingly adopting Western dietary habits, including peanut butter as a staple protein source and snack. This shift supports market growth by broadening the consumer base and increasing per capita consumption.
Volatility in Raw Peanut Prices May Hamper Uptake
The significant restraining factor for the market is the volatility in raw peanut prices due to fluctuating agricultural yields and adverse weather conditions. Unpredictable factors such as droughts, pests, and climate change impact peanut crop production, leading to supply shortages and increased costs for manufacturers.
This price instability can result in higher retail prices, which may discourage price-sensitive consumers and limit market growth, especially in developing regions. Additionally, supply chain disruptions and import-export restrictions can further exacerbate availability issues, making it challenging for companies to maintain consistent product supply and competitive pricing.
The market shows varied growth rates across these countries from 2025 to 2035. Japan leads with a significant CAGR of 9.7%, indicating a rapidly expanding market, likely driven by increasing consumer interest and product innovation. Germany follows with a strong growth rate of 4.8%, reflecting solid market potential.
The United Kingdom also shows robust growth at 4.5%, slightly behind Germany. France and the United States have more moderate growth rates of 3.7% and 3.2%, respectively, suggesting steady but slower market expansion. Japan stands out as the fastest-growing market, while the USA exhibits the slowest growth among these nations.
| Countries | CAGR 2025 to 2035(%) |
|---|---|
| United States | 3.2% |
| United Kingdom | 4.5% |
| France | 3.7% |
| Germany | 4.8% |
| Japan | 9.7% |
The United States peanut butter market is expected to grow at a steady CAGR of 3.2% between 2025 and 2035, underpinned by deeply entrenched consumer habits and a mature retail ecosystem. Consumers across demographics appreciate its affordability, nutritional profile, and versatility, fueling demand for both conventional and emerging varieties.
Leading players such as J.M. Smucker Company, Hormel Foods, and Conagra Brands maintain strong brand recognition and extensive distribution networks. The market is witnessing a pronounced shift toward health-centric variants with low-sodium, organic, and high-protein product, which cater to consumers embracing plant-based and clean-label diets. This has spurred innovations around added nutrients, reduced sugar content, and functional additives. Online retail growth and premiumization have further accelerated B2C expansion.
From a regulatory standpoint, the USA. Food and Drug Administration (FDA) enforces stringent standards on labeling, allergens, and nutritional content. This ensures transparency while driving reformulations toward healthier products. The consistent demand, favorable health trends, and supportive regulatory backdrop mean the USA market is projected to maintain stable long-term growth.
The United Kingdom peanut butter demand is projected to grow at a CAGR of 4.5% from 2025 to 2035, undergoing a robust transformation, driven by shifting consumer preferences toward healthier, plant-based food choices. With over one-third of UK consumers reducing meat intake and a growing segment adopting vegan lifestyles, product is increasingly viewed as a nutritious and versatile protein alternative. Brands such as Whole Earth, Meridian, and Pip & Nut have captured market share by positioning themselves around natural ingredients, low sugar content, and sustainable sourcing.
The market benefits from a strong omnichannel retail framework, with distribution through major grocery chains like Tesco and Sainsbury’s, as well as rapid growth in online grocery delivery. The UK's Food Standards Agency (FSA) plays a central role in maintaining safety and compliance, mandating clear allergen labeling and nutritional transparency, which reinforces consumer trust.
Product innovation, such as added superfoods, protein-enhanced formulas, and recyclable packaging continues to differentiate brands in a competitive landscape. These dynamics, coupled with increasing snack-based consumption patterns and growing demand in both urban and suburban households, position the UK for healthy expansion.
Sales of peanut butter in France are projected to grow at a CAGR of 3.7% from 2025 to 2035. France experiencing gradual but steady growth, with a cultural pivot away from traditional sweet spreads such as Nutella toward healthier alternatives. Historically, product has not been a pantry staple in French households; however, this is changing as urban consumers, especially Millennials and Gen Z seek protein-rich, plant-based foods aligned with global dietary trends.
The increasing popularity of international cuisines, particularly American and Asian-inspired dishes, is also contributing to product’s expanding role in French culinary routines. French consumers demonstrate a marked preference for organic, ethically sourced, and additive-free products, placing pressure on brands to deliver premium offerings. Product transparency is further enforced by ANSES (the French Agency for Food, Environmental and Occupational Health & Safety), which oversees food safety regulations, allergen declarations, and nutritional labelling.
While the market remains, niche compared to other Western countries, France's expanding health food sector, increased awareness of product's nutritional benefits, and growing vegan and flexitarian populations are fostering demand. The market outlook is cautiously optimistic, with innovation and premiumization being key growth levers.
Germany’s peanut butter market is projected to grow at a CAGR of 4.8% between 2025 and 2035, reflecting strong fundamentals and evolving consumer values. Germany is witnessing accelerated growth, fueled by a health-conscious consumer base and rising adoption of fitness-oriented diets.
Once considered a niche product, peanut butter has become mainstream, particularly among young professionals, athletes, and flexitarians. Demand is strongest for all-natural, high-protein, and low-sugar variants that align with Germany’s broader wellness and clean-eating trends. Functional product with added nutrients (e.g., omega-3s, plant-based protein) is gaining traction, driving innovation in the premium segment.
Germany’s highly organized retail ecosystem, anchored by major supermarket chains such as Edeka, Rewe, and Aldi, ensures widespread availability. Meanwhile, the growth of e-commerce and specialty organic food platforms is expanding access to premium and niche brands. Players such as MyProtein, Rapunzel, and food startups focusing on zero-waste packaging are carving out strong positions through differentiation on sustainability and transparency.
Japan’s peanut butter revenues are growing and are expected to grow at a CAGR of 9.7% between 2025 and 2035. This positions it as one of the fastest-growing markets globally, driven by the increasing westernization of dietary habits and a growing openness to international food trends.
Traditionally dominated by soy-based spreads and jam, the Japanese consumer landscape is now embracing product for its nutritional profile and culinary versatility. This shift is particularly evident among health-conscious millennials and Gen Z, who are incorporating product into breakfast routines, smoothies, and even traditional Japanese recipes for added protein.
Premiumization is a defining feature of the Japanese market. Consumers demonstrate a strong preference for high-quality, additive-free, and organic variants, often opting for glass-packaged, artisanal brands that align with minimalist and health-driven consumption values. Regulatory oversight by the Ministry of Health, Labour and Welfare ensures strict compliance with food safety, allergen labeling, and import standards.
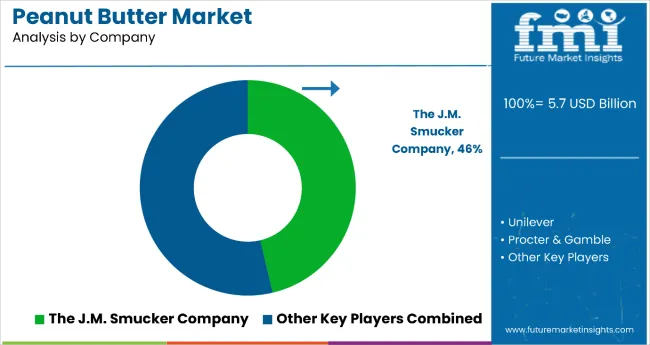
The global peanut butter market is moderately consolidated, with major players including Procter & Gamble, Unilever, The J.M. Smucker Company, Hormel Foods Corporation, Boulder Brands Inc., Kraft Canada Inc., Algood Food Company Inc., Kellogg Company, Conagra Brands, Inc., and Kraft Foods. These companies dominate the industry through strong brand recognition, wide distribution networks, and continuous product innovation tailored to evolving consumer preferences.
For example, The J.M. Smucker Company, known for its Jif® brand, leads the market with an extensive portfolio of peanut butter varieties, including low-sugar and natural options. Unilever and Kraft Foods leverage their global reach to market creamy and crunchy peanut butter variants across North America, Europe, and Asia. Hormel Foods, with its Skippy® brand, focuses on health-conscious products such as protein-enhanced spreads. Meanwhile, companies like Boulder Brands and Algood Food Company cater to niche segments with organic, gluten-free, and allergen-friendly formulations.
Kellogg and Conagra Brands also integrate peanut butter into their broader food product lines, enhancing brand synergy and market reach. These players remain competitive by investing in clean-label formulations, sustainable packaging, and expanding their presence in both traditional and digital retail channels.
Recent Peanut Butter Industry News
| Report Attributes | Details |
|---|---|
| Current Total Market Size (2025) | USD 5.68 billion |
| Projected Market Size (2035) | USD 8.33 billion |
| CAGR (2025 to 2035) | 3.9% |
| Base Year for Estimation | 2024 |
| Historical Period | 2020 to 2024 |
| Projections Period | 2025 to 2035 |
| Report Parameter | Revenue in USD billion/Volume in Kilo Tons |
| By Product Type | Smooth Peanut Butter, Crunchy Peanut Butter, Chocolate Peanut Butter |
| By Distribution Channel | B2B and B2C |
| Regions Covered | North America, Europe, Asia Pacific, Latin America, Middle East & Africa |
| Countries Covered | United States, Japan, Germany, India, United Kingdom, France, Italy, Brazil, Canada, South Korea, Australia, Spain, Netherlands, Saudi Arabia |
| Key Players | Procter & Gamble, Unilever, The J.M. Smucker Company, Hormel Foods Corporation, Boulder Brands Inc., Kraft Canada Inc., Algood Food Company Inc., Kellogg Company, Conagra Brands, Inc., Kraft Foods |
| Additional Attributes | Dollar sales by value, market share analysis by region, country-wise analysis. |
By product type, methods industry has been categorized into Smooth Peanut Butter, Crunchy Peanut Butter and Chocolate Peanut Butter
By distribution channel, industry has been categorized into B2B and B2C
Industry analysis has been carried out in key countries of North America; Europe, Middle East, Africa, ASEAN, South Asia, Asia, New Zealand and Australia
The market is expected to grow from USD 5.68 billion in 2025 to USD 8.33 billion by 2035, at a CAGR of 3.9%.
The crunchy peanut butter segment is slated to grow at 4.5% CAGR during the forecast period.
Top players include Procter & Gamble, Unilever, The J.M. Smucker Company, Hormel Foods Corporation, and Kraft Foods.
Growth is driven by rising demand for healthy, high-protein, plant-based foods, urbanization, expansion of e-commerce, and innovations in health-focused products.
Regulations focus on food safety, labeling transparency, and allergen management, encouraging manufacturers to adopt organic certifications, non-GMO sourcing, and sustainable packaging solutions.


Full Research Suite comprises of:
Market outlook & trends analysis
Interviews & case studies
Strategic recommendations
Vendor profiles & capabilities analysis
5-year forecasts
8 regions and 60+ country-level data splits
Market segment data splits
12 months of continuous data updates
DELIVERED AS:
PDF EXCEL ONLINE
Peanut Butter Keto Snacks Market Analysis - Trends & Growth 2025 to 2035
No-Fat Peanut Butter Market Trends - Consumer Demand & Growth 2025 to 2035
Peanut Milk Market Analysis - Size, Share & Forecast 2025 to 2035
Peanut Flour Market
Packaging Peanut Market Insights – Growth & Forecast 2024-2034
Loose-fill Peanuts Market Size and Share Forecast Outlook 2025 to 2035
Biodegradable Packing Peanuts Market
Butter Coffee Market Size and Share Forecast Outlook 2025 to 2035
Butter Market Insights - Dairy Industry Expansion & Consumer Trends 2025 to 2035
Buttermilk Powder Market Analysis by Product Type, Sale Channel, and Region Through 2035
Butterfly Valves Market Analysis by Type, Mechanism, Function, Applications, and Region through 2035
Butter Powder Market Growth – Applications & Demand 2025 to 2035
Butter Flavor Market Trends – Food & Beverage Innovation 2025 to 2035
Analysis and Growth Projections for Butter and Margarine Business
Competitive Breakdown of Buttermilk Powder Providers
Butter Concentrate Market
Nut Butters Market Insights - Premium Spreads & Consumer Trends 2025 to 2035
Dry Buttermilk Market
Shea Butter Market Analysis - Size, Share, & Forecast Outlook 2025 to 2035
Aloe Butter Market

Thank you!
You will receive an email from our Business Development Manager. Please be sure to check your SPAM/JUNK folder too.
Chat With
MaRIA