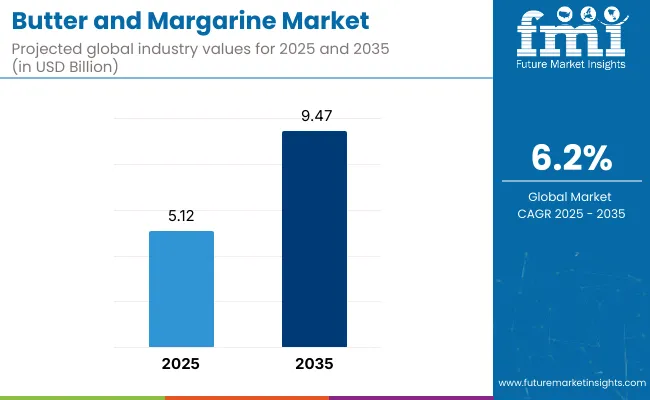
The demand for global Butter and Margarine market is expected to be valued at USD 5.12 Billion in 2025, forecasted at a CAGR of 6.2% to have an estimated value of USD 9.47 Billion from 2025 to 2035. From 2020 to 2025 a CAGR of 5.9% was registered for the market.
In baking cooking and table settings margarine-a spreadable butter-like substance-is frequently used in place of butter. Disperse. Usually vegetable oils like soybean palm or canola oil are used to make it these oils are hydrogenated to solidify them item. The process known as hydrogenation transforms the unsaturated fats in the oils into margarine saturated fats giving it a room temperature semi-solid consistency.
These vitamins are frequently added to margarine vitamins A and D in an attempt to replicate butters nutritional makeup. It comes in a variety of forms such as spreads sticks and tubs with choices including regular reduced-fat and non-hydrogenated types. Margarines versatility makes it valuable. cost-effectiveness and longer shelf life than butter.
A significant end-user of butter and margarine is the food industry. Butter and margarine are in high demand among food manufacturers due to their various uses in recipes.
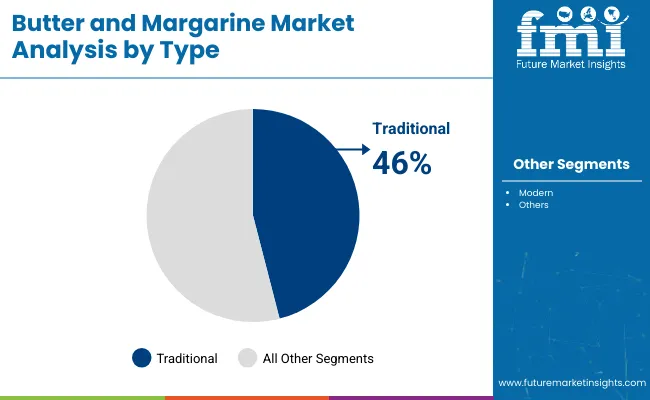
Segment | Value Share (2025) |
---|---|
Traditional (Type) | 46% |
By type, traditional segment dominates the market. It has a market share of 46%. It is expected to grow even further during the forecasted period.
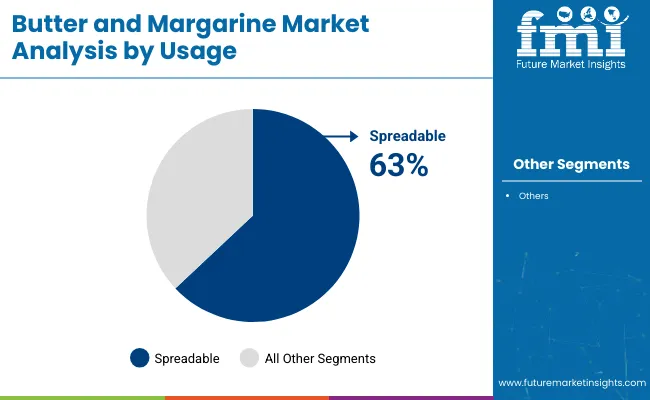
Segment | Value Share (2025) |
---|---|
Spreadable (Usage) | 63% |
Spreadable products versatility in the kitchen draws in a larger consumer base which boosts butter and margarine sales. The ease of use for quick meal preparation makes spreadable butter and margarine popular among consumers with hectic schedules. Customers are drawn in by the variety of flavors offered which boosts sales of butter and margarine.
Demand for Veganism is Driving the Market Growth
Due to plant-based diets and veganism are becoming more and more popular the margarine market is growing multiple nations. There is a demand for margarine especially that made with vegetable oils and other non-dairy ingredients growing as a result of this factor.
Margarine which works similarly to butter is becoming more and more popular and doesn’t contain any animal products in its production. Plant-based diets are preferred by many people due to ethical health and environmental reasons embracing margarine. People are drawn to vegan margarines that are free of lactose and cholesterol who are seeking dairy-free and plant-based options.
During the period 2020 to 2024, the sales grew at a CAGR of 5.9%, and it is predicted to continue to grow at a CAGR of 6.2% during the forecast period of 2025 to 2035.
The market for dairy spreads is positioned to benefit from the growing demand for organic food. Demand for organic products devoid of chemicals and preservatives is rising as consumers become more conscious of what they put into their bodies. As a result, butter and margarine are becoming more popular among health-conscious individuals.
Novel distribution channels for butter and margarine products have emerged with the rise of online shopping platforms. The producers of margarine and butter can reach and attract a larger audience. Sales of margarine and butter are boosted by this.
Tier 1 companies comprises industry leaders acquiring a 50% share in the global business market. These leaders are distinguished by their extensive product portfolio and high production capacity. These industry leaders stand out due to their broad geographic reach, in-depth knowledge of manufacturing and reconditioning across various formats and strong customer base. They offer a variety of services and manufacturing with the newest technology while adhering to legal requirements for the best quality.
Tier 2 companies comprises of mid-size players having a presence in some regions and highly influencing the local commerce and has a market share of 30%. These are distinguished by their robust global presence and solid business acumen. These industry participants may not have cutting-edge technology or a broad global reach but they do have good technology and guarantee regulatory compliance.
Tier 3 companies comprises mostly of small-scale businesses serving niche economies and serving at the local presence having a market share of 20%. Due to their notable focus on meeting local needs these businesses are categorized as belonging to the tier 3 share segment, they are minor players with a constrained geographic scope. As an unorganized ecosystem Tier 3 in this context refers to a sector that in contrast to its organized competitors, lacks extensive structure and formalization.
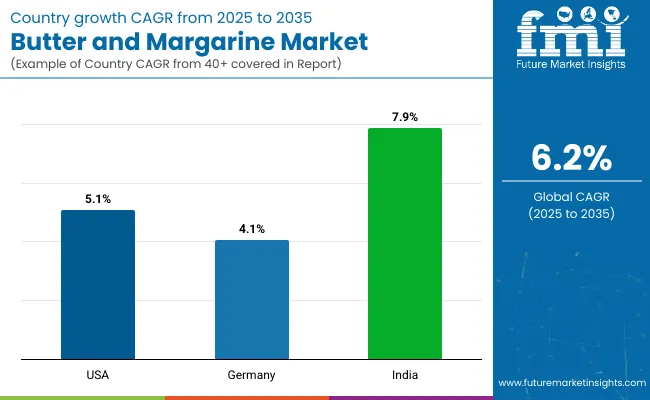
The following table shows the forecasted growth rates of the significant three geographies revenues. USA, Germany and India come under the exhibit of high consumption, recording CAGRs of 5.1%, 4.1% and 7.9%, respectively, through 2035.
Countries | CAGR 2025 to 2035 |
---|---|
United States | 5.1% |
Germany | 4.1% |
India | 7.9% |
Plant-based butter substitutes are becoming more and more popular in the USA as more people follow vegetarian diets and vegan lifestyles. Traditional supermarkets hypermarkets and internet retail channels have all taken an interest in butter and margarine sales in the USA.
The growing popularity of bakery goods in the Western style propels the expansion of the butter and margarine markets in India. The adoption of butter and margarine is positively impacted by Indian consumers preference for ghee and clarified butter. In India the middle classs increasing disposable income and urbanization are driving up demand for premium butter and margarine. The demand for butter and margarine in Indian states is driven by shifting regional tastes and changing lifestyles.
In the German dairy spreads market eco-friendly packaging and sustainability gained popularity. Health-conscious German consumers are driving the market for plant-based and fat substitutes in the butter and margarine industries. The German butter and margarine industries are thriving due to the widespread use of convenience foods.
In the highly competitive market a variety of butter and margarine producers aim for both market share and customer loyalty. Prominent producers of butter and margarine Arla Foods Farmers’ Cooperative Creamery and Dean Foods Company offer a range of goods to suit diverse consumer preferences.
The competition is still fierce and each producer offers a unique opportunity to the market for butter substitutes. Competing for a sizable portion of the market and expanding their worldwide presence are the butter and margarine suppliers. The producers of butter and margarine manage the opportunities and obstacles to maintain their market leadership as consumers become more health conscious.
By Type, methods industry has been categorized into traditional and modern
By product, industry has been categorized into spread and all purpose
Industry analysis has been carried out in key countries of North America; Europe, Middle East, Africa, ASEAN, South Asia, Asia, New Zealand and Australia
Table 1: Global Market Value (US$ Million) Forecast by Region, 2019 to 2034
Table 2: Global Market Volume (Tons) Forecast by Region, 2019 to 2034
Table 3: Global Market Value (US$ Million) Forecast by Type, 2019 to 2034
Table 4: Global Market Volume (Tons) Forecast by Type, 2019 to 2034
Table 5: Global Market Value (US$ Million) Forecast by Format, 2019 to 2034
Table 6: Global Market Volume (Tons) Forecast by Format, 2019 to 2034
Table 7: Global Market Value (US$ Million) Forecast by End User, 2019 to 2034
Table 8: Global Market Volume (Tons) Forecast by End User, 2019 to 2034
Table 9: Global Market Value (US$ Million) Forecast by Distribution Channel, 2019 to 2034
Table 10: Global Market Volume (Tons) Forecast by Distribution Channel, 2019 to 2034
Table 11: North America Market Value (US$ Million) Forecast by Country, 2019 to 2034
Table 12: North America Market Volume (Tons) Forecast by Country, 2019 to 2034
Table 13: North America Market Value (US$ Million) Forecast by Type, 2019 to 2034
Table 14: North America Market Volume (Tons) Forecast by Type, 2019 to 2034
Table 15: North America Market Value (US$ Million) Forecast by Format, 2019 to 2034
Table 16: North America Market Volume (Tons) Forecast by Format, 2019 to 2034
Table 17: North America Market Value (US$ Million) Forecast by End User, 2019 to 2034
Table 18: North America Market Volume (Tons) Forecast by End User, 2019 to 2034
Table 19: North America Market Value (US$ Million) Forecast by Distribution Channel, 2019 to 2034
Table 20: North America Market Volume (Tons) Forecast by Distribution Channel, 2019 to 2034
Table 21: Latin America Market Value (US$ Million) Forecast by Country, 2019 to 2034
Table 22: Latin America Market Volume (Tons) Forecast by Country, 2019 to 2034
Table 23: Latin America Market Value (US$ Million) Forecast by Type, 2019 to 2034
Table 24: Latin America Market Volume (Tons) Forecast by Type, 2019 to 2034
Table 25: Latin America Market Value (US$ Million) Forecast by Format, 2019 to 2034
Table 26: Latin America Market Volume (Tons) Forecast by Format, 2019 to 2034
Table 27: Latin America Market Value (US$ Million) Forecast by End User, 2019 to 2034
Table 28: Latin America Market Volume (Tons) Forecast by End User, 2019 to 2034
Table 29: Latin America Market Value (US$ Million) Forecast by Distribution Channel, 2019 to 2034
Table 30: Latin America Market Volume (Tons) Forecast by Distribution Channel, 2019 to 2034
Table 31: Western Europe Market Value (US$ Million) Forecast by Country, 2019 to 2034
Table 32: Western Europe Market Volume (Tons) Forecast by Country, 2019 to 2034
Table 33: Western Europe Market Value (US$ Million) Forecast by Type, 2019 to 2034
Table 34: Western Europe Market Volume (Tons) Forecast by Type, 2019 to 2034
Table 35: Western Europe Market Value (US$ Million) Forecast by Format, 2019 to 2034
Table 36: Western Europe Market Volume (Tons) Forecast by Format, 2019 to 2034
Table 37: Western Europe Market Value (US$ Million) Forecast by End User, 2019 to 2034
Table 38: Western Europe Market Volume (Tons) Forecast by End User, 2019 to 2034
Table 39: Western Europe Market Value (US$ Million) Forecast by Distribution Channel, 2019 to 2034
Table 40: Western Europe Market Volume (Tons) Forecast by Distribution Channel, 2019 to 2034
Table 41: Eastern Europe Market Value (US$ Million) Forecast by Country, 2019 to 2034
Table 42: Eastern Europe Market Volume (Tons) Forecast by Country, 2019 to 2034
Table 43: Eastern Europe Market Value (US$ Million) Forecast by Type, 2019 to 2034
Table 44: Eastern Europe Market Volume (Tons) Forecast by Type, 2019 to 2034
Table 45: Eastern Europe Market Value (US$ Million) Forecast by Format, 2019 to 2034
Table 46: Eastern Europe Market Volume (Tons) Forecast by Format, 2019 to 2034
Table 47: Eastern Europe Market Value (US$ Million) Forecast by End User, 2019 to 2034
Table 48: Eastern Europe Market Volume (Tons) Forecast by End User, 2019 to 2034
Table 49: Eastern Europe Market Value (US$ Million) Forecast by Distribution Channel, 2019 to 2034
Table 50: Eastern Europe Market Volume (Tons) Forecast by Distribution Channel, 2019 to 2034
Table 51: South Asia and Pacific Market Value (US$ Million) Forecast by Country, 2019 to 2034
Table 52: South Asia and Pacific Market Volume (Tons) Forecast by Country, 2019 to 2034
Table 53: South Asia and Pacific Market Value (US$ Million) Forecast by Type, 2019 to 2034
Table 54: South Asia and Pacific Market Volume (Tons) Forecast by Type, 2019 to 2034
Table 55: South Asia and Pacific Market Value (US$ Million) Forecast by Format, 2019 to 2034
Table 56: South Asia and Pacific Market Volume (Tons) Forecast by Format, 2019 to 2034
Table 57: South Asia and Pacific Market Value (US$ Million) Forecast by End User, 2019 to 2034
Table 58: South Asia and Pacific Market Volume (Tons) Forecast by End User, 2019 to 2034
Table 59: South Asia and Pacific Market Value (US$ Million) Forecast by Distribution Channel, 2019 to 2034
Table 60: South Asia and Pacific Market Volume (Tons) Forecast by Distribution Channel, 2019 to 2034
Table 61: East Asia Market Value (US$ Million) Forecast by Country, 2019 to 2034
Table 62: East Asia Market Volume (Tons) Forecast by Country, 2019 to 2034
Table 63: East Asia Market Value (US$ Million) Forecast by Type, 2019 to 2034
Table 64: East Asia Market Volume (Tons) Forecast by Type, 2019 to 2034
Table 65: East Asia Market Value (US$ Million) Forecast by Format, 2019 to 2034
Table 66: East Asia Market Volume (Tons) Forecast by Format, 2019 to 2034
Table 67: East Asia Market Value (US$ Million) Forecast by End User, 2019 to 2034
Table 68: East Asia Market Volume (Tons) Forecast by End User, 2019 to 2034
Table 69: East Asia Market Value (US$ Million) Forecast by Distribution Channel, 2019 to 2034
Table 70: East Asia Market Volume (Tons) Forecast by Distribution Channel, 2019 to 2034
Table 71: Middle East and Africa Market Value (US$ Million) Forecast by Country, 2019 to 2034
Table 72: Middle East and Africa Market Volume (Tons) Forecast by Country, 2019 to 2034
Table 73: Middle East and Africa Market Value (US$ Million) Forecast by Type, 2019 to 2034
Table 74: Middle East and Africa Market Volume (Tons) Forecast by Type, 2019 to 2034
Table 75: Middle East and Africa Market Value (US$ Million) Forecast by Format, 2019 to 2034
Table 76: Middle East and Africa Market Volume (Tons) Forecast by Format, 2019 to 2034
Table 77: Middle East and Africa Market Value (US$ Million) Forecast by End User, 2019 to 2034
Table 78: Middle East and Africa Market Volume (Tons) Forecast by End User, 2019 to 2034
Table 79: Middle East and Africa Market Value (US$ Million) Forecast by Distribution Channel, 2019 to 2034
Table 80: Middle East and Africa Market Volume (Tons) Forecast by Distribution Channel, 2019 to 2034
Figure 1: Global Market Value (US$ Million) by Type, 2024 to 2034
Figure 2: Global Market Value (US$ Million) by Format, 2024 to 2034
Figure 3: Global Market Value (US$ Million) by End User, 2024 to 2034
Figure 4: Global Market Value (US$ Million) by Distribution Channel, 2024 to 2034
Figure 5: Global Market Value (US$ Million) by Region, 2024 to 2034
Figure 6: Global Market Value (US$ Million) Analysis by Region, 2019 to 2034
Figure 7: Global Market Volume (Tons) Analysis by Region, 2019 to 2034
Figure 8: Global Market Value Share (%) and BPS Analysis by Region, 2024 to 2034
Figure 9: Global Market Y-o-Y Growth (%) Projections by Region, 2024 to 2034
Figure 10: Global Market Value (US$ Million) Analysis by Type, 2019 to 2034
Figure 11: Global Market Volume (Tons) Analysis by Type, 2019 to 2034
Figure 12: Global Market Value Share (%) and BPS Analysis by Type, 2024 to 2034
Figure 13: Global Market Y-o-Y Growth (%) Projections by Type, 2024 to 2034
Figure 14: Global Market Value (US$ Million) Analysis by Format, 2019 to 2034
Figure 15: Global Market Volume (Tons) Analysis by Format, 2019 to 2034
Figure 16: Global Market Value Share (%) and BPS Analysis by Format, 2024 to 2034
Figure 17: Global Market Y-o-Y Growth (%) Projections by Format, 2024 to 2034
Figure 18: Global Market Value (US$ Million) Analysis by End User, 2019 to 2034
Figure 19: Global Market Volume (Tons) Analysis by End User, 2019 to 2034
Figure 20: Global Market Value Share (%) and BPS Analysis by End User, 2024 to 2034
Figure 21: Global Market Y-o-Y Growth (%) Projections by End User, 2024 to 2034
Figure 22: Global Market Value (US$ Million) Analysis by Distribution Channel, 2019 to 2034
Figure 23: Global Market Volume (Tons) Analysis by Distribution Channel, 2019 to 2034
Figure 24: Global Market Value Share (%) and BPS Analysis by Distribution Channel, 2024 to 2034
Figure 25: Global Market Y-o-Y Growth (%) Projections by Distribution Channel, 2024 to 2034
Figure 26: Global Market Attractiveness by Type, 2024 to 2034
Figure 27: Global Market Attractiveness by Format, 2024 to 2034
Figure 28: Global Market Attractiveness by End User, 2024 to 2034
Figure 29: Global Market Attractiveness by Distribution Channel, 2024 to 2034
Figure 30: Global Market Attractiveness by Region, 2024 to 2034
Figure 31: North America Market Value (US$ Million) by Type, 2024 to 2034
Figure 32: North America Market Value (US$ Million) by Format, 2024 to 2034
Figure 33: North America Market Value (US$ Million) by End User, 2024 to 2034
Figure 34: North America Market Value (US$ Million) by Distribution Channel, 2024 to 2034
Figure 35: North America Market Value (US$ Million) by Country, 2024 to 2034
Figure 36: North America Market Value (US$ Million) Analysis by Country, 2019 to 2034
Figure 37: North America Market Volume (Tons) Analysis by Country, 2019 to 2034
Figure 38: North America Market Value Share (%) and BPS Analysis by Country, 2024 to 2034
Figure 39: North America Market Y-o-Y Growth (%) Projections by Country, 2024 to 2034
Figure 40: North America Market Value (US$ Million) Analysis by Type, 2019 to 2034
Figure 41: North America Market Volume (Tons) Analysis by Type, 2019 to 2034
Figure 42: North America Market Value Share (%) and BPS Analysis by Type, 2024 to 2034
Figure 43: North America Market Y-o-Y Growth (%) Projections by Type, 2024 to 2034
Figure 44: North America Market Value (US$ Million) Analysis by Format, 2019 to 2034
Figure 45: North America Market Volume (Tons) Analysis by Format, 2019 to 2034
Figure 46: North America Market Value Share (%) and BPS Analysis by Format, 2024 to 2034
Figure 47: North America Market Y-o-Y Growth (%) Projections by Format, 2024 to 2034
Figure 48: North America Market Value (US$ Million) Analysis by End User, 2019 to 2034
Figure 49: North America Market Volume (Tons) Analysis by End User, 2019 to 2034
Figure 50: North America Market Value Share (%) and BPS Analysis by End User, 2024 to 2034
Figure 51: North America Market Y-o-Y Growth (%) Projections by End User, 2024 to 2034
Figure 52: North America Market Value (US$ Million) Analysis by Distribution Channel, 2019 to 2034
Figure 53: North America Market Volume (Tons) Analysis by Distribution Channel, 2019 to 2034
Figure 54: North America Market Value Share (%) and BPS Analysis by Distribution Channel, 2024 to 2034
Figure 55: North America Market Y-o-Y Growth (%) Projections by Distribution Channel, 2024 to 2034
Figure 56: North America Market Attractiveness by Type, 2024 to 2034
Figure 57: North America Market Attractiveness by Format, 2024 to 2034
Figure 58: North America Market Attractiveness by End User, 2024 to 2034
Figure 59: North America Market Attractiveness by Distribution Channel, 2024 to 2034
Figure 60: North America Market Attractiveness by Country, 2024 to 2034
Figure 61: Latin America Market Value (US$ Million) by Type, 2024 to 2034
Figure 62: Latin America Market Value (US$ Million) by Format, 2024 to 2034
Figure 63: Latin America Market Value (US$ Million) by End User, 2024 to 2034
Figure 64: Latin America Market Value (US$ Million) by Distribution Channel, 2024 to 2034
Figure 65: Latin America Market Value (US$ Million) by Country, 2024 to 2034
Figure 66: Latin America Market Value (US$ Million) Analysis by Country, 2019 to 2034
Figure 67: Latin America Market Volume (Tons) Analysis by Country, 2019 to 2034
Figure 68: Latin America Market Value Share (%) and BPS Analysis by Country, 2024 to 2034
Figure 69: Latin America Market Y-o-Y Growth (%) Projections by Country, 2024 to 2034
Figure 70: Latin America Market Value (US$ Million) Analysis by Type, 2019 to 2034
Figure 71: Latin America Market Volume (Tons) Analysis by Type, 2019 to 2034
Figure 72: Latin America Market Value Share (%) and BPS Analysis by Type, 2024 to 2034
Figure 73: Latin America Market Y-o-Y Growth (%) Projections by Type, 2024 to 2034
Figure 74: Latin America Market Value (US$ Million) Analysis by Format, 2019 to 2034
Figure 75: Latin America Market Volume (Tons) Analysis by Format, 2019 to 2034
Figure 76: Latin America Market Value Share (%) and BPS Analysis by Format, 2024 to 2034
Figure 77: Latin America Market Y-o-Y Growth (%) Projections by Format, 2024 to 2034
Figure 78: Latin America Market Value (US$ Million) Analysis by End User, 2019 to 2034
Figure 79: Latin America Market Volume (Tons) Analysis by End User, 2019 to 2034
Figure 80: Latin America Market Value Share (%) and BPS Analysis by End User, 2024 to 2034
Figure 81: Latin America Market Y-o-Y Growth (%) Projections by End User, 2024 to 2034
Figure 82: Latin America Market Value (US$ Million) Analysis by Distribution Channel, 2019 to 2034
Figure 83: Latin America Market Volume (Tons) Analysis by Distribution Channel, 2019 to 2034
Figure 84: Latin America Market Value Share (%) and BPS Analysis by Distribution Channel, 2024 to 2034
Figure 85: Latin America Market Y-o-Y Growth (%) Projections by Distribution Channel, 2024 to 2034
Figure 86: Latin America Market Attractiveness by Type, 2024 to 2034
Figure 87: Latin America Market Attractiveness by Format, 2024 to 2034
Figure 88: Latin America Market Attractiveness by End User, 2024 to 2034
Figure 89: Latin America Market Attractiveness by Distribution Channel, 2024 to 2034
Figure 90: Latin America Market Attractiveness by Country, 2024 to 2034
Figure 91: Western Europe Market Value (US$ Million) by Type, 2024 to 2034
Figure 92: Western Europe Market Value (US$ Million) by Format, 2024 to 2034
Figure 93: Western Europe Market Value (US$ Million) by End User, 2024 to 2034
Figure 94: Western Europe Market Value (US$ Million) by Distribution Channel, 2024 to 2034
Figure 95: Western Europe Market Value (US$ Million) by Country, 2024 to 2034
Figure 96: Western Europe Market Value (US$ Million) Analysis by Country, 2019 to 2034
Figure 97: Western Europe Market Volume (Tons) Analysis by Country, 2019 to 2034
Figure 98: Western Europe Market Value Share (%) and BPS Analysis by Country, 2024 to 2034
Figure 99: Western Europe Market Y-o-Y Growth (%) Projections by Country, 2024 to 2034
Figure 100: Western Europe Market Value (US$ Million) Analysis by Type, 2019 to 2034
Figure 101: Western Europe Market Volume (Tons) Analysis by Type, 2019 to 2034
Figure 102: Western Europe Market Value Share (%) and BPS Analysis by Type, 2024 to 2034
Figure 103: Western Europe Market Y-o-Y Growth (%) Projections by Type, 2024 to 2034
Figure 104: Western Europe Market Value (US$ Million) Analysis by Format, 2019 to 2034
Figure 105: Western Europe Market Volume (Tons) Analysis by Format, 2019 to 2034
Figure 106: Western Europe Market Value Share (%) and BPS Analysis by Format, 2024 to 2034
Figure 107: Western Europe Market Y-o-Y Growth (%) Projections by Format, 2024 to 2034
Figure 108: Western Europe Market Value (US$ Million) Analysis by End User, 2019 to 2034
Figure 109: Western Europe Market Volume (Tons) Analysis by End User, 2019 to 2034
Figure 110: Western Europe Market Value Share (%) and BPS Analysis by End User, 2024 to 2034
Figure 111: Western Europe Market Y-o-Y Growth (%) Projections by End User, 2024 to 2034
Figure 112: Western Europe Market Value (US$ Million) Analysis by Distribution Channel, 2019 to 2034
Figure 113: Western Europe Market Volume (Tons) Analysis by Distribution Channel, 2019 to 2034
Figure 114: Western Europe Market Value Share (%) and BPS Analysis by Distribution Channel, 2024 to 2034
Figure 115: Western Europe Market Y-o-Y Growth (%) Projections by Distribution Channel, 2024 to 2034
Figure 116: Western Europe Market Attractiveness by Type, 2024 to 2034
Figure 117: Western Europe Market Attractiveness by Format, 2024 to 2034
Figure 118: Western Europe Market Attractiveness by End User, 2024 to 2034
Figure 119: Western Europe Market Attractiveness by Distribution Channel, 2024 to 2034
Figure 120: Western Europe Market Attractiveness by Country, 2024 to 2034
Figure 121: Eastern Europe Market Value (US$ Million) by Type, 2024 to 2034
Figure 122: Eastern Europe Market Value (US$ Million) by Format, 2024 to 2034
Figure 123: Eastern Europe Market Value (US$ Million) by End User, 2024 to 2034
Figure 124: Eastern Europe Market Value (US$ Million) by Distribution Channel, 2024 to 2034
Figure 125: Eastern Europe Market Value (US$ Million) by Country, 2024 to 2034
Figure 126: Eastern Europe Market Value (US$ Million) Analysis by Country, 2019 to 2034
Figure 127: Eastern Europe Market Volume (Tons) Analysis by Country, 2019 to 2034
Figure 128: Eastern Europe Market Value Share (%) and BPS Analysis by Country, 2024 to 2034
Figure 129: Eastern Europe Market Y-o-Y Growth (%) Projections by Country, 2024 to 2034
Figure 130: Eastern Europe Market Value (US$ Million) Analysis by Type, 2019 to 2034
Figure 131: Eastern Europe Market Volume (Tons) Analysis by Type, 2019 to 2034
Figure 132: Eastern Europe Market Value Share (%) and BPS Analysis by Type, 2024 to 2034
Figure 133: Eastern Europe Market Y-o-Y Growth (%) Projections by Type, 2024 to 2034
Figure 134: Eastern Europe Market Value (US$ Million) Analysis by Format, 2019 to 2034
Figure 135: Eastern Europe Market Volume (Tons) Analysis by Format, 2019 to 2034
Figure 136: Eastern Europe Market Value Share (%) and BPS Analysis by Format, 2024 to 2034
Figure 137: Eastern Europe Market Y-o-Y Growth (%) Projections by Format, 2024 to 2034
Figure 138: Eastern Europe Market Value (US$ Million) Analysis by End User, 2019 to 2034
Figure 139: Eastern Europe Market Volume (Tons) Analysis by End User, 2019 to 2034
Figure 140: Eastern Europe Market Value Share (%) and BPS Analysis by End User, 2024 to 2034
Figure 141: Eastern Europe Market Y-o-Y Growth (%) Projections by End User, 2024 to 2034
Figure 142: Eastern Europe Market Value (US$ Million) Analysis by Distribution Channel, 2019 to 2034
Figure 143: Eastern Europe Market Volume (Tons) Analysis by Distribution Channel, 2019 to 2034
Figure 144: Eastern Europe Market Value Share (%) and BPS Analysis by Distribution Channel, 2024 to 2034
Figure 145: Eastern Europe Market Y-o-Y Growth (%) Projections by Distribution Channel, 2024 to 2034
Figure 146: Eastern Europe Market Attractiveness by Type, 2024 to 2034
Figure 147: Eastern Europe Market Attractiveness by Format, 2024 to 2034
Figure 148: Eastern Europe Market Attractiveness by End User, 2024 to 2034
Figure 149: Eastern Europe Market Attractiveness by Distribution Channel, 2024 to 2034
Figure 150: Eastern Europe Market Attractiveness by Country, 2024 to 2034
Figure 151: South Asia and Pacific Market Value (US$ Million) by Type, 2024 to 2034
Figure 152: South Asia and Pacific Market Value (US$ Million) by Format, 2024 to 2034
Figure 153: South Asia and Pacific Market Value (US$ Million) by End User, 2024 to 2034
Figure 154: South Asia and Pacific Market Value (US$ Million) by Distribution Channel, 2024 to 2034
Figure 155: South Asia and Pacific Market Value (US$ Million) by Country, 2024 to 2034
Figure 156: South Asia and Pacific Market Value (US$ Million) Analysis by Country, 2019 to 2034
Figure 157: South Asia and Pacific Market Volume (Tons) Analysis by Country, 2019 to 2034
Figure 158: South Asia and Pacific Market Value Share (%) and BPS Analysis by Country, 2024 to 2034
Figure 159: South Asia and Pacific Market Y-o-Y Growth (%) Projections by Country, 2024 to 2034
Figure 160: South Asia and Pacific Market Value (US$ Million) Analysis by Type, 2019 to 2034
Figure 161: South Asia and Pacific Market Volume (Tons) Analysis by Type, 2019 to 2034
Figure 162: South Asia and Pacific Market Value Share (%) and BPS Analysis by Type, 2024 to 2034
Figure 163: South Asia and Pacific Market Y-o-Y Growth (%) Projections by Type, 2024 to 2034
Figure 164: South Asia and Pacific Market Value (US$ Million) Analysis by Format, 2019 to 2034
Figure 165: South Asia and Pacific Market Volume (Tons) Analysis by Format, 2019 to 2034
Figure 166: South Asia and Pacific Market Value Share (%) and BPS Analysis by Format, 2024 to 2034
Figure 167: South Asia and Pacific Market Y-o-Y Growth (%) Projections by Format, 2024 to 2034
Figure 168: South Asia and Pacific Market Value (US$ Million) Analysis by End User, 2019 to 2034
Figure 169: South Asia and Pacific Market Volume (Tons) Analysis by End User, 2019 to 2034
Figure 170: South Asia and Pacific Market Value Share (%) and BPS Analysis by End User, 2024 to 2034
Figure 171: South Asia and Pacific Market Y-o-Y Growth (%) Projections by End User, 2024 to 2034
Figure 172: South Asia and Pacific Market Value (US$ Million) Analysis by Distribution Channel, 2019 to 2034
Figure 173: South Asia and Pacific Market Volume (Tons) Analysis by Distribution Channel, 2019 to 2034
Figure 174: South Asia and Pacific Market Value Share (%) and BPS Analysis by Distribution Channel, 2024 to 2034
Figure 175: South Asia and Pacific Market Y-o-Y Growth (%) Projections by Distribution Channel, 2024 to 2034
Figure 176: South Asia and Pacific Market Attractiveness by Type, 2024 to 2034
Figure 177: South Asia and Pacific Market Attractiveness by Format, 2024 to 2034
Figure 178: South Asia and Pacific Market Attractiveness by End User, 2024 to 2034
Figure 179: South Asia and Pacific Market Attractiveness by Distribution Channel, 2024 to 2034
Figure 180: South Asia and Pacific Market Attractiveness by Country, 2024 to 2034
Figure 181: East Asia Market Value (US$ Million) by Type, 2024 to 2034
Figure 182: East Asia Market Value (US$ Million) by Format, 2024 to 2034
Figure 183: East Asia Market Value (US$ Million) by End User, 2024 to 2034
Figure 184: East Asia Market Value (US$ Million) by Distribution Channel, 2024 to 2034
Figure 185: East Asia Market Value (US$ Million) by Country, 2024 to 2034
Figure 186: East Asia Market Value (US$ Million) Analysis by Country, 2019 to 2034
Figure 187: East Asia Market Volume (Tons) Analysis by Country, 2019 to 2034
Figure 188: East Asia Market Value Share (%) and BPS Analysis by Country, 2024 to 2034
Figure 189: East Asia Market Y-o-Y Growth (%) Projections by Country, 2024 to 2034
Figure 190: East Asia Market Value (US$ Million) Analysis by Type, 2019 to 2034
Figure 191: East Asia Market Volume (Tons) Analysis by Type, 2019 to 2034
Figure 192: East Asia Market Value Share (%) and BPS Analysis by Type, 2024 to 2034
Figure 193: East Asia Market Y-o-Y Growth (%) Projections by Type, 2024 to 2034
Figure 194: East Asia Market Value (US$ Million) Analysis by Format, 2019 to 2034
Figure 195: East Asia Market Volume (Tons) Analysis by Format, 2019 to 2034
Figure 196: East Asia Market Value Share (%) and BPS Analysis by Format, 2024 to 2034
Figure 197: East Asia Market Y-o-Y Growth (%) Projections by Format, 2024 to 2034
Figure 198: East Asia Market Value (US$ Million) Analysis by End User, 2019 to 2034
Figure 199: East Asia Market Volume (Tons) Analysis by End User, 2019 to 2034
Figure 200: East Asia Market Value Share (%) and BPS Analysis by End User, 2024 to 2034
Figure 201: East Asia Market Y-o-Y Growth (%) Projections by End User, 2024 to 2034
Figure 202: East Asia Market Value (US$ Million) Analysis by Distribution Channel, 2019 to 2034
Figure 203: East Asia Market Volume (Tons) Analysis by Distribution Channel, 2019 to 2034
Figure 204: East Asia Market Value Share (%) and BPS Analysis by Distribution Channel, 2024 to 2034
Figure 205: East Asia Market Y-o-Y Growth (%) Projections by Distribution Channel, 2024 to 2034
Figure 206: East Asia Market Attractiveness by Type, 2024 to 2034
Figure 207: East Asia Market Attractiveness by Format, 2024 to 2034
Figure 208: East Asia Market Attractiveness by End User, 2024 to 2034
Figure 209: East Asia Market Attractiveness by Distribution Channel, 2024 to 2034
Figure 210: East Asia Market Attractiveness by Country, 2024 to 2034
Figure 211: Middle East and Africa Market Value (US$ Million) by Type, 2024 to 2034
Figure 212: Middle East and Africa Market Value (US$ Million) by Format, 2024 to 2034
Figure 213: Middle East and Africa Market Value (US$ Million) by End User, 2024 to 2034
Figure 214: Middle East and Africa Market Value (US$ Million) by Distribution Channel, 2024 to 2034
Figure 215: Middle East and Africa Market Value (US$ Million) by Country, 2024 to 2034
Figure 216: Middle East and Africa Market Value (US$ Million) Analysis by Country, 2019 to 2034
Figure 217: Middle East and Africa Market Volume (Tons) Analysis by Country, 2019 to 2034
Figure 218: Middle East and Africa Market Value Share (%) and BPS Analysis by Country, 2024 to 2034
Figure 219: Middle East and Africa Market Y-o-Y Growth (%) Projections by Country, 2024 to 2034
Figure 220: Middle East and Africa Market Value (US$ Million) Analysis by Type, 2019 to 2034
Figure 221: Middle East and Africa Market Volume (Tons) Analysis by Type, 2019 to 2034
Figure 222: Middle East and Africa Market Value Share (%) and BPS Analysis by Type, 2024 to 2034
Figure 223: Middle East and Africa Market Y-o-Y Growth (%) Projections by Type, 2024 to 2034
Figure 224: Middle East and Africa Market Value (US$ Million) Analysis by Format, 2019 to 2034
Figure 225: Middle East and Africa Market Volume (Tons) Analysis by Format, 2019 to 2034
Figure 226: Middle East and Africa Market Value Share (%) and BPS Analysis by Format, 2024 to 2034
Figure 227: Middle East and Africa Market Y-o-Y Growth (%) Projections by Format, 2024 to 2034
Figure 228: Middle East and Africa Market Value (US$ Million) Analysis by End User, 2019 to 2034
Figure 229: Middle East and Africa Market Volume (Tons) Analysis by End User, 2019 to 2034
Figure 230: Middle East and Africa Market Value Share (%) and BPS Analysis by End User, 2024 to 2034
Figure 231: Middle East and Africa Market Y-o-Y Growth (%) Projections by End User, 2024 to 2034
Figure 232: Middle East and Africa Market Value (US$ Million) Analysis by Distribution Channel, 2019 to 2034
Figure 233: Middle East and Africa Market Volume (Tons) Analysis by Distribution Channel, 2019 to 2034
Figure 234: Middle East and Africa Market Value Share (%) and BPS Analysis by Distribution Channel, 2024 to 2034
Figure 235: Middle East and Africa Market Y-o-Y Growth (%) Projections by Distribution Channel, 2024 to 2034
Figure 236: Middle East and Africa Market Attractiveness by Type, 2024 to 2034
Figure 237: Middle East and Africa Market Attractiveness by Format, 2024 to 2034
Figure 238: Middle East and Africa Market Attractiveness by End User, 2024 to 2034
Figure 239: Middle East and Africa Market Attractiveness by Distribution Channel, 2024 to 2034
Figure 240: Middle East and Africa Market Attractiveness by Country, 2024 to 2034
The market is expected to grow at a CAGR of 6.2% throughout the forecast period.
By 2035, the sales value is expected to be worth USD 9.47 Billion.
Demand for veganism is increasing demand for Powder Induction and Dispersion Systems.
North America is expected to dominate the global consumption.
Some of the key players in manufacturing include BRF, Groupo Lala, NamChow and more.
Explore Similar Insights
Thank you!
You will receive an email from our Business Development Manager. Please be sure to check your SPAM/JUNK folder too.