

- Market Size (2026)
- USD 2.9 Bn
- Forecast (2036)
- USD 4.1 Bn
- CAGR (2026 to 2036)
- 3.5%
Buttermilk Powder Market Size, Market Forecast and Outlook By FMI
Summary of the Buttermilk Powder Market
- Demand and Growth Drivers
- Demand is being reshaped by bakery and confectionery manufacturer procurement at scale, which leverages buttermilk powder for flavor contribution, browning, and emulsification functionality.
- The expansion of sports nutrition and infant formula applications is supporting premium positioning and reshaping specification priorities across procurement organizations.
- Market stability is managed against global dairy commodity cycles, which drive 15% to 30% annual price volatility due to production concentration in the EU, New Zealand, and the USA.
- Product and Segment View
- Conventional buttermilk powder dominates the product landscape with a 55.0% share, sustained by cost-performance positioning for bulk procurement where organic premiums are not justified.
- Bakery and confectionery applications capture 40.0% of the market, serving as the primary volume anchor for major food manufacturers.
- Geography and Competitive Outlook
- While the EU, New Zealand, and the USA dominate absolute production capacity, Asia-Pacific-led by China and Japan-is driving the highest consumption growth rates.
- The competitive landscape is highly concentrated, with the top three global players (Fonterra, FrieslandCampina, and Arla Foods) collectively holding over 45% of supply share.
- Analyst Opinion
- Analyst Name at FMI says, "The market is moving away from relying on volume driven by commodities and toward a strategy of premiumization, where manufacturers use specific protein content and amino acid profiles to get 30% to 50% higher prices in high-growth nutrition segments."
- Market evolution is defined by a move toward high-specification ingredients that are needed to buy specialized infant formula and sports nutrition.
- Bakery and candy makers' predictable volume demand is what drives key adoption. This gives suppliers the security they need to make long-term investments.
- To meet changing consumer expectations for openness and regional regulatory requirements, product innovation is moving toward organic and clean-label certifications.
- To lower the margin compression caused by structural dairy price changes, strategic growth is becoming more reliant on buying from multiple sources and integrating deep supply networks.
Key Takeaways, Market Size, and Forecast
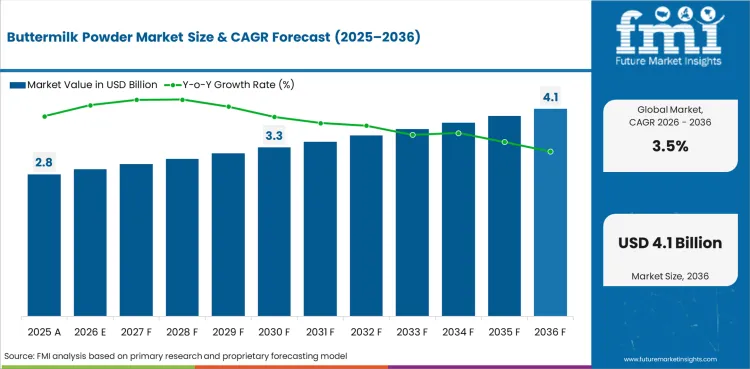
- The buttermilk powder market was valued at USD 2.8 billion in 2025.
- The market is set to reach USD 2.9 billion by 2026-end.
- The market is expected to grow at a CAGR of 3.5% between 2026–2036 to reach USD 4.1 billion by 2036.
- In 2026, the buttermilk powder market was valued at USD 2.89 billion.
- The market is projected to reach USD 4.07 billion by 2036.
- The industry is expected to expand at a CAGR of 3.5% from 2026 to 2036.
- Market participants are set to capture an incremental opportunity worth USD 1.19 billion over the forecast period.
- Conventional buttermilk powder leads the product segment with a 55.0% market share.
- Bakery and confectionery remains the leading application segment, capturing 40.0% of the market.
- Business-to-business distribution is the dominant channel, representing 70.0% of market volume.
- China and Japan are the fastest-growing markets, with projected CAGRs of 10.90% and 8.80%, respectively.
Buttermilk Powder Market Definition
The buttermilk powder market encompasses spray-dried buttermilk powder produced from liquid buttermilk, covering full cream, skimmed, and cultured buttermilk powder grades. Product scope includes commercial-grade powder sold to food manufacturers for bakery, confectionery, dairy processing, sports nutrition, and infant formula applications, plus specialty-grade powder for foodservice and retail.
Buttermilk Powder Market Inclusions
Market scope includes all commercially traded buttermilk powder covering the product, application, end-use, and distribution-channel segments detailed in Section 4, spanning the 2026 to 2036 forecast period across North America, Latin America, Europe, East Asia, South Asia and Pacific, and Middle East and Africa regions.
Buttermilk Powder Market Exclusions
The scope excludes liquid buttermilk sold for direct consumption, cultured buttermilk beverages in retail packaging, buttermilk-based salad dressings and finished products, and non-dairy buttermilk substitutes made from plant-based ingredients.
Buttermilk Powder Market Research Methodology
- Primary Research: FMI analysts talked to procurement leaders, technical experts, and commercial managers all along the buttermilk powder value chain in North America, Europe, and Asia-Pacific.
- Desk Research: To set verifiable baseline parameters, data collection combined statistics from industry associations, regulatory filings, company annual reports, and trade publications
- Market Sizing and Forecasting: We get baseline values by adding up transaction volumes from the bottom up and using growth rates and substitution curves for each region to predict demand through 2036.
- Data validation and update cycle:Projections are tested against industry sales data, regulatory disclosures, and manufacturer shipment statistics on a quarterly refresh schedule.
Why is the Buttermilk Powder Market Growing?
- About 40% of the world's demand for buttermilk powder comes from bakeries and candy makers. This means that annual volume growth in developed markets is expected to be between 3% and 5%.
- Sports nutrition and infant formula applications cost 30% to 50% more than bakery-grade buttermilk powder because they have more protein and amino acids.
- The global dairy commodity cycle causes prices to change by 15% to 30% each year. The EU's removal of quotas, New Zealand's Fonterra output, and the consolidation of US dairy farms all affect the supply.
Bakery and candy makers buy in bulk to get flavors, browning from the Maillard reaction, and emulsification functionality. This affects demand. General Mills, Nestle, Mondelez International, and Grupo Bimbo all get buttermilk powder for their biscuit, cake, pancake mix, and candy lines. This helps them predictably grow their sales by 3% to 5% each year in developed markets.
The fastest-growing premium sub-segments are sports nutrition and infant formula. The protein content and amino acid profile of buttermilk powder support the positioning of branded protein at Abbott Nutrition, Reckitt Benckiser Mead Johnson, and sports nutrition companies like Optimum Nutrition. Premium positioning costs 30% to 50% more than regular bakery-grade powder.
Cycles in the global dairy market cause structural margin volatility. Fonterra Co-operative Group, FrieslandCampina, and Arla Foods are the biggest suppliers in the world. The end of EU quotas in 2015 changed how production works. The price of goods traded around the world goes up and down by 15% to 30% every year because of New Zealand's spring production cycles, the consolidation of US dairy farms, and changes to the EU's Common Agricultural Policy.
Segmental Analysis
- In 2026, regular buttermilk powder will make up 55% of the market. Organic and specialty grades will be the fastest-growing sub-segments, thanks to the demand for clean-label formulations.
- Bakery and candy applications are the most common, making up 40% of all uses. Dairy processing and sports nutrition are the next most common uses.
- Business-to-business distribution has 70% of the channel share, which shows that food manufacturers are the most important buyers of bulk goods.
- There are different types of buttermilk powder, and they are sold in different ways, used for different things, and priced differently. Product segmentation separates conventional and organic grades. Applications include bakery and candy making, dairy processing, sports nutrition, baby formula, and specialty food service.
The buttermilk powder market is segmented by product, application, end use, distribution channel, formulation, and pricing tier. Product segmentation distinguishes conventional and organic grades. Applications span bakery and confectionery, dairy processing, sports nutrition, infant formula, and specialty foodservice usage.
Insights into the Conventional Buttermilk Powder Segment
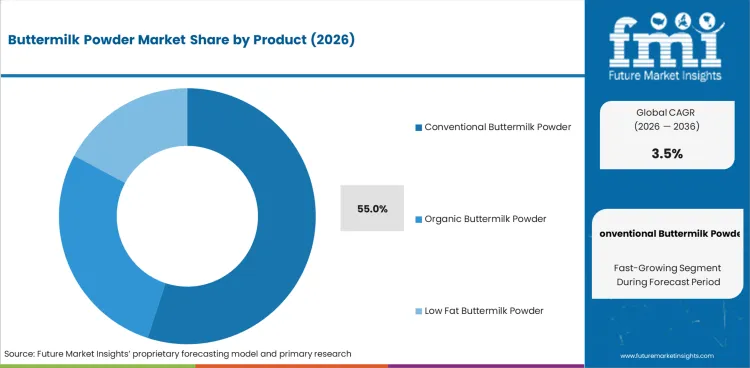
Conventional buttermilk powder is projected to lead the market with 55% of product share in 2026. This leadership reflects cost-performance positioning for food manufacturer bulk procurement in bakery, confectionery, and dairy processing applications where organic certification premiums are not justified.
Within conventional grades, food-manufacturer-spec buttermilk powder with defined moisture, protein, and fat profiles represents the dominant procurement category. Fonterra, FrieslandCampina, Arla Foods, and Lactalis supply scale food manufacturers including General Mills, Nestle, and Mondelez across bakery and confectionery applications.
Conventional buttermilk powder is expected to retain majority share through 2036. Organic-grade buttermilk powder represents the fastest-growing sub-segment at 8% to 12% annual growth, though absolute volumes remain subsidiary to conventional. Specialty cultured buttermilk powder adds premium sub-category positioning for artisan bakery and specialty foodservice applications.
Insights into the Bakery and Confectionery Applications Segment
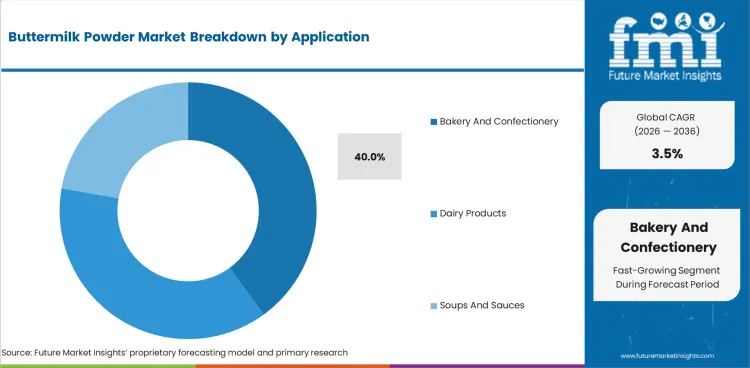
Bakery and confectionery applications are expected to capture 40% of the application segment in 2026. Biscuit, cake, pancake mix, and confectionery product lines represent the four largest sub-applications by volume.
Dairy processing applications including reconstituted cultured dairy products, dressings, and sauces represent the second-largest application category. Sports nutrition and infant formula together represent smaller but higher-premium sub-applications with 30% to 50% price premiums over bakery-grade procurement.
Buttermilk Powder Market Drivers, Restraints, and Opportunities
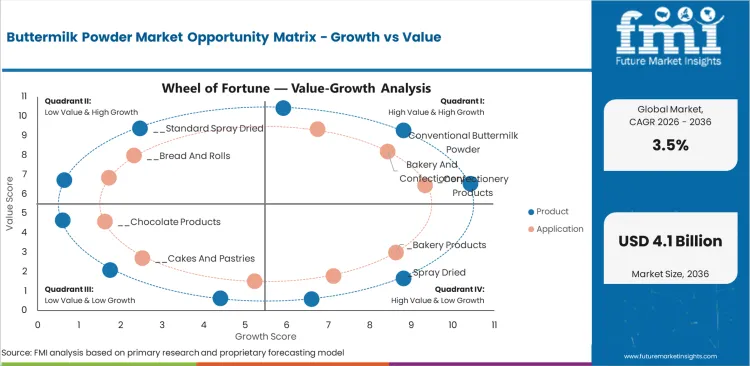
- Bakery and confectionery manufacturer procurement drives predictable 3% to 5% annual volume growth in developed markets.
- Sports nutrition and infant formula applications support 30% to 50% price premiums versus commodity bakery grades.
- Global dairy commodity cycles drive 15% to 30% annual price volatility and structural margin management challenges.
The buttermilk powder segment is shaped by bakery manufacturer demand, premium sports nutrition and infant formula applications, and global dairy commodity cycle dynamics. Constraints include dairy price volatility, competition from skim milk powder and whey protein alternatives, and EU and New Zealand production concentration creating supply geographic risk.
Bakery and Confectionery Manufacturer Procurement
Demand is shaped by General Mills, Nestle, Mondelez International, Grupo Bimbo, and regional bakery manufacturers procuring buttermilk powder at scale for flavor contribution, Maillard-reaction browning, and emulsification functionality. Biscuit, cake, pancake mix, and confectionery product lines support predictable 3% to 5% annual volume growth in developed markets. Fonterra, FrieslandCampina, and Lactalis supply scale manufacturer relationships.
Sports Nutrition and Infant Formula Premium Applications
Growth reflects sports nutrition and infant formula manufacturer demand for protein content and amino acid profile claims. Abbott Nutrition, Reckitt Benckiser Mead Johnson, and sports nutrition manufacturers source premium-grade buttermilk powder at 30% to 50% price premiums over bakery-grade. Specialty formulations command additional premium tiers for specific protein concentration and cultured flavor profiles.
Global Dairy Production Center Dynamics
Adoption is increasing due to global dairy trade dynamics with EU, New Zealand, and US production center concentration. Fonterra Co-operative Group leads New Zealand production with export focus. FrieslandCampina, Arla Foods, and Lactalis lead European production with both domestic and export positioning. Saputo and US dairy cooperatives lead North American production with primary focus on domestic food manufacturing demand.
Commodity Cycle Volatility and Substitution Competition
Growth is being shaped by 15% to 30% annual price volatility driven by global dairy commodity cycles. New Zealand spring production, EU production adjustments, and US dairy farm consolidation combine to affect supply stability. Food manufacturers face substitution decisions between buttermilk powder, skim milk powder, and whey protein concentrate based on relative pricing and functional performance across applications.
Analysis of Buttermilk Powder Market By Key Countries
.webp "Top Country Growth Comparison Buttermilk Powder Market Cagr (2026 2036)")
| Country | CAGR |
|---|---|
| China | 10.90% |
| Japan | 8.80% |
| United States | 6.20% |
| India | 5.40% |
| Brazil | 4.50% |
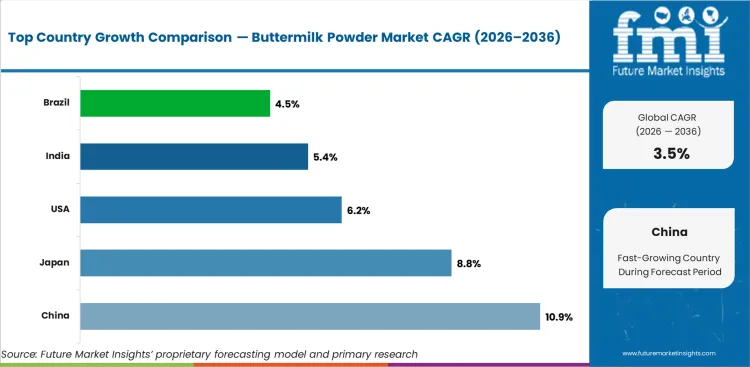
- The EU, New Zealand, and the US make the most absolute buttermilk powder, while Asia Pacific and Latin America have the fastest-growing markets for consumption.
- China is growing the fastest, with a CAGR of 10.9%. This is due to the growth of the infant formula category, the development of bakery manufacturers, and the import of high-quality dairy ingredients.
- Japan's economy is growing at a rate of 8.8% per year, thanks to demand from bakery and candy makers and imports of high-quality dairy ingredients.
- The USA and other mature markets grow at a rate of 6.2% per year, thanks to both domestic food manufacturing demand and export supply positioning.
The buttermilk powder market is projected to grow globally at a CAGR of 3.5% from 2026 to 2036. Among the top markets, China leads at 10.90%, Japan records 8.80%, United States records 6.20%, India records 5.40%, Brazil records 4.50%. The analysis spans over 30 countries, with the leading markets detailed below.
Demand Outlook for Buttermilk Powder Market in the United States
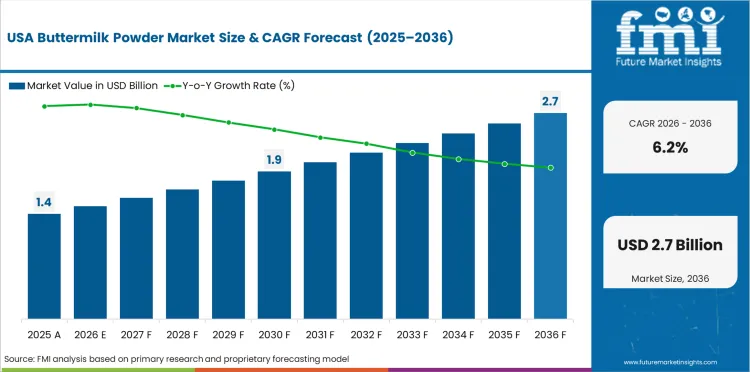
The United States is projected to grow at 6.2% CAGR through 2036, shaped by General Mills, Kellanova, and Grupo Bimbo bakery manufacturer procurement, Abbott Nutrition and sports nutrition manufacturer premium-grade demand, and Saputo and Dairy Farmers of America supply capacity. USDA voluntary origin labeling shapes domestic procurement preferences. Export supply to Mexico, Canada, and Asia Pacific remains a meaningful secondary demand driver.
- General Mills, Kellanova, and Grupo Bimbo drive bakery and confectionery procurement.
- Abbott Nutrition and sports nutrition manufacturers source premium-grade buttermilk powder.
- Saputo and Dairy Farmers of America lead domestic supply to both food manufacturing and export.
Future Outlook for Buttermilk Powder Market in the United Kingdom
The United Kingdom demonstrates steady growth through 2036, with demand shaped by Premier Foods, Associated British Foods, and Mondelez UK bakery manufacturer procurement, Arla UK and Muller UK supply capacity, and both domestic food manufacturing demand and Irish supply imports. Post-Brexit trade dynamics with EU suppliers continue to shape procurement patterns. Premium infant formula and sports nutrition applications support specialty category.
- Premier Foods, Associated British Foods, and Mondelez UK drive bakery procurement.
- Arla UK and Muller UK lead domestic supply alongside Irish imports.
- Post-Brexit trade dynamics shape EU supply procurement patterns.
Opportunity Analysis of Buttermilk Powder Market in Germany
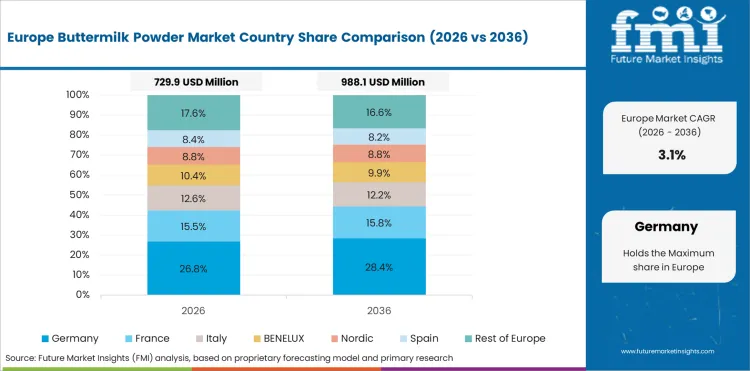
Germany demonstrates steady growth through 2036, propelled by DMK Deutsches Milchkontor, Muller Group, and Arla Foods amba Germany supply capacity, bakery manufacturer demand at scale, and both domestic and export positioning. Bio-Siegel organic certification drives premium category positioning. EU Common Agricultural Policy adjustments and dairy cooperative consolidation shape structural supply dynamics.
- DMK Deutsches Milchkontor and Muller Group lead domestic supply capacity.
- Bakery manufacturer demand at scale drives consistent bulk procurement volumes.
- EU Common Agricultural Policy adjustments shape structural supply dynamics.
In-depth Analysis of Buttermilk Powder Market in Japan
Japan is projected to grow at 8.8% CAGR through 2036, reflecting Morinaga Milk Industry, Meiji Dairies, and Snow Brand Milk Products infant formula and premium dairy procurement, Yamazaki Baking and bakery manufacturer demand, and premium imported buttermilk powder from New Zealand and Europe. Convenience store dairy product expansion supports retail category. Premium imported positioning from Fonterra and Arla Foods commands pricing premiums.
- Morinaga Milk Industry and Meiji Dairies drive infant formula and premium dairy procurement.
- Yamazaki Baking leads bakery manufacturer buttermilk powder procurement.
- Premium imports from Fonterra and Arla Foods command specialty category pricing.
Sales Analysis of Buttermilk Powder Market in China
China is projected to grow at 10.9% CAGR through 2036, propelled by infant formula category expansion, bakery manufacturer development, and premium dairy ingredient imports from New Zealand and Europe. Yili, Mengniu, and Feihe lead domestic infant formula and dairy processing procurement. Cross-border e-commerce at Tmall Global and JD Worldwide accelerates premium imported dairy ingredient reach.
- Yili, Mengniu, and Feihe lead domestic infant formula dairy ingredient procurement.
- Fonterra and Arla Foods lead premium imported buttermilk powder positioning.
- Tmall Global and JD Worldwide e-commerce drive premium imported dairy ingredient reach.
In-depth Analysis of Buttermilk Powder Market in India
India grows at 5.4% CAGR through 2036, supported by dairy processing sector expansion, bakery and confectionery manufacturer development, and growing middle-class packaged food consumption. Amul, Mother Dairy, and Nandini lead domestic dairy supply. Multinational bakery manufacturers including Britannia, Parle, and ITC drive procurement demand. FSSAI dairy labeling regulations shape domestic production specifications.
- Amul, Mother Dairy, and Nandini lead domestic dairy supply capacity.
- Britannia, Parle, and ITC drive bakery manufacturer procurement demand.
- FSSAI dairy labeling regulations shape domestic production specifications.
Competitive Landscape and Strategic Positioning
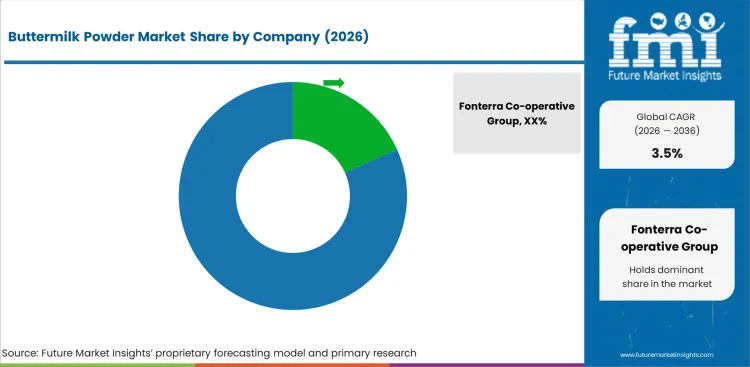
- Fonterra Co-operative Group, FrieslandCampina, and Arla Foods collectively hold over 45% of global buttermilk powder supply share, built on scale production capacity, dairy cooperative membership, and global trade networks.
- Regional specialists including Lactalis Group (France, Global), Saputo (Canada, USA), and Murray Goulburn-adjacent brands (Australia) hold meaningful positions in respective geographies.
- Private-label and retailer-owned brands at Costco Kirkland and Walmart Great Value collectively hold retail category share, though commercial food manufacturer procurement dominates overall volume.
The buttermilk powder market is shaped by global dairy cooperative producers and regional dairy processing companies. Fonterra Co-operative Group leads global supply share through New Zealand production scale, export orientation, and strong Asian market positioning.
FrieslandCampina holds meaningful European branded and commercial share through Dutch cooperative production base and global export positioning. Arla Foods operates European cooperative production with strong UK, German, Nordic, and Middle East export presence.
Lactalis Group holds global dairy ingredient share with strong European production base and international expansion through acquisitions. Saputo Inc. holds North American and Australian production capacity serving both domestic and export demand.
Barriers to entry include dairy farm cooperative membership or long-term supply contracts, spray-drying production capacity investment of USD 50 to USD 200 million per facility, food safety and quality certification requirements, and established food manufacturer relationships. Strategic priorities include organic certification expansion, sports nutrition and infant formula premium positioning growth, and emerging market export network development.
Major Industry Players
Key global companies leading the buttermilk powder market include:
- Fonterra Co-operative Group (New Zealand), FrieslandCampina (Netherlands), Arla Foods (Denmark/Sweden), and Lactalis Group (France) were identified as some of the star players in the buttermilk powder market, given their global production capacity, cooperative or integrated production models, and product portfolios spanning conventional, organic, and specialty buttermilk powder formulations.
- Saputo Inc. (Canada/USA), Dairy Farmers of America (USA), and DMK Deutsches Milchkontor (Germany) have established strong regional positions by leveraging scale production capacity, dairy cooperative membership networks, and strong domestic food manufacturer relationships across North American and European markets.
- Glanbia (Ireland), Murray Goulburn adjacent brands (Australia), and Muller Group (Germany), among others, have distinguished themselves by securing strong footholds in specialty and export-oriented dairy ingredient supply with premium positioning supporting their expansion into sports nutrition, infant formula, and specialty bakery applications.
Competitive Benchmarking: Buttermilk Powder Market
| Company | Production Capacity | Cooperative Supply Base | Premium Portfolio | Geographic Footprint |
|---|---|---|---|---|
| Fonterra Co-operative Group | High | High | High | Global |
| FrieslandCampina | High | High | High | Global |
| Arla Foods | High | High | Medium | Global |
| Lactalis Group | High | Medium | High | Global |
| Saputo Inc. | High | Medium | Medium | North America, Australia |
| Dairy Farmers of America | High | High | Medium | North America |
| DMK Deutsches Milchkontor | Medium | High | Medium | Germany, Europe |
| Glanbia | Medium | Medium | High | Ireland, Global |
| Murray Goulburn adjacent | Medium | High | Medium | Australia |
| Muller Group | Medium | Low | Medium | Germany, UK, Europe |
Source: Future Market Insights competitive analysis, 2026.
Key Developments in Buttermilk Powder Market
- In 2025, Fonterra Co‑operative Group expanded high‑value milk‑fat and dairy‑ingredients capacity in New Zealand, including plants handling buttermilk powder, to better serve Asian‑market infant‑formula and food‑ingredient customers seeking premium dairy bases.
- In 2025, Arla Foods Ingredients broadened its organic and functional dairy‑ingredient portfolio, including buttermilk‑derived products, to support European‑origin bakery and early‑life‑nutrition customers pursuing clean‑label and organic‑positioned ingredient sourcing.
Key Players in the Buttermilk Powder Market:
Major Global Players:
- Fonterra Co-operative Group
- FrieslandCampina
- Arla Foods
- Lactalis Group
- Saputo Inc.
- Dairy Farmers of America
- DMK Deutsches Milchkontor
Emerging Players/Startups
- Glanbia
- Murray Goulburn adjacent
- Muller Group
Scope of the report
| Metric | Value |
|---|---|
| Quantitative Units | USD 2.89 billion to USD 4.07 billion, at a CAGR of 3.5% |
| Market Definition | The buttermilk powder market encompasses spray-dried buttermilk powder produced from liquid buttermilk, covering full cream, skimmed, and cultured buttermilk powder grades. Product scope includes commercial-grade powder sold to food manufacturers for bakery, confectionery, dairy processing, sports nutrition, and infant formula applications, plus specialty-grade powder for foodservice and retail. |
| Regions Covered | North America, Latin America, Europe, East Asia, South Asia and Pacific, Middle East and Africa |
| Countries Covered | India, China, USA, UK, Germany, Japan, South Korea, Brazil, 30 plus countries |
| Key Companies Profiled | Fonterra Co-operative Group, FrieslandCampina, Arla Foods, Lactalis Group, Saputo Inc., Dairy Farmers of America, DMK Deutsches Milchkontor, Glanbia, Murray Goulburn adjacent, Muller Group |
| Forecast Period | 2026 to 2036 |
| Approach | Hybrid bottom-up and top-down methodology starting with verified buttermilk powder transaction data, projecting adoption velocity across segments and regions. |
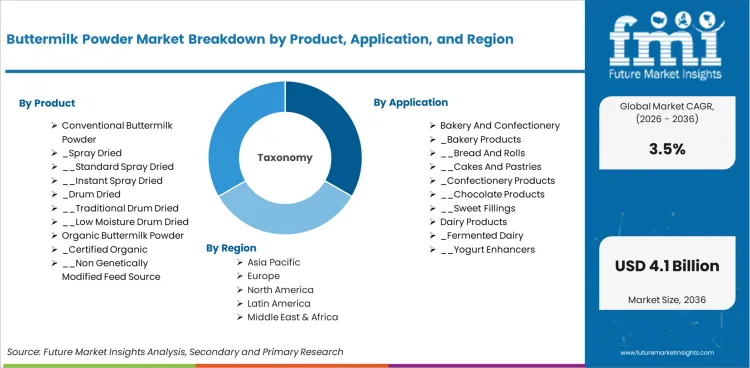
Market Segmentation Analysis
Buttermilk Powder Market Market Segmented by Product:
- Conventional Buttermilk Powder
- Spray Dried
- Standard Spray Dried
- Instant Spray Dried
- Drum Dried
- Traditional Drum Dried
- Low Moisture Drum Dried
- Spray Dried
- Organic Buttermilk Powder
- Certified Organic
- Non Genetically Modified Feed Source
- Clean Label Processing
- Certified Organic
- Low Fat Buttermilk Powder
- Reduced Fat Variants
- Skim Based Powder
- Low Calorie Formulations
- Reduced Fat Variants
- High Protein Buttermilk Powder
- Protein Enriched
- Dairy Protein Fortified
- Functional Nutrition Grade
- Protein Enriched
Buttermilk Powder Market Market Segmented by Application:
- Bakery And Confectionery
- Bakery Products
- Bread And Rolls
- Cakes And Pastries
- Confectionery Products
- Chocolate Products
- Sweet Fillings
- Bakery Products
- Dairy Products
- Fermented Dairy
- Yogurt Enhancers
- Cheese Processing
- Fermented Dairy
- Soups And Sauces
- Ready To Cook Mixes
- Instant Soups
- Sauce Bases
- Ready To Cook Mixes
- Beverages
- Functional Drinks
- Protein Drinks
- Nutrition Beverages
- Functional Drinks
Buttermilk Powder Market Market Segmented by End Use:
- Food Industry
- Industrial Food Manufacturers
- Large Scale Producers
- Contract Manufacturers
- Bakery Manufacturers
- Artisanal Bakeries
- Commercial Bakeries
- Industrial Food Manufacturers
- Food Service Industry
- Hotels And Restaurants
- Quick Service Restaurants
- Full Service Restaurants
- Hotels And Restaurants
- Retail Consumers
- Household Use
- Home Baking
- Cooking Applications
- Household Use
Buttermilk Powder Market Market Segmented by Distribution Channel:
- Business To Business
- Direct Sales
- Manufacturers To Industry
- Bulk Supply Contracts
- Food Ingredient Distributors
- Regional Distributors
- National Distributors
- Direct Sales
- Business To Consumer
- Supermarkets And Hypermarkets
- Retail Chains
- Bulk Food Stores
- Online Retail
- E Commerce Platforms
- Brand Owned Stores
- Supermarkets And Hypermarkets
Buttermilk Powder Market Market Segmented by Formulation:
- Full Cream Buttermilk Powder
- Standard Dairy Formulation
- High Fat Content
- Cream Based Variants
- Standard Dairy Formulation
- Skimmed Buttermilk Powder
- Low Fat Formulation
- Reduced Fat Dairy Base
- Functional Low Fat Grade
- Low Fat Formulation
- Fortified Buttermilk Powder
- Vitamin Fortified
- Calcium Enriched
- Protein Enriched
- Vitamin Fortified
- Flavored Buttermilk Powder
- Masala Flavored
- Spiced Variants
- Regional Taste Variants
- Masala Flavored
Buttermilk Powder Market Market Segmented by Pricing Tier:
- Mid Range
- Branded Dairy Ingredients
- Standard Quality Products
- Branded Dairy Ingredients
- Economy
- Bulk Commodity Products
- Private Label Supply
- Bulk Commodity Products
- Premium
- Organic And Specialty Products
- Clean Label Certified
- Export Grade Products
- Organic And Specialty Products
Buttermilk Powder Market Market by Region:
- North America
- USA
- Canada
- Mexico
- Latin America
- Brazil
- Chile
- Rest of Latin America
- Western Europe
- Germany
- UK
- Italy
- Spain
- France
- Nordic
- BENELUX
- Rest of Western Europe
- Eastern Europe
- Russia
- Poland
- Hungary
- Balkan & Baltic
- Rest of Eastern Europe
- East Asia
- China
- Japan
- South Korea
- South Asia and Pacific
- India
- ASEAN
- Australia & New Zealand
- Rest of South Asia and Pacific
- Middle East & Africa
- Kingdom of Saudi Arabia
- Other GCC Countries
- Turkiye
- South Africa
- Other African Union
- Rest of Middle East & Africa
Bibliography
- 1. Food and Agriculture Organization. (2025). FAO Dairy Market Review and Trade Statistics. FAO.
- 2. USA Department of Agriculture. (2024). USDA Dairy Products Production Statistics. USDA.
- 3. European Commission. (2025). EU Common Agricultural Policy Dairy Sector Report. European Commission.
- 4. International Dairy Federation. (2024). IDF World Dairy Situation Report. IDF.
- 5. Food Safety and Standards Authority of India. (2025). FSSAI Dairy Product Labeling Regulations. FSSAI.
This bibliography is provided for reader reference.
This Report Addresses
- Market sizing and revenue forecasting for buttermilk powder products from 2026 to 2036.
- Segmentation analysis across all product, application, end-use, and distribution-channel axes covered in Section 4.
- Regional and country-level insights covering over 30 markets with comparative growth analysis.
- Regulatory analysis covering the key frameworks shaping product specifications and procurement priorities in major markets.
- Competitive landscape assessment covering market structure, vendor positioning, and recent developments.
- Investment opportunity mapping across supplier, brand-owner, and channel verticals.
- Supply chain tracking from raw material sourcing to finished product distribution.
- Data delivery in PDF and Excel formats with quarterly refresh access.
Frequently Asked Questions
How large is the demand for Buttermilk Powder Market in the global market in 2026?
Demand for buttermilk powder market in the global market is estimated to be valued at USD 2.89 billion in 2026.
What will be the market size of Buttermilk Powder Market by 2036?
Market size for buttermilk powder market is projected to reach USD 4.07 billion by 2036.
What is the expected demand growth for Buttermilk Powder Market between 2026 and 2036?
Demand for buttermilk powder market is expected to grow at a CAGR of 3.5% between 2026 and 2036.
Which Product is poised to lead global sales by 2026?
Conventional Buttermilk Powder accounts for 55.0% in 2026, reflecting established manufacturing infrastructure and proven performance advantages.
How is Business To Business driving Buttermilk Powder Market adoption?
Business To Business represents 70.0% of distribution channel demand as dominant operators and procurement organizations drive volume.
What is driving demand in the top-growth country?
China registers a 10.90% CAGR through 2036, propelled by policy mandates, category adoption, and procurement-scale investment.
What does Buttermilk Powder Market definition mean in this report?
The buttermilk powder market ilk powder market encompasses spray-dried buttermilk powder produced from liquid buttermilk, covering full cream, skimmed, and cultured buttermilk powder grades. Product scope includes commercial-grade powder sold to food manufacturers for bakery, confectionery, dairy processing, sports nutrition, and infant formula applications, plus specialty-grade powder for foodservice and retail.
How does FMI build and validate the Buttermilk Powder Market forecast?
Forecasting models apply a hybrid bottom-up methodology starting with verified transaction data, cross-validated against industry sales statistics and manufacturer financial disclosures.
Preview the report firsthand - request a free sample
Get SampleGet the brochure for pricing and purchase details.
Get PDFTable of Content
- Executive Summary
- Global Market Outlook
- Demand-side Trends
- Supply-side Trends
- Technology Roadmap Analysis
- Analysis and Recommendations
- Market Overview
- Market Coverage / Taxonomy
- Market Definition / Scope / Limitations
- Research Methodology
- Chapter Orientation
- Analytical Lens and Working Hypotheses
- Market Structure, Signals, and Trend Drivers
- Benchmarking and Cross-market Comparability
- Market Sizing, Forecasting, and Opportunity Mapping
- Research Design and Evidence Framework
- Desk Research Programme (Secondary Evidence)
- Company Annual and Sustainability Reports
- Peer-reviewed Journals and Academic Literature
- Corporate Websites, Product Literature, and Technical Notes
- Earnings Decks and Investor Briefings
- Statutory Filings and Regulatory Disclosures
- Technical White Papers and Standards Notes
- Trade Journals, Industry Magazines, and Analyst Briefs
- Conference Proceedings, Webinars, and Seminar Materials
- Government Statistics Portals and Public Data Releases
- Press Releases and Reputable Media Coverage
- Specialist Newsletters and Curated Briefings
- Sector Databases and Reference Repositories
- FMI Internal Proprietary Databases and Historical Market Datasets
- Subscription Datasets and Paid Sources
- Social Channels, Communities, and Digital Listening Inputs
- Additional Desk Sources
- Expert Input and Fieldwork (Primary Evidence)
- Primary Modes
- Qualitative Interviews and Expert Elicitation
- Quantitative Surveys and Structured Data Capture
- Blended Approach
- Why Primary Evidence is Used
- Field Techniques
- Interviews
- Surveys
- Focus Groups
- Observational and In-context Research
- Social and Community Interactions
- Stakeholder Universe Engaged
- C-suite Leaders
- Board Members
- Presidents and Vice Presidents
- R&D and Innovation Heads
- Technical Specialists
- Domain Subject-matter Experts
- Scientists
- Physicians and Other Healthcare Professionals
- Governance, Ethics, and Data Stewardship
- Research Ethics
- Data Integrity and Handling
- Primary Modes
- Tooling, Models, and Reference Databases
- Desk Research Programme (Secondary Evidence)
- Data Engineering and Model Build
- Data Acquisition and Ingestion
- Cleaning, Normalisation, and Verification
- Synthesis, Triangulation, and Analysis
- Quality Assurance and Audit Trail
- Market Background
- Market Dynamics
- Drivers
- Restraints
- Opportunity
- Trends
- Scenario Forecast
- Demand in Optimistic Scenario
- Demand in Likely Scenario
- Demand in Conservative Scenario
- Opportunity Map Analysis
- Product Life Cycle Analysis
- Supply Chain Analysis
- Investment Feasibility Matrix
- Value Chain Analysis
- PESTLE and Porter’s Analysis
- Regulatory Landscape
- Regional Parent Market Outlook
- Production and Consumption Statistics
- Import and Export Statistics
- Market Dynamics
- Global Market Analysis 2021 to 2025 and Forecast, 2026 to 2036
- Historical Market Size Value (USD Million) Analysis, 2021 to 2025
- Current and Future Market Size Value (USD Million) Projections, 2026 to 2036
- Y-o-Y Growth Trend Analysis
- Absolute $ Opportunity Analysis
- Global Market Pricing Analysis 2021 to 2025 and Forecast 2026 to 2036
- Global Market Analysis 2021 to 2025 and Forecast 2026 to 2036, By Product
- Introduction / Key Findings
- Historical Market Size Value (USD Million) Analysis By Product , 2021 to 2025
- Current and Future Market Size Value (USD Million) Analysis and Forecast By Product , 2026 to 2036
- Conventional Buttermilk Powder
- Spray Dried
- Standard Spray Dried
- Instant Spray Dried
- Drum Dried
- Traditional Drum Dried
- Low Moisture Drum Dried
- Organic Buttermilk Powder
- Certified Organic
- Non Genetically Modified Feed Source
- Clean Label Processing
- Low Fat Buttermilk Powder
- Reduced Fat Variants
- Skim Based Powder
- Low Calorie Formulations
- High Protein Buttermilk Powder
- Protein Enriched
- Dairy Protein Fortified
- Functional Nutrition Grade
- Conventional Buttermilk Powder
- Y-o-Y Growth Trend Analysis By Product , 2021 to 2025
- Absolute $ Opportunity Analysis By Product , 2026 to 2036
- Global Market Analysis 2021 to 2025 and Forecast 2026 to 2036, By Application
- Introduction / Key Findings
- Historical Market Size Value (USD Million) Analysis By Application, 2021 to 2025
- Current and Future Market Size Value (USD Million) Analysis and Forecast By Application, 2026 to 2036
- Bakery And Confectionery
- Bakery Products
- Bread And Rolls
- Cakes And Pastries
- Confectionery Products
- Chocolate Products
- Sweet Fillings
- Dairy Products
- Fermented Dairy
- Yogurt Enhancers
- Cheese Processing
- Soups And Sauces
- Ready To Cook Mixes
- Instant Soups
- Sauce Bases
- Beverages
- Functional Drinks
- Protein Drinks
- Nutrition Beverages
- Bakery And Confectionery
- Y-o-Y Growth Trend Analysis By Application, 2021 to 2025
- Absolute $ Opportunity Analysis By Application, 2026 to 2036
- Global Market Analysis 2021 to 2025 and Forecast 2026 to 2036, By End Use
- Introduction / Key Findings
- Historical Market Size Value (USD Million) Analysis By End Use, 2021 to 2025
- Current and Future Market Size Value (USD Million) Analysis and Forecast By End Use, 2026 to 2036
- Food Industry
- Industrial Food Manufacturers
- Large Scale Producers
- Contract Manufacturers
- Bakery Manufacturers
- Artisanal Bakeries
- Commercial Bakeries
- Food Service Industry
- Hotels And Restaurants
- Quick Service Restaurants
- Full Service Restaurants
- Retail Consumers
- Household Use
- Home Baking
- Cooking Applications
- Food Industry
- Y-o-Y Growth Trend Analysis By End Use, 2021 to 2025
- Absolute $ Opportunity Analysis By End Use, 2026 to 2036
- Global Market Analysis 2021 to 2025 and Forecast 2026 to 2036, By Distribution Channel
- Introduction / Key Findings
- Historical Market Size Value (USD Million) Analysis By Distribution Channel, 2021 to 2025
- Current and Future Market Size Value (USD Million) Analysis and Forecast By Distribution Channel, 2026 to 2036
- Business To Business
- Direct Sales
- Manufacturers To Industry
- Bulk Supply Contracts
- Food Ingredient Distributors
- Regional Distributors
- National Distributors
- Business To Consumer
- Supermarkets And Hypermarkets
- Retail Chains
- Bulk Food Stores
- Online Retail
- E Commerce Platforms
- Business To Business
- Y-o-Y Growth Trend Analysis By Distribution Channel, 2021 to 2025
- Absolute $ Opportunity Analysis By Distribution Channel, 2026 to 2036
- Global Market Analysis 2021 to 2025 and Forecast 2026 to 2036, By Formulation
- Introduction / Key Findings
- Historical Market Size Value (USD Million) Analysis By Formulation, 2021 to 2025
- Current and Future Market Size Value (USD Million) Analysis and Forecast By Formulation, 2026 to 2036
- Full Cream Buttermilk Powder
- Standard Dairy Formulation
- High Fat Content
- Cream Based Variants
- Skimmed Buttermilk Powder
- Low Fat Formulation
- Reduced Fat Dairy Base
- Functional Low Fat Grade
- Fortified Buttermilk Powder
- Vitamin Fortified
- Calcium Enriched
- Protein Enriched
- Flavored Buttermilk Powder
- Masala Flavored
- Spiced Variants
- Regional Taste Variants
- Full Cream Buttermilk Powder
- Y-o-Y Growth Trend Analysis By Formulation, 2021 to 2025
- Absolute $ Opportunity Analysis By Formulation, 2026 to 2036
- Global Market Analysis 2021 to 2025 and Forecast 2026 to 2036, By Pricing Tier
- Introduction / Key Findings
- Historical Market Size Value (USD Million) Analysis By Pricing Tier, 2021 to 2025
- Current and Future Market Size Value (USD Million) Analysis and Forecast By Pricing Tier, 2026 to 2036
- Mid Range
- Branded Dairy Ingredients
- Standard Quality Products
- Economy
- Bulk Commodity Products
- Private Label Supply
- Premium
- Organic And Specialty Products
- Clean Label Certified
- Export Grade Products
- Mid Range
- Y-o-Y Growth Trend Analysis By Pricing Tier, 2021 to 2025
- Absolute $ Opportunity Analysis By Pricing Tier, 2026 to 2036
- Global Market Analysis 2021 to 2025 and Forecast 2026 to 2036, By Region
- Introduction
- Historical Market Size Value (USD Million) Analysis By Region, 2021 to 2025
- Current Market Size Value (USD Million) Analysis and Forecast By Region, 2026 to 2036
- North America
- Latin America
- Western Europe
- Eastern Europe
- East Asia
- South Asia and Pacific
- Middle East & Africa
- Market Attractiveness Analysis By Region
- North America Market Analysis 2021 to 2025 and Forecast 2026 to 2036, By Country
- Historical Market Size Value (USD Million) Trend Analysis By Market Taxonomy, 2021 to 2025
- Market Size Value (USD Million) Forecast By Market Taxonomy, 2026 to 2036
- By Country
- USA
- Canada
- Mexico
- By Product
- By Application
- By End Use
- By Distribution Channel
- By Formulation
- By Pricing Tier
- By Country
- Market Attractiveness Analysis
- By Country
- By Product
- By Application
- By End Use
- By Distribution Channel
- By Formulation
- By Pricing Tier
- Key Takeaways
- Latin America Market Analysis 2021 to 2025 and Forecast 2026 to 2036, By Country
- Historical Market Size Value (USD Million) Trend Analysis By Market Taxonomy, 2021 to 2025
- Market Size Value (USD Million) Forecast By Market Taxonomy, 2026 to 2036
- By Country
- Brazil
- Chile
- Rest of Latin America
- By Product
- By Application
- By End Use
- By Distribution Channel
- By Formulation
- By Pricing Tier
- By Country
- Market Attractiveness Analysis
- By Country
- By Product
- By Application
- By End Use
- By Distribution Channel
- By Formulation
- By Pricing Tier
- Key Takeaways
- Western Europe Market Analysis 2021 to 2025 and Forecast 2026 to 2036, By Country
- Historical Market Size Value (USD Million) Trend Analysis By Market Taxonomy, 2021 to 2025
- Market Size Value (USD Million) Forecast By Market Taxonomy, 2026 to 2036
- By Country
- Germany
- UK
- Italy
- Spain
- France
- Nordic
- BENELUX
- Rest of Western Europe
- By Product
- By Application
- By End Use
- By Distribution Channel
- By Formulation
- By Pricing Tier
- By Country
- Market Attractiveness Analysis
- By Country
- By Product
- By Application
- By End Use
- By Distribution Channel
- By Formulation
- By Pricing Tier
- Key Takeaways
- Eastern Europe Market Analysis 2021 to 2025 and Forecast 2026 to 2036, By Country
- Historical Market Size Value (USD Million) Trend Analysis By Market Taxonomy, 2021 to 2025
- Market Size Value (USD Million) Forecast By Market Taxonomy, 2026 to 2036
- By Country
- Russia
- Poland
- Hungary
- Balkan & Baltic
- Rest of Eastern Europe
- By Product
- By Application
- By End Use
- By Distribution Channel
- By Formulation
- By Pricing Tier
- By Country
- Market Attractiveness Analysis
- By Country
- By Product
- By Application
- By End Use
- By Distribution Channel
- By Formulation
- By Pricing Tier
- Key Takeaways
- East Asia Market Analysis 2021 to 2025 and Forecast 2026 to 2036, By Country
- Historical Market Size Value (USD Million) Trend Analysis By Market Taxonomy, 2021 to 2025
- Market Size Value (USD Million) Forecast By Market Taxonomy, 2026 to 2036
- By Country
- China
- Japan
- South Korea
- By Product
- By Application
- By End Use
- By Distribution Channel
- By Formulation
- By Pricing Tier
- By Country
- Market Attractiveness Analysis
- By Country
- By Product
- By Application
- By End Use
- By Distribution Channel
- By Formulation
- By Pricing Tier
- Key Takeaways
- South Asia and Pacific Market Analysis 2021 to 2025 and Forecast 2026 to 2036, By Country
- Historical Market Size Value (USD Million) Trend Analysis By Market Taxonomy, 2021 to 2025
- Market Size Value (USD Million) Forecast By Market Taxonomy, 2026 to 2036
- By Country
- India
- ASEAN
- Australia & New Zealand
- Rest of South Asia and Pacific
- By Product
- By Application
- By End Use
- By Distribution Channel
- By Formulation
- By Pricing Tier
- By Country
- Market Attractiveness Analysis
- By Country
- By Product
- By Application
- By End Use
- By Distribution Channel
- By Formulation
- By Pricing Tier
- Key Takeaways
- Middle East & Africa Market Analysis 2021 to 2025 and Forecast 2026 to 2036, By Country
- Historical Market Size Value (USD Million) Trend Analysis By Market Taxonomy, 2021 to 2025
- Market Size Value (USD Million) Forecast By Market Taxonomy, 2026 to 2036
- By Country
- Kingdom of Saudi Arabia
- Other GCC Countries
- Turkiye
- South Africa
- Other African Union
- Rest of Middle East & Africa
- By Product
- By Application
- By End Use
- By Distribution Channel
- By Formulation
- By Pricing Tier
- By Country
- Market Attractiveness Analysis
- By Country
- By Product
- By Application
- By End Use
- By Distribution Channel
- By Formulation
- By Pricing Tier
- Key Takeaways
- Key Countries Market Analysis
- USA
- Pricing Analysis
- Market Share Analysis, 2025
- By Product
- By Application
- By End Use
- By Distribution Channel
- By Formulation
- By Pricing Tier
- Canada
- Pricing Analysis
- Market Share Analysis, 2025
- By Product
- By Application
- By End Use
- By Distribution Channel
- By Formulation
- By Pricing Tier
- Mexico
- Pricing Analysis
- Market Share Analysis, 2025
- By Product
- By Application
- By End Use
- By Distribution Channel
- By Formulation
- By Pricing Tier
- Brazil
- Pricing Analysis
- Market Share Analysis, 2025
- By Product
- By Application
- By End Use
- By Distribution Channel
- By Formulation
- By Pricing Tier
- Chile
- Pricing Analysis
- Market Share Analysis, 2025
- By Product
- By Application
- By End Use
- By Distribution Channel
- By Formulation
- By Pricing Tier
- Germany
- Pricing Analysis
- Market Share Analysis, 2025
- By Product
- By Application
- By End Use
- By Distribution Channel
- By Formulation
- By Pricing Tier
- UK
- Pricing Analysis
- Market Share Analysis, 2025
- By Product
- By Application
- By End Use
- By Distribution Channel
- By Formulation
- By Pricing Tier
- Italy
- Pricing Analysis
- Market Share Analysis, 2025
- By Product
- By Application
- By End Use
- By Distribution Channel
- By Formulation
- By Pricing Tier
- Spain
- Pricing Analysis
- Market Share Analysis, 2025
- By Product
- By Application
- By End Use
- By Distribution Channel
- By Formulation
- By Pricing Tier
- France
- Pricing Analysis
- Market Share Analysis, 2025
- By Product
- By Application
- By End Use
- By Distribution Channel
- By Formulation
- By Pricing Tier
- India
- Pricing Analysis
- Market Share Analysis, 2025
- By Product
- By Application
- By End Use
- By Distribution Channel
- By Formulation
- By Pricing Tier
- ASEAN
- Pricing Analysis
- Market Share Analysis, 2025
- By Product
- By Application
- By End Use
- By Distribution Channel
- By Formulation
- By Pricing Tier
- Australia & New Zealand
- Pricing Analysis
- Market Share Analysis, 2025
- By Product
- By Application
- By End Use
- By Distribution Channel
- By Formulation
- By Pricing Tier
- China
- Pricing Analysis
- Market Share Analysis, 2025
- By Product
- By Application
- By End Use
- By Distribution Channel
- By Formulation
- By Pricing Tier
- Japan
- Pricing Analysis
- Market Share Analysis, 2025
- By Product
- By Application
- By End Use
- By Distribution Channel
- By Formulation
- By Pricing Tier
- South Korea
- Pricing Analysis
- Market Share Analysis, 2025
- By Product
- By Application
- By End Use
- By Distribution Channel
- By Formulation
- By Pricing Tier
- Russia
- Pricing Analysis
- Market Share Analysis, 2025
- By Product
- By Application
- By End Use
- By Distribution Channel
- By Formulation
- By Pricing Tier
- Poland
- Pricing Analysis
- Market Share Analysis, 2025
- By Product
- By Application
- By End Use
- By Distribution Channel
- By Formulation
- By Pricing Tier
- Hungary
- Pricing Analysis
- Market Share Analysis, 2025
- By Product
- By Application
- By End Use
- By Distribution Channel
- By Formulation
- By Pricing Tier
- Kingdom of Saudi Arabia
- Pricing Analysis
- Market Share Analysis, 2025
- By Product
- By Application
- By End Use
- By Distribution Channel
- By Formulation
- By Pricing Tier
- Turkiye
- Pricing Analysis
- Market Share Analysis, 2025
- By Product
- By Application
- By End Use
- By Distribution Channel
- By Formulation
- By Pricing Tier
- South Africa
- Pricing Analysis
- Market Share Analysis, 2025
- By Product
- By Application
- By End Use
- By Distribution Channel
- By Formulation
- By Pricing Tier
- USA
- Market Structure Analysis
- Competition Dashboard
- Competition Benchmarking
- Market Share Analysis of Top Players
- By Regional
- By Product
- By Application
- By End Use
- By Distribution Channel
- By Formulation
- By Pricing Tier
- Competition Analysis
- Competition Deep Dive
- Fonterra Co-operative Group
- Overview
- Product Portfolio
- Profitability by Market Segments (Product/Age /Sales Channel/Region)
- Sales Footprint
- Strategy Overview
- Marketing Strategy
- Product Strategy
- Channel Strategy
- Friesland Campina
- Arla Foods
- Lactalis Group
- Saputo Inc.
- Dairy Farmers of America
- Van Leeuwen Ice Cream
- Ingredient Solutions
- Glenstal Foods
- Amul
- Fonterra Co-operative Group
- Competition Deep Dive
- Assumptions & Acronyms Used


