The global baby powder market is expected to grow steadily, rising from USD 1.1 billion in 2025 to USD 1.8 billion by 2035, at a CAGR of approximately 5.0%. This growth is primarily driven by increasing awareness among parents regarding infant hygiene and skin care. The market is experiencing steady growth due to increasing awareness of infant hygiene and rising birth rates in developing regions. Parents are prioritizing products that offer skin protection and comfort, especially in hot and humid climates where diaper rashes and irritation are more common.
As a result, talc-free and hypoallergenic baby powders are gaining traction, driven by growing consumer demand for safer, dermatologically tested products. Emerging markets in Asia and Africa, where population growth remains high, are contributing significantly to the expansion of the industry.
In developed economies, the trend toward organic and natural baby care products is driving innovation in the baby powder category. Brands are focusing on clean-label, plant-based formulations free from parabens, phthalates, and artificial fragrances to cater to health-conscious parents. In addition, e-commerce growth has made premium products more accessible, enabling niche brands to reach a wider audience. Marketing campaigns highlighting safety, sustainability, and paediatrician recommendations are also playing a key role in influencing consumer purchase behavior.
Innovation and sustainability are becoming central themes for key players in the baby powder industry. Companies are increasingly focusing on developing powders with organic and biodegradable ingredients to align with evolving consumer preferences and stricter regulations.
For instance, Johnson & Johnson and Kimberly-Clark Corp have invested heavily in research to improve the safety profile and efficacy of their formulations. The shift towards environmentally-friendly packaging and cruelty-free certifications also appeals to the growing segment of eco-conscious consumers. Product safety and transparency have also gained prominence due to rising health concerns and evolving regulatory standards.
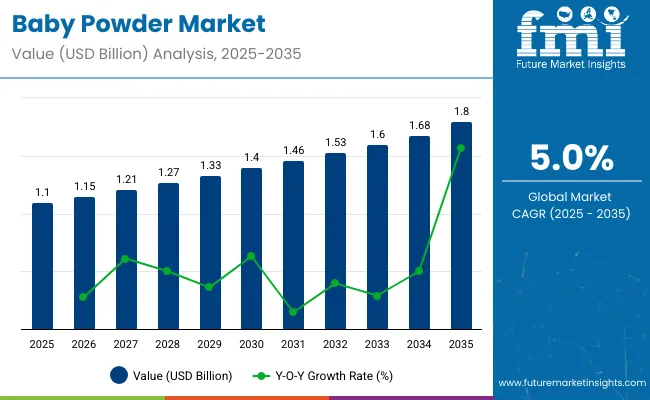
| Attributes | Details |
|---|---|
| Industry Value for 2025 | USD 1.1 billion |
| Industry Value for 2035 | USD 1.8 billion |
| Forecasted CAGR for 2025 to 2035 | 5.0% |
Per-person spending on baby powder varies notably across global regions, driven by economic status, cultural norms around infant care, and consumer awareness of hygiene and wellness products. Developed regions lead in individual expenditure due to higher disposable incomes and preference for premium, talc-free formulations. Emerging economies, while growing rapidly, report more modest per capita spending but offer significant volume growth potential.
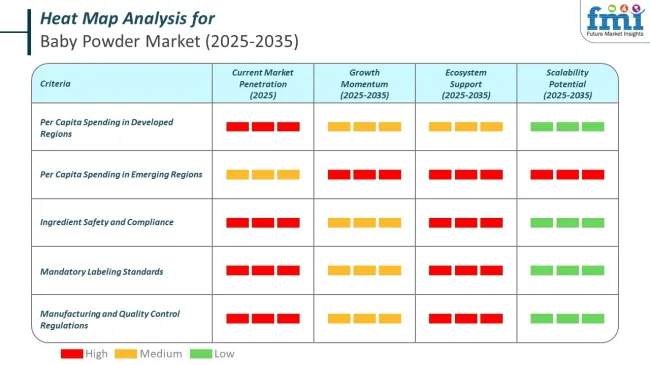
The baby powder market is governed by stringent regulatory frameworks aimed at ensuring safety, transparency, and product integrity. These regulations cover every stage of production, from sourcing raw materials to labeling and international trade compliance. Manufacturers are required to meet rigorous standards for ingredient purity, implement robust quality control systems, and provide accurate consumer information.
By ingredient, the market is segmented into talc-based and corn-starch-based. By price, it is divided into mass and premium. By region, the industry is analyzed across North America, Latin America, Europe, South Asia, East Asia, Oceania, and the Middle East & Africa (MEA).
On the basis of ingredient, the corn-starch-based segment registers 72% share. Corn-starch-based baby powders are widely sold because they are perceived as a safer and more natural alternative to talc-based powders.
Corn starch is plant-derived, gentle on sensitive skin, and effective at absorbing moisture, which helps prevent diaper rash and skin irritation in babies. Growing concerns over the potential health risks associated with talc, including legal cases linking it to cancer, have led many parents to seek talc-free options.
In response, manufacturers have expanded their offerings of corn-starch-based powders. Additionally, increasing consumer preference for clean-label, hypoallergenic, and naturally sourced personal care products has further driven the popularity of these powders.
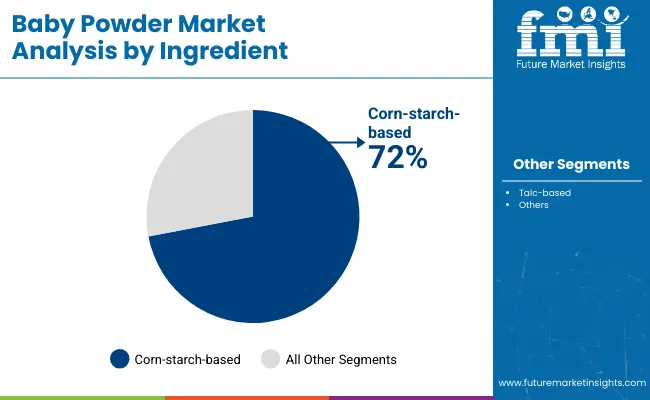
| Ingredient Segment | Share 2025 ) |
|---|---|
| Corn-starch-based | 72% |
In terms of price, the mass segment accounts for 64% share. Mass-priced baby powders are widely sold because they are affordable, accessible, and meet the essential needs of a large consumer base.
Many parents seek cost-effective products for daily baby care, and mass-priced options offer good value without compromising basic quality. These products are readily available in supermarkets, drugstores, and online platforms, making them easy to purchase.
Additionally, brand familiarity and trust in long-established mass-market baby care brands contribute to their widespread use. In price-sensitive markets and households with limited budgets, mass-priced baby powders remain a practical and popular choice for maintaining hygiene and preventing skin irritation in babies.
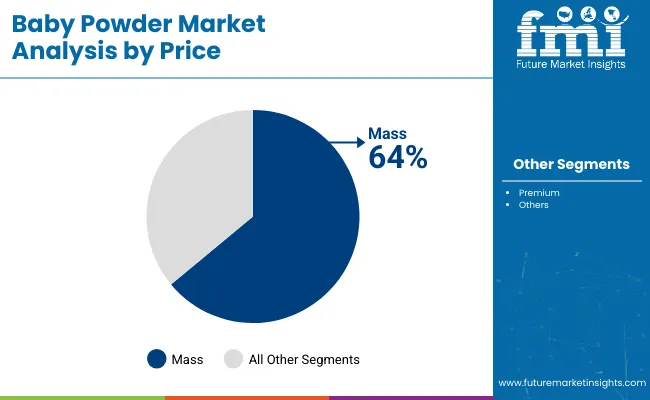
| Price Segment | Share (2025 ) |
|---|---|
| Mass | 64% |
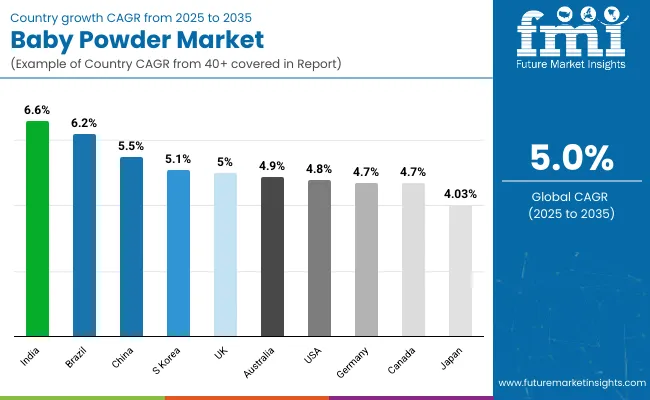
The United States baby powder market remains one of the most critical and mature sectors in the global industry. Valued at approximately USD 350 million in 2025, the sector is projected to reach USD 570 million by 2035, growing at a steady CAGR of 4.8%. The country’s growth is underpinned by high consumer awareness, robust regulatory oversight, and a rapid transition toward safer, natural formulations. The USA Food and Drug Administration (FDA) enforces comprehensive product safety standards, particularly around the use of talc, a compound increasingly scrutinized due to potential health concerns.
As a result, brands are proactively shifting toward corn-starch-based and talc-free powders to comply with regulation and meet rising consumer expectations. Major corporations, including Johnson & Johnson and Kimberly-Clark, are investing in R&D for hypoallergenic and eco-friendly variants to sustain consumer trust.
E-commerce platforms like Amazon and Walmart are increasingly dominant in distribution, offering wide selection, transparent reviews, and convenience. Consumers, especially millennials and Gen Z parents, are seeking clean-label, cruelty-free, and dermatologically tested products. With growing demand for sustainability and regulatory alignment, the USA sector is expected to maintain consistent growth and innovation through the forecast period.
| Country | CAGR (2025 to 2035) |
|---|---|
| United States | 4.8% |
China baby powder market is emerging as one of the most dynamic and high-potential markets in the global industry. The market is valued at USD 300 million in 2025 and projected to grow to USD 520 million by 2035 at a CAGR of 5.5%. The country’s expanding middle class, increasing birth rates under the three-child policy, and growing urbanization are key growth enablers. Chinese consumers are becoming more health-conscious and brand-sensitive, particularly when it comes to baby care products. This is driving demand for natural, talc-free, and dermatologist-approved.
The National Medical Products Administration (NMPA) has strengthened its oversight on baby cosmetics and hygiene products, promoting clean-label and allergen-free ingredients. Domestic brands are increasingly competitive, offering localized, affordable options that align with traditional values and herbal remedies. E-commerce platforms like Tmall, JD.com, and Xiaohongshu (Little Red Book) are revolutionizing retail access, with influencer-led advertising accelerating product adoption.
Additionally, rising exposure to Western consumer trends and increasing trust in premium international brands are boosting hybrid demand. As sustainability and ingredient transparency become critical, companies are responding with biodegradable packaging and corn-starch-based powders, solidifying China’s role as a fast-evolving and strategically significant sector for global and regional manufacturers.
| Country | CAGR (2025 to 2035) |
|---|---|
| China | 5.5% |
India represents one of the fastest-growing and most attractive sectors in the global baby powder segment, driven by a large and youthful population, rising disposable income, and improved healthcare access. The industry value of USD 120 million in 2025 and expected growth to USD 230 million by 2035 at a CAGR of 6.6%, the country is benefiting from both urban expansion and rural industry penetration. Increasing awareness of infant hygiene, driven by government campaigns such as Swachh Bharat (Clean India), has heightened demand for quality baby care products.
Indian consumers are highly price-sensitive, which has encouraged both multinational and local players to offer affordable SKUs without compromising on safety and quality. The Bureau of Indian Standards (BIS) and the Drug Controller General of India (DCGI) are strengthening product regulations, particularly around talc-based powders due to rising safety concerns. This regulatory tightening is encouraging the shift toward corn-starch and ayurvedic herbal alternatives, which resonate well with traditional preferences.
E-commerce platforms such as Flipkart, Amazon India, and Nykaa Baby are democratizing access to premium and niche products, especially among urban millennial parents. Innovation around herbal, paraben-free, and cruelty-free formulations is also seeing rapid uptake. India’s unique blend of cultural tradition and modern retail makes it a high-opportunity sector for sustained growth.
| Country | CAGR (2025 to 2035) |
|---|---|
| India | 6.6% |
The projected market value of USD 70 million in 2025, the sector is forecast to reach USD 110 million by 2035, reflecting a steady CAGR of 4.7%. Germany is one of Europe’s most mature and regulation-driven sectors for baby powder, underpinned by high safety standards, strong consumer trust in dermatologically tested products, and increasing demand for sustainable and natural formulations.
The Federal Institute for Risk Assessment (BfR) and the German Federal Ministry of Food and Agriculture (BMEL) are proactive in monitoring baby personal care products, particularly talc-based powders, which are now increasingly replaced by corn-starch and organic alternatives. German consumers, especially young parents, are highly informed and brand-loyal, gravitating toward hypoallergenic, fragrance-free, and eco-certified products. Retailers such as DM, Rossmann, and Müller, along with specialized organic stores, are key distribution channels, while online platforms like Amazon.de and Windeln.de continue to rise in popularity.
Leading domestic brands compete alongside global giants by emphasizing local production, sustainable sourcing, and recyclable packaging. Strict EU-wide regulations, combined with national sustainability goals, are pushing manufacturers to innovate through cleaner formulations and greener supply chains. Germany’s sector is set to maintain consistent, innovation-led growth, supported by a well-educated consumer base and robust regulatory compliance frameworks.
| Country | CAGR (2025 to 2035) |
|---|---|
| Germany | 4.7% |
The United Kingdom is a significant market in Europe, driven by strong consumer demand for safe, natural, and ethically sourced products. Valued at USD 65 million in 2025, the industry is projected to grow to USD 105 million by 2035 at a CAGR of 5.0%. The UK benefits from high regulatory standards enforced by the Medicines and Healthcare products Regulatory Agency (MHRA) and the UK Cosmetic Products Enforcement Regulations, which place stringent limits on talc content and promote transparency in ingredient disclosure.
Consumers in the UK are increasingly health-conscious and environmentally aware, with a growing preference for organic, talc-free, and vegan-certified sectors. Retailers such as Boots, Superdrug, and online platforms like Amazon UK play a crucial role in product availability and consumer education.
The rising trend of clean beauty and sustainable packaging is influencing purchase decisions, pushing brands to adopt biodegradable materials and cruelty-free testing protocols. Additionally, the post-Brexit regulatory landscape encourages manufacturers to align closely with both UK and EU standards, ensuring continued industry access and safety compliance. The UK sector is expected to witness steady growth, supported by innovation, evolving consumer preferences, and strong retail infrastructure.
| Country | CAGR (2025 to 2035) |
|---|---|
| UK | 5% |
Brazil represents a rapidly expanding market within Latin America’s baby powder industry, with an estimated value of USD 45 million in 2025, expected to nearly double to USD 85 million by 2035 at a CAGR of 6.2%. This growth is fueled by increasing urbanization, rising middle-class incomes, and heightened awareness about infant hygiene and safety. Regulatory oversight from ANVISA (National Health Surveillance Agency) has intensified, particularly focusing on the safety of talc-based powders, prompting a shift toward safer, natural alternatives like corn-starch-based powders.
Consumer preference is increasingly oriented towards organic and hypoallergenic products, driven by a surge in health consciousness and digital information access. E-commerce is rapidly gaining traction in Brazil, with platforms such as Mercado Livre and Amazon Brazil enabling broader access to both domestic and international brands.
Brazilian consumers are price sensitive but also seek trusted brands with clear certifications on safety and sustainability. In addition, social media influencers and parenting communities are significantly impacting brand trust and product adoption. Industry players are responding by expanding product portfolios that align with Brazil’s cultural values around natural ingredients and family care. The combination of evolving regulations, increasing consumer sophistication, and digital retail growth positions Brazil as a high-potential sector with robust long-term prospects.
| Country | CAGR (2025 to 2035) |
|---|---|
| Brazil | 6.2% |
Japan’s baby powder market, valued at USD 47.7 million in 2025 and projected to reach USD 71.1 million by 2035, is expected to grow at a steady CAGR of 4.03%. The country’s aging population and low birth rate present unique industry challenges, but the focus on premium quality and safety sustains demand for baby care products. Regulatory oversight by the Ministry of Health, Labour and Welfare (MHLW) ensures strict compliance with safety and ingredient standards, particularly limiting talc usage due to potential health concerns.
Japanese consumers emphasize product efficacy, hypoallergenic properties, and gentle formulations suitable for sensitive skin. There is a strong preference for corn-starch-based powders and organic variants, often segmented through trusted domestic brands with a long history of quality. Retail distribution is dominated by drugstores like Matsumoto Kiyoshi and Tsuruha, alongside online platforms such as Rakuten and Amazon Japan, which cater to tech-savvy, convenience-oriented shoppers.
Sustainability is gaining importance, with manufacturers adopting eco-friendly packaging and clean-label products aligned with Japan’s environmental consciousness. Additionally, innovations in baby care that incorporate traditional Japanese ingredients or advanced dermatological science appeal to local consumers. Despite demographic challenges, Japan’s sector remains stable, driven by quality-conscious parents and a well-regulated, innovation-focused industry landscape.
| Country | CAGR (2025 to 2035) |
|---|---|
| Japan | 4.03% |
Canada’s baby powder landscape is positioned for steady growth, with an estimated value of USD 40 million in 2025, expanding to USD 65 million by 2035 at a CAGR of 4.7%. The sector is supported by increasing health awareness among parents, high standards of consumer safety, and evolving preferences for natural and hypoallergenic products. Health Canada, the country’s regulatory authority, enforces strict guidelines on formulations, particularly limiting the use of talc due to potential health risks, thereby accelerating the shift towards corn-starch and organic alternatives.
Canadian consumers tend to prioritize ingredient transparency, ethical sourcing, and environmental impact when selecting baby powders. This is reflected in the growing popularity of certified organic, cruelty-free, and fragrance-free options. Distribution channels are well-developed, with large retail chains like Shoppers Drug Mart and Walmart, alongside a growing e-commerce sector, providing easy access to a broad range of products.
Sustainability initiatives are gaining momentum, with manufacturers introducing biodegradable packaging and reducing carbon footprints as key differentiators. Additionally, multicultural demographics contribute to diverse consumer preferences, driving product innovation tailored to various skin types and sensitivities. Overall, Canada’s landscape combines regulatory rigor, consumer sophistication, and sustainability focus, supporting consistent industry expansion.
| Country | CAGR (2025 to 2035) |
|---|---|
| Canada | 4.7% |
Australia’s baby powder market is set for moderate yet steady growth, valued at USD 30 million in 2025 and expected to reach USD 50 million by 2035, growing at a CAGR of 4.9%. This growth is driven by increasing consumer preference for natural and safe baby care products, along with stringent regulatory oversight by the Therapeutic Goods Administration (TGA) and Australian Competition and Consumer Commission (ACCC), which enforce safety standards and ingredient transparency.
Australian parents show a strong inclination towards talc-free, organic, and hypoallergenic, aligning with global trends emphasizing health and environmental consciousness. Local and international brands compete by highlighting eco-friendly ingredients and cruelty-free certifications. The rise of online retail platforms like Chemist Warehouse and Amazon Australia has broadened product accessibility, especially in remote regions. Sustainability is a key focus in Australia, with manufacturers adopting recyclable packaging and sustainable sourcing to meet consumer demand and government environmental policies.
Additionally, increased awareness about baby skin sensitivity and allergies has encouraged product innovation, including the development of mild, fragrance-free powders. Australia’s well-informed consumer base, combined with effective regulation and growing e-commerce, supports the steady expansion of its sector through 2035.
| Country | CAGR (2025 to 2035) |
|---|---|
| Australia | 4.9% |
South Korea’s baby powder market is experiencing healthy growth, valued at USD 40.3million in 2025 and expected to increase to USD 66.5million by 2035, reflecting a CAGR of 5.1%. This growth is driven by rising consumer awareness about product safety, ingredient quality, and an increasing preference for natural, talc-free options. The Ministry of Food and Drug Safety (MFDS) rigorously regulates cosmetic and personal care products, enforcing strict safety standards that limit talc use and encourage the adoption of safer alternatives such as corn-starch-based powders.
Korean consumers prioritize innovation, efficacy, and skin sensitivity in baby care products, influenced by a highly informed and tech-savvy population. Domestic brands are at the forefront of incorporating cutting-edge dermatological research and eco-friendly ingredients, often supported by endorsements from pediatricians and beauty experts. The robust online retail ecosystem, including platforms like Coupang and Gmarket, drives accessibility and rapid adoption of new products.
Sustainability is increasingly important, with companies adopting biodegradable packaging and clean-label formulations to meet consumer expectations and government environmental goals. South Korea’s baby powder industry benefits from a blend of stringent regulation, technological innovation, and evolving consumer preferences, positioning it for sustained growth and premiumization over the forecast period.
| Country | CAGR (2025 to 2035) |
|---|---|
| South Korea | 5.1% |
The global baby powder market is moderately fragmented, with several key players holding significant industry shares but numerous regional and niche brands also competing. Leading companies focus on innovation, sustainability, and expanding product portfolios to maintain competitive advantage.
Top companies like Johnson & Johnson, Kimberly-Clark, and Forest Produce Ltd. compete through continuous product innovation, especially in talc-free and organic formulations, responding to shifting consumer preferences. Pricing strategies are balanced to cater to both mass-sector and premium segments, ensuring broad accessibility.
Strategic partnerships with e-commerce platforms and retailers enhance distribution reach, while investments in sustainable packaging and ingredient sourcing strengthen brand reputation. Expansion into emerging sectors and diversification of product lines further fuel growth, with a strong emphasis on regulatory compliance and consumer trust building.
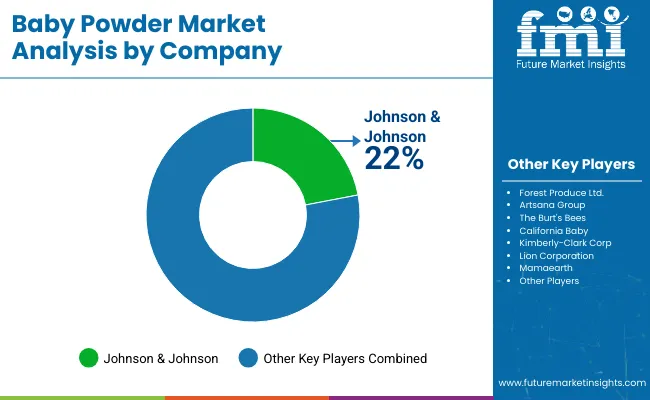
The global baby powder sectorsis dominated by key players such as Johnson & Johnson and Kimberly-Clark Corp, which together hold approximately 35-40% of the industry share. Johnson & Johnson leads with around 22%, leveraging its strong brand recognition, extensive distribution network, and continuous product innovation. Kimberly-Clark follows closely with about 15%, focusing on sustainable formulations and expanding its product portfolio.
Other significant players like Forest Produce Ltd. and Artsana Group command smaller but notable shares, around 5-7% each, capitalizing on niche sectors and regional strengths. Burt’s Bees and California Baby have carved out a growing presence, particularly in the organic and natural baby care segment, together holding roughly 6-8% of the sector.
Emerging brands such as Mamaearth, MeeMee, and Mothercare are gaining traction, especially in digital and e-commerce channels, collectively accounting for 10-12% of the industry share. Lion Corporation holds a modest share of approximately 3-4%, primarily in Asian sectors. The remaining sector, about 20-25%, is split among numerous smaller and regional players, reflecting the moderately fragmented nature of the industry.
| Company | Industry Share (%) |
|---|---|
| Johnson & Johnson | 22% |
| Kimberly-Clark Corp | 15% |
| Forest Produce Ltd. | 7% |
| Artsana Group | 6% |
| Burt’s Bees | 5% |
| Report Attributes | Details |
|---|---|
| Current Total Industry Size (2025) | USD 1.1 billion |
| Projected Industry Size (2035) | USD 1.8 billion |
| Overall Industry CAGR (2025 to 2035) | 5% |
| Base Year for Estimation | 2024 |
| Historical Period | 2020 to 2024 |
| Projections Period | 2025 to 2035 |
| Analysis Parameters | Revenue in USD billion/Volume in tons |
| By Ingredient Segments | Talc-based, Corn-starch-based |
| By Price | Mass and Premium |
| Regions Covered | North America, Europe, Asia Pacific, Latin America, Middle East & Africa |
| Countries Covered | United States, Japan, Germany, India, United Kingdom, France, Italy, Brazil, Canada, South Korea, Australia, Spain, Netherlands, Saudi Arabia, Switzerland |
| Key Players | Forest Produce Ltd., Artsana Group, The Burt's Bees, California Baby, Johnson & Johnson, Kimberly-Clark Corp, Lion Corporation, Mamaearth , Mee Mee , Mothercare , Other Players |
| Additional Attributes | Dollar sales by value, industry share analysis by region, country-wise analysis. |
Talc-based and Corn-starch-based are the key segments driving market growth.
Price is segregated into include Mass and Premium categories.
The market spans across North America, Latin America, East Asia, South Asia & Pacific, Western Europe, Eastern Europe, and the Middle East & Africa.
Global sales are expected to increase from USD 1.1 billion in 2025 to USD 1.8 billion by 2035, expanding at a CAGR of 5.0%.
The corn-starch-based segment is projected to grow the fastest, with a CAGR of approximately 6.5%, due to rising consumer preference for natural and safer alternatives.
The United States leads, followed closely by China and India, reflecting strong industry demand and consumer awareness.
Johnson & Johnson, Kimberly-Clark Corp, and Forest Produce Ltd. are among the top companies focusing on innovation, sustainability, and regulatory compliance.
E-commerce and pharmacy retail channels together account for nearly 50% of global sales, highlighting the increasing role of digital and pharmacy outlets.


Our Research Products

The "Full Research Suite" delivers actionable market intel, deep dives on markets or technologies, so clients act faster, cut risk, and unlock growth.

The Leaderboard benchmarks and ranks top vendors, classifying them as Established Leaders, Leading Challengers, or Disruptors & Challengers.

Locates where complements amplify value and substitutes erode it, forecasting net impact by horizon

We deliver granular, decision-grade intel: market sizing, 5-year forecasts, pricing, adoption, usage, revenue, and operational KPIs—plus competitor tracking, regulation, and value chains—across 60 countries broadly.

Spot the shifts before they hit your P&L. We track inflection points, adoption curves, pricing moves, and ecosystem plays to show where demand is heading, why it is changing, and what to do next across high-growth markets and disruptive tech

Real-time reads of user behavior. We track shifting priorities, perceptions of today’s and next-gen services, and provider experience, then pace how fast tech moves from trial to adoption, blending buyer, consumer, and channel inputs with social signals (#WhySwitch, #UX).

Partner with our analyst team to build a custom report designed around your business priorities. From analysing market trends to assessing competitors or crafting bespoke datasets, we tailor insights to your needs.
Supplier Intelligence
Discovery & Profiling
Capacity & Footprint
Performance & Risk
Compliance & Governance
Commercial Readiness
Who Supplies Whom
Scorecards & Shortlists
Playbooks & Docs
Category Intelligence
Definition & Scope
Demand & Use Cases
Cost Drivers
Market Structure
Supply Chain Map
Trade & Policy
Operating Norms
Deliverables
Buyer Intelligence
Account Basics
Spend & Scope
Procurement Model
Vendor Requirements
Terms & Policies
Entry Strategy
Pain Points & Triggers
Outputs
Pricing Analysis
Benchmarks
Trends
Should-Cost
Indexation
Landed Cost
Commercial Terms
Deliverables
Brand Analysis
Positioning & Value Prop
Share & Presence
Customer Evidence
Go-to-Market
Digital & Reputation
Compliance & Trust
KPIs & Gaps
Outputs
Full Research Suite comprises of:
Market outlook & trends analysis
Interviews & case studies
Strategic recommendations
Vendor profiles & capabilities analysis
5-year forecasts
8 regions and 60+ country-level data splits
Market segment data splits
12 months of continuous data updates
DELIVERED AS:
PDF EXCEL ONLINE
Japan Baby Powder Market Analysis - Size, Share & Trends 2025 to 2035
Korea Baby Powder Market Analysis – Size, Share & Trends 2025 to 2035
Western Europe Baby Powder Market Analysis – Size, Share & Trends 2025 to 2035
Baby Changing Station Market Size and Share Forecast Outlook 2025 to 2035
Baby Car Safety Seat Market Forecast and Outlook 2025 to 2035
Powdered Cellulose Market Analysis - Size, Share, and Forecast Outlook 2025 to 2035
Baby Bath and Shower Products Market Size and Share Forecast Outlook 2025 to 2035
Baby Doll Market Size and Share Forecast Outlook 2025 to 2035
Baby & Toddler Carriers & Accessories Market Size and Share Forecast Outlook 2025 to 2035
Powdered Soft Drinks Market Size and Share Forecast Outlook 2025 to 2035
Baby Shoes Market Size and Share Forecast Outlook 2025 to 2035
Baby Oral Care Market Size and Share Forecast Outlook 2025 to 2035
Baby Ear Thermometer Market Size and Share Forecast Outlook 2025 to 2035
Baby Food Dispensing Spoon Market Size and Share Forecast Outlook 2025 to 2035
Baby Pacifier Thermometer Market Size and Share Forecast Outlook 2025 to 2035
Baby Crib Sheet Market Size and Share Forecast Outlook 2025 to 2035
Baby Teeth Care Products Market Size and Share Forecast Outlook 2025 to 2035
Baby Food Market Analysis - Size, Share, and Forecast Outlook 2025 to 2035
Baby Diaper Market Growth, Forecast, and Trend Analysis 2025 to 2035
Baby Sling Market Size and Share Forecast Outlook 2025 to 2035

Thank you!
You will receive an email from our Business Development Manager. Please be sure to check your SPAM/JUNK folder too.
Chat With
MaRIA