Baby Pacifier Thermometer Market Overview (2022 to 2032)

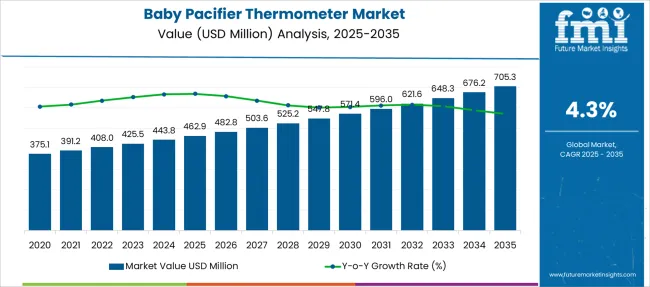
The baby pacifier thermometer market is anticipated to record a CAGR of 4.3% during the forecast period. It is expected that the market value is likely to go up from US$ 390 Million in 2021 to reach a valuation of US$ 646 Million by 2032.

Report Attributes Details
Baby Pacifier Thermometer Market Estimated Base Year Value (2021) US$ 390 Million
Baby Pacifier Thermometer Market Value in 2022 US$ 408 Million
Baby Pacifier Thermometer Market CAGR 2022 to 2032 4.3%
Baby Pacifier Thermometer Anticipated Market Value (2032) US$ 646 Million

Measurement of body temperatures has long been a difficult task for parents and healthcare professionals alike. The introduction of thermometers in baby pacifier toys is a suitable option to keep a check on the daily body temperature of babies.

Growing awareness among the parents of newly born babies about this incredible product has created a huge market for baby pacifier thermometers across the world. Assurance of safety by healthcare professionals has also translated the sales of baby pacifier thermometers into a profitable business.

The demand for baby pacifier thermometers is particularly higher in Asia Pacific nations owing to their highest birth counts. Rising living standards and the development of healthcare infrastructure has resulted in higher sales of baby pacifier thermometer contributing to a major part of the global market.

Some of the other benefits that have generated more demand for baby pacifier thermometer includes the reduction in engagement time with babies for working women. The affordability of such devices has also gone down in the recent past due to the advancements in electronic devices, further boosting the sales of baby pacifier thermometers.

Don't pay for what you don't need

Customize your report by selecting specific countries or regions and save 30%!

What are the Trending Opportunities for the Baby Pacifier Thermometer Market in the Coming Years?

Drivers for Baby Pacifier Thermometer Market

Another growth in the healthcare industry and an increasing number of hospitals and healthcare centers across the globe is supporting the higher demand for baby pacifier thermometers. This development has resulted in a greater baby pacifier thermometer market share, which in turn is witnessing growth in terms of value.

Trends for Baby Pacifier Thermometer Market

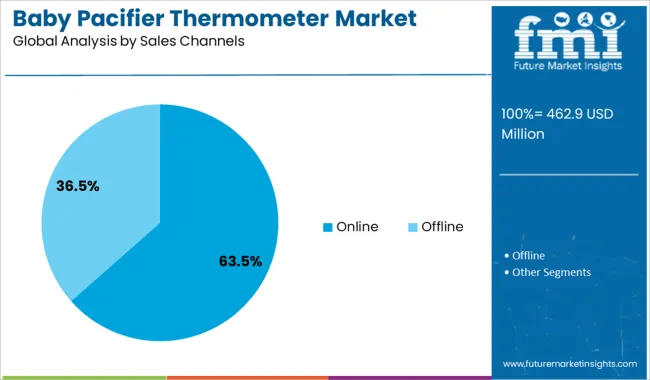
Manufacturers are principally involved in manufacturing baby pacifier thermometers which are very safe for baby’s skin and also comfortable for babies to hold in their mouths. Moreover, most of the manufacturers are principally engaged in sales of baby pacifier thermometers through third-party e-commerce Companies to increase the baby pacifier thermometer market share globally.

Opportunities for Baby Pacifier Thermometer Market

The addition of advanced features in the baby pacifier thermometer and affordability in the price in the near future is expected to be the main attraction for the higher sales of baby pacifier thermometers. And due to the growth of the electronics industry globally, the demand for the baby pacifier thermometer market has benefited immensely.

Challenges to Baby Pacifier Thermometer Market

Baby Pacifier Thermometer is not very accurate and takes a comparatively long time, about three to five minutes, to measure baby’s temperature. Thus, some customers are interested in purchasing ear thermometers, no-contact forehead infrared thermometers, and other products. This factor is expected to challenge the growth in demand for baby pacifier thermometers.
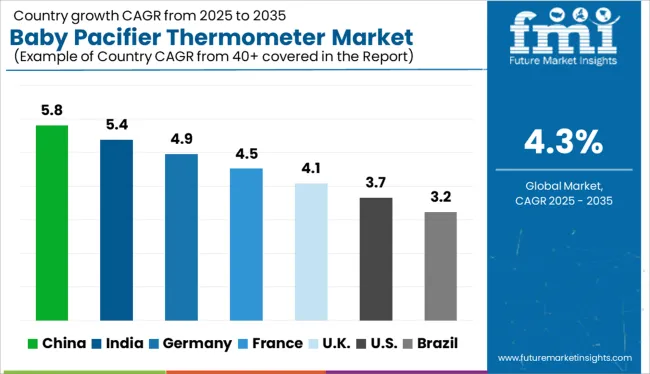
Which is the Leading Region in the Baby Pacifier Thermometer Market?

Increasing internet penetration in developing countries is one of the key factors responsible for increasing awareness among end-users and higher sales of baby pacifier thermometers to them. Moreover, e-commerce companies are increasing sales of baby pacifier thermometers by penetrating countries around the world.

The ease in the availability of the baby pacifier thermometer and the presence of a large number of players in the North America and Europe region is responsible for a significant baby pacifier thermometer market share in these regions. Europe is also a very attractive region in the globe for demand for baby pacifier thermometers.

The rapid growth of the electronics industry in the Asia Pacific region is expected to fuel the growth in sales of baby pacifier thermometers during the forecast period as this region contains the highest rate of population count, so the regional baby pacifier thermometer market is anticipated to be of the highest value by the end of the forecast period.

Demand for baby pacifier thermometers through e-commerce platforms is significantly growing in the Latin America region. Middle East and Africa are expected to witness slow growth of baby pacifier thermometer market share due to comparatively less awareness of the products due to the slow internet situation in these regions.

Increasing disposable income in Latin America and the Asia Pacific region, and increasing urbanization are some of the factors positively influencing the growth of the baby pacifier thermometer market.
Sudip Saha
Sudip Saha

Principal Consultant

Talk to Analyst

Find your sweet spots for generating winning opportunities in this market.

Who are the Key Players in the Dry Baby Pacifier Thermometer Market?

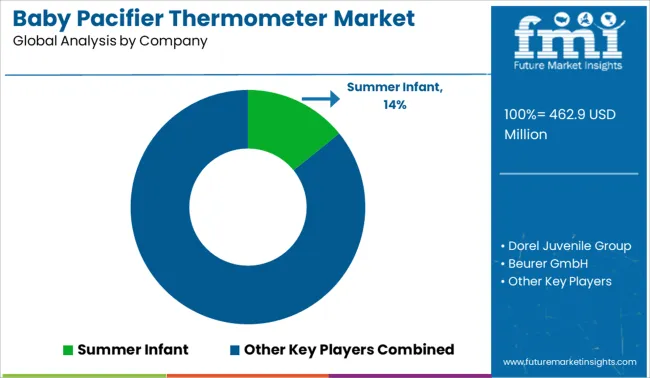
Some of the key players in the global baby pacifier thermometer market include Summer Infant, Dorel Juvenile Group, Beurer GmbH, Lanaform, Microlife, Terraillon, BRiGGS, Kuteks, Little Doctor, Rumble Tuff, B.Well, Vega, Valeo, Babyvelle and Hunkar.

Major Developments in the Baby Pacifier Thermometer Market

As the market players are focusing on adding new features such as memory features, fever alert glow, and comfortable orthodontic nipples, it is increasing the sales of baby pacific thermometers in terms of volume and attracting customers across the globe.

The demand for baby pacifier thermometers in healthcare centers, hospitals, and other places is witnessing significant growth in recent times.

Report Scope

Report Attribute Details
Growth Rate CAGR of 4.3% from 2022 to 2032
Base Year of Estimation 2021
Historical Data 2014 to 2020
Forecast Period 2022 to 2032
Quantitative Units Revenue in USD Billion, Volume in Kilotons, and CAGR from 2022 to 2032
Report Coverage Revenue Forecast, Volume Forecast, Company Ranking, Competitive Landscape, Growth Factors, Trends, and Pricing Analysis
Segments Covered
  • End Use
  • Distribution Channel
  • Battery Requirement
  • Region
Regions Covered
  • North America
  • Latin America
  • Western Europe
  • Eastern Europe
  • Asia Pacific Excluding Japan
  • Japan
  • Middle East and Africa
Key Countries Profiled
  • USA
  • Canada
  • Brazil
  • Argentina
  • Germany
  • United Kingdom
  • France
  • Spain
  • Italy
  • Nordics
  • BENELUX
  • Australia & New Zealand
  • China
  • India
  • ASIAN
  • GCC Countries
  • South Africa
Key Companies Profiled
  • Summer Infant
  • Dorel Juvenile Group
  • Beurer GmbH
  • Lanaform
  • Microlife
  • Terraillon
  • Briggs
  • Kuteks
  • Little Doctor
  • Rumble Tuff
  • B.Well
  • Vega
  • Valeo
  • Babyvelle
  • Hunkar
Customization scope Available Upon Request
Pricing and Purchase Option Avail of Customized purchase options to meet your exact research needs.

Get the data you need at a Fraction of the cost

Personalize your report by choosing insights you need
and save 40%!

Key Segments

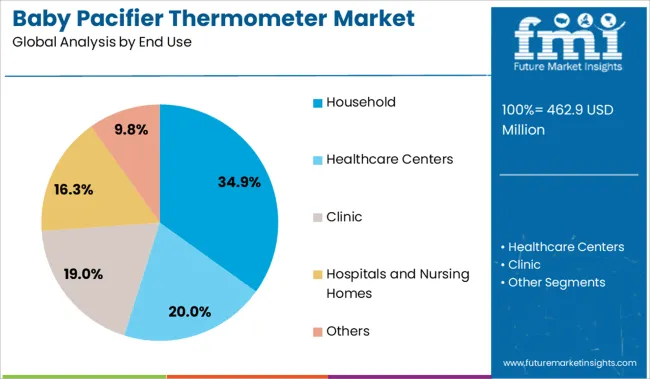
By End-use:

  • Household
  • Healthcare Centres
  • Clinic
  • Hospitals & Nursing homes
  • Others

By Distribution Channel:

  • OEM
  • Distributors
  • Retailers
  • E-Commerce

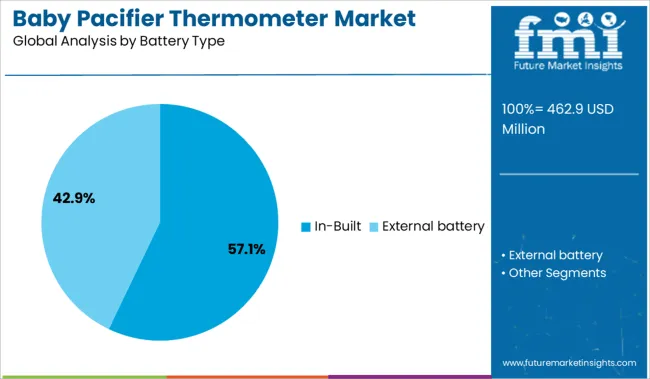
By Battery Requirement:

  • Inbuilt Battery
  • External Battery

By Region:

  • North America
  • Latin America
  • Asia Pacific
  • Middle East and Africa
  • Europe

Frequently Asked Questions

What is the Growth Outlook for the Baby Pacifier Thermometer Market?

The baby pacifier thermometer market is likely to register a CAGR of 4.3% during the forecast period.

The baby pacifier thermometer market is likely to register a CAGR of 4.3% during the forecast period?

Key players contributing to the growing demand for baby pacifier thermometers include Summer Infant, Dorel Juvenile Group, Beurer GmbH, Lanaform, Microlife, Terraillon, BRiGGS, Kuteks, Little Doctor, Rumble Tuff, B.Well, Vega, Valeo, Babyvelle and Hunkar.

What is the Future Analysis for the Total Value of the Baby Pacifier Thermometer Market?

As per the analysis, the baby pacifier thermometer market share is likely to be US$ 646 Million by 2032.

Table of Content
1. Executive Summary | Baby Pacifier Thermometer Market

    1.1. Global Market Outlook

    1.2. Demand-side Trends

    1.3. Supply-side Trends

    1.4. Technology Roadmap Analysis

    1.5. Analysis and Recommendations

2. Market Overview

    2.1. Market Coverage / Taxonomy

    2.2. Market Definition / Scope / Limitations

3. Market Background

    3.1. Market Dynamics

        3.1.1. Drivers

        3.1.2. Restraints

        3.1.3. Opportunity

        3.1.4. Trends

    3.2. Scenario Forecast

        3.2.1. Demand in Optimistic Scenario

        3.2.2. Demand in Likely Scenario

        3.2.3. Demand in Conservative Scenario

    3.3. Opportunity Map Analysis

    3.4. Investment Feasibility Matrix

    3.5. PESTLE and Porter’s Analysis

    3.6. Regulatory Landscape

        3.6.1. By Key Regions

        3.6.2. By Key Countries

4. Global Market Analysis 2017 to 2021 and Forecast, 2022 to 2032

    4.1. Historical Market Size Value (US$ Million) & Volume Analysis, 2017 to 2021

    4.2. Current and Future Market Size Value (US$ Million) & Volume Projections, 2022 to 2032

        4.2.1. Y-o-Y Growth Trend Analysis

        4.2.2. Absolute $ Opportunity Analysis

5. Global Market Analysis 2017 to 2021 and Forecast 2022 to 2032, By End Use

    5.1. Introduction / Key Findings

    5.2. Historical Market Size Value (US$ Million) & Volume Analysis By End Use, 2017 to 2021

    5.3. Current and Future Market Size Value (US$ Million) & Volume Analysis and Forecast By End Use, 2022 to 2032

        5.3.1. Household

        5.3.2. Healthcare Centers

        5.3.3. Clinic

        5.3.4. Hospitals and Nursing Homes

        5.3.5. Others

    5.4. Y-o-Y Growth Trend Analysis By End Use, 2017 to 2021

    5.5. Absolute $ Opportunity Analysis By End Use, 2022 to 2032

6. Global Market Analysis 2017 to 2021 and Forecast 2022 to 2032, By Battery Type

    6.1. Introduction / Key Findings

    6.2. Historical Market Size Value (US$ Million) & Volume Analysis By Battery Type, 2017 to 2021

    6.3. Current and Future Market Size Value (US$ Million) & Volume Analysis and Forecast By Battery Type, 2022 to 2032

        6.3.1. In-Built

        6.3.2. ·External battery

    6.4. Y-o-Y Growth Trend Analysis By Battery Type, 2017 to 2021

    6.5. Absolute $ Opportunity Analysis By Battery Type, 2022 to 2032

7. Global Market Analysis 2017 to 2021 and Forecast 2022 to 2032, By Sales Channels 

    7.1. Introduction / Key Findings

    7.2. Historical Market Size Value (US$ Million) & Volume Analysis By Sales Channels, 2017 to 2021

    7.3. Current and Future Market Size Value (US$ Million) & Volume Analysis and Forecast By Sales Channels, 2022 to 2032

        7.3.1. Online

        7.3.2. Offline

    7.4. Y-o-Y Growth Trend Analysis By Sales Channels, 2017 to 2021

    7.5. Absolute $ Opportunity Analysis By Sales Channels, 2022 to 2032

8. Global Market Analysis 2017 to 2021 and Forecast 2022 to 2032, By Region

    8.1. Introduction

    8.2. Historical Market Size Value (US$ Million) & Volume Analysis By Region, 2017 to 2021

    8.3. Current Market Size Value (US$ Million) & Volume Analysis and Forecast By Region, 2022 to 2032

        8.3.1. North America

        8.3.2. Latin America

        8.3.3. Europe

        8.3.4. East Asia

        8.3.5. South Asia

        8.3.6. Oceania

        8.3.7. Middle East and Africa

    8.4. Market Attractiveness Analysis By Region

9. North America Market Analysis 2017 to 2021 and Forecast 2022 to 2032, By Country

    9.1. Historical Market Size Value (US$ Million) & Volume Trend Analysis By Market Taxonomy, 2017 to 2021

    9.2. Market Size Value (US$ Million) & Volume Forecast By Market Taxonomy, 2022 to 2032

        9.2.1. By Country

            9.2.1.1. USA

            9.2.1.2. Canada

        9.2.2. By End Use

        9.2.3. By Battery Type

        9.2.4. By Sales Channels

    9.3. Market Attractiveness Analysis

        9.3.1. By Country

        9.3.2. By End Use

        9.3.3. By Battery Type

        9.3.4. By Sales Channels

    9.4. Key Takeaways

10. Latin America Market Analysis 2017 to 2021 and Forecast 2022 to 2032, By Country

    10.1. Historical Market Size Value (US$ Million) & Volume Trend Analysis By Market Taxonomy, 2017 to 2021

    10.2. Market Size Value (US$ Million) & Volume Forecast By Market Taxonomy, 2022 to 2032

        10.2.1. By Country

            10.2.1.1. Brazil

            10.2.1.2. Mexico

            10.2.1.3. Rest of Latin America

        10.2.2. By End Use

        10.2.3. By Battery Type

        10.2.4. By Sales Channels

    10.3. Market Attractiveness Analysis

        10.3.1. By Country

        10.3.2. By End Use

        10.3.3. By Battery Type

        10.3.4. By Sales Channels

    10.4. Key Takeaways

11. Europe Market Analysis 2017 to 2021 and Forecast 2022 to 2032, By Country

    11.1. Historical Market Size Value (US$ Million) & Volume Trend Analysis By Market Taxonomy, 2017 to 2021

    11.2. Market Size Value (US$ Million) & Volume Forecast By Market Taxonomy, 2022 to 2032

        11.2.1. By Country

            11.2.1.1. Germany

            11.2.1.2. Italy

            11.2.1.3. France

            11.2.1.4. United Kingdom

            11.2.1.5. Spain

            11.2.1.6. Russia

            11.2.1.7. BENELUX

            11.2.1.8. Rest of Europe

        11.2.2. By End Use

        11.2.3. By Battery Type

        11.2.4. By Sales Channels

    11.3. Market Attractiveness Analysis

        11.3.1. By Country

        11.3.2. By End Use

        11.3.3. By Battery Type

        11.3.4. By Sales Channels

    11.4. Key Takeaways

12. East Asia Market Analysis 2017 to 2021 and Forecast 2022 to 2032, By Country

    12.1. Historical Market Size Value (US$ Million) & Volume Trend Analysis By Market Taxonomy, 2017 to 2021

    12.2. Market Size Value (US$ Million) & Volume Forecast By Market Taxonomy, 2022 to 2032

        12.2.1. By Country

            12.2.1.1. China

            12.2.1.2. Japan

            12.2.1.3. South Korea

        12.2.2. By End Use

        12.2.3. By Battery Type

        12.2.4. By Sales Channels

    12.3. Market Attractiveness Analysis

        12.3.1. By Country

        12.3.2. By End Use

        12.3.3. By Battery Type

        12.3.4. By Sales Channels

    12.4. Key Takeaways

13. South Asia Market Analysis 2017 to 2021 and Forecast 2022 to 2032, By Country

    13.1. Historical Market Size Value (US$ Million) & Volume Trend Analysis By Market Taxonomy, 2017 to 2021

    13.2. Market Size Value (US$ Million) & Volume Forecast By Market Taxonomy, 2022 to 2032

        13.2.1. By Country

            13.2.1.1. India

            13.2.1.2. Thailand

            13.2.1.3. Malaysia

            13.2.1.4. Indonesia

            13.2.1.5. Rest of South Asia

        13.2.2. By End Use

        13.2.3. By Battery Type

        13.2.4. By Sales Channels

    13.3. Market Attractiveness Analysis

        13.3.1. By Country

        13.3.2. By End Use

        13.3.3. By Battery Type

        13.3.4. By Sales Channels

    13.4. Key Takeaways

14. Oceania Market Analysis 2017 to 2021 and Forecast 2022 to 2032, By Country

    14.1. Historical Market Size Value (US$ Million) & Volume Trend Analysis By Market Taxonomy, 2017 to 2021

    14.2. Market Size Value (US$ Million) & Volume Forecast By Market Taxonomy, 2022 to 2032

        14.2.1. By Country

            14.2.1.1. Australia

            14.2.1.2. New Zealand

        14.2.2. By End Use

        14.2.3. By Battery Type

        14.2.4. By Sales Channels

    14.3. Market Attractiveness Analysis

        14.3.1. By Country

        14.3.2. By End Use

        14.3.3. By Battery Type

        14.3.4. By Sales Channels

    14.4. Key Takeaways

15. Middle East and Africa Market Analysis 2017 to 2021 and Forecast 2022 to 2032, By Country

    15.1. Historical Market Size Value (US$ Million) & Volume Trend Analysis By Market Taxonomy, 2017 to 2021

    15.2. Market Size Value (US$ Million) & Volume Forecast By Market Taxonomy, 2022 to 2032

        15.2.1. By Country

            15.2.1.1. GCC Countries

            15.2.1.2. Turkey

            15.2.1.3. Israel

            15.2.1.4. South Africa

            15.2.1.5. Egypt

            15.2.1.6. Rest of Middle East and Africa

        15.2.2. By End Use

        15.2.3. By Battery Type

        15.2.4. By Sales Channels

    15.3. Market Attractiveness Analysis

        15.3.1. By Country

        15.3.2. By End Use

        15.3.3. By Battery Type

        15.3.4. By Sales Channels

    15.4. Key Takeaways

16. Key Countries Market Analysis

    16.1. USA

        16.1.1. Pricing Analysis

        16.1.2. Market Share Analysis, 2021

            16.1.2.1. By End Use

            16.1.2.2. By Battery Type

            16.1.2.3. By Sales Channels

    16.2. Canada

        16.2.1. Pricing Analysis

        16.2.2. Market Share Analysis, 2021

            16.2.2.1. By End Use

            16.2.2.2. By Battery Type

            16.2.2.3. By Sales Channels

    16.3. Brazil

        16.3.1. Pricing Analysis

        16.3.2. Market Share Analysis, 2021

            16.3.2.1. By End Use

            16.3.2.2. By Battery Type

            16.3.2.3. By Sales Channels

    16.4. Mexico

        16.4.1. Pricing Analysis

        16.4.2. Market Share Analysis, 2021

            16.4.2.1. By End Use

            16.4.2.2. By Battery Type

            16.4.2.3. By Sales Channels

    16.5. Argentina

        16.5.1. Pricing Analysis

        16.5.2. Market Share Analysis, 2021

            16.5.2.1. By End Use

            16.5.2.2. By Battery Type

            16.5.2.3. By Sales Channels

    16.6. Germany

        16.6.1. Pricing Analysis

        16.6.2. Market Share Analysis, 2021

            16.6.2.1. By End Use

            16.6.2.2. By Battery Type

            16.6.2.3. By Sales Channels

    16.7. Italy

        16.7.1. Pricing Analysis

        16.7.2. Market Share Analysis, 2021

            16.7.2.1. By End Use

            16.7.2.2. By Battery Type

            16.7.2.3. By Sales Channels

    16.8. France

        16.8.1. Pricing Analysis

        16.8.2. Market Share Analysis, 2021

            16.8.2.1. By End Use

            16.8.2.2. By Battery Type

            16.8.2.3. By Sales Channels

    16.9. United Kingdom

        16.9.1. Pricing Analysis

        16.9.2. Market Share Analysis, 2021

            16.9.2.1. By End Use

            16.9.2.2. By Battery Type

            16.9.2.3. By Sales Channels

    16.10. Spain

        16.10.1. Pricing Analysis

        16.10.2. Market Share Analysis, 2021

            16.10.2.1. By End Use

            16.10.2.2. By Battery Type

            16.10.2.3. By Sales Channels

    16.11. Russia

        16.11.1. Pricing Analysis

        16.11.2. Market Share Analysis, 2021

            16.11.2.1. By End Use

            16.11.2.2. By Battery Type

            16.11.2.3. By Sales Channels

    16.12. BENELUX

        16.12.1. Pricing Analysis

        16.12.2. Market Share Analysis, 2021

            16.12.2.1. By End Use

            16.12.2.2. By Battery Type

            16.12.2.3. By Sales Channels

    16.13. China

        16.13.1. Pricing Analysis

        16.13.2. Market Share Analysis, 2021

            16.13.2.1. By End Use

            16.13.2.2. By Battery Type

            16.13.2.3. By Sales Channels

    16.14. Japan

        16.14.1. Pricing Analysis

        16.14.2. Market Share Analysis, 2021

            16.14.2.1. By End Use

            16.14.2.2. By Battery Type

            16.14.2.3. By Sales Channels

    16.15. South Korea

        16.15.1. Pricing Analysis

        16.15.2. Market Share Analysis, 2021

            16.15.2.1. By End Use

            16.15.2.2. By Battery Type

            16.15.2.3. By Sales Channels

    16.16. India

        16.16.1. Pricing Analysis

        16.16.2. Market Share Analysis, 2021

            16.16.2.1. By End Use

            16.16.2.2. By Battery Type

            16.16.2.3. By Sales Channels

    16.17. GCC Countries

        16.17.1. Pricing Analysis

        16.17.2. Market Share Analysis, 2021

            16.17.2.1. By End Use

            16.17.2.2. By Battery Type

            16.17.2.3. By Sales Channels

    16.18. Turkey

        16.18.1. Pricing Analysis

        16.18.2. Market Share Analysis, 2021

            16.18.2.1. By End Use

            16.18.2.2. By Battery Type

            16.18.2.3. By Sales Channels

    16.19. Israel

        16.19.1. Pricing Analysis

        16.19.2. Market Share Analysis, 2021

            16.19.2.1. By End Use

            16.19.2.2. By Battery Type

            16.19.2.3. By Sales Channels

    16.20. South Africa

        16.20.1. Pricing Analysis

        16.20.2. Market Share Analysis, 2021

            16.20.2.1. By End Use

            16.20.2.2. By Battery Type

            16.20.2.3. By Sales Channels

    16.21. Egypt

        16.21.1. Pricing Analysis

        16.21.2. Market Share Analysis, 2021

            16.21.2.1. By End Use

            16.21.2.2. By Battery Type

            16.21.2.3. By Sales Channels

17. Market Structure Analysis

    17.1. Competition Dashboard

    17.2. Competition Benchmarking

    17.3. Market Share Analysis of Top Players

        17.3.1. By Regional

        17.3.2. By End Use

        17.3.3. By Battery Type

        17.3.4. By Sales Channels

18. Competition Analysis

    18.1. Competition Deep Dive

        18.1.1. Summer Infant

            18.1.1.1. Overview

            18.1.1.2. Product Portfolio

            18.1.1.3. Profitability by Market Segment

            18.1.1.4. Sales Footprint

            18.1.1.5. Strategy Overview

                18.1.1.5.1. Marketing Strategy

                18.1.1.5.2. Product Strategy

        18.1.2. Dorel Juvenile Group

            18.1.2.1. Overview

            18.1.2.2. Product Portfolio

            18.1.2.3. Profitability by Market Segment

            18.1.2.4. Sales Footprint

            18.1.2.5. Strategy Overview

                18.1.2.5.1. Marketing Strategy

                18.1.2.5.2. Product Strategy

        18.1.3. Beurer GmbH

            18.1.3.1. Overview

            18.1.3.2. Product Portfolio

            18.1.3.3. Profitability by Market Segment

            18.1.3.4. Sales Footprint

            18.1.3.5. Strategy Overview

                18.1.3.5.1. Marketing Strategy

                18.1.3.5.2. Product Strategy

        18.1.4. Lanaform

            18.1.4.1. Overview

            18.1.4.2. Product Portfolio

            18.1.4.3. Profitability by Market Segment

            18.1.4.4. Sales Footprint

            18.1.4.5. Strategy Overview

                18.1.4.5.1. Marketing Strategy

                18.1.4.5.2. Product Strategy

        18.1.5. Microlife

            18.1.5.1. Overview

            18.1.5.2. Product Portfolio

            18.1.5.3. Profitability by Market Segment

            18.1.5.4. Sales Footprint

            18.1.5.5. Strategy Overview

                18.1.5.5.1. Marketing Strategy

                18.1.5.5.2. Product Strategy

        18.1.6. Terraillon

            18.1.6.1. Overview

            18.1.6.2. Product Portfolio

            18.1.6.3. Profitability by Market Segment

            18.1.6.4. Sales Footprint

            18.1.6.5. Strategy Overview

                18.1.6.5.1. Marketing Strategy

                18.1.6.5.2. Product Strategy

        18.1.7. BRiGGS

            18.1.7.1. Overview

            18.1.7.2. Product Portfolio

            18.1.7.3. Profitability by Market Segment

            18.1.7.4. Sales Footprint

            18.1.7.5. Strategy Overview

                18.1.7.5.1. Marketing Strategy

                18.1.7.5.2. Product Strategy

        18.1.8. Kuteks

            18.1.8.1. Overview

            18.1.8.2. Product Portfolio

            18.1.8.3. Profitability by Market Segment

            18.1.8.4. Sales Footprint

            18.1.8.5. Strategy Overview

                18.1.8.5.1. Marketing Strategy

                18.1.8.5.2. Product Strategy

        18.1.9. Little Doctor

            18.1.9.1. Overview

            18.1.9.2. Product Portfolio

            18.1.9.3. Profitability by Market Segment

            18.1.9.4. Sales Footprint

            18.1.9.5. Strategy Overview

                18.1.9.5.1. Marketing Strategy

                18.1.9.5.2. Product Strategy

        18.1.10. Rumble Tuff

            18.1.10.1. Overview

            18.1.10.2. Product Portfolio

            18.1.10.3. Profitability by Market Segment

            18.1.10.4. Sales Footprint

            18.1.10.5. Strategy Overview

                18.1.10.5.1. Marketing Strategy

                18.1.10.5.2. Product Strategy

        18.1.11. B.Well

            18.1.11.1. Overview

            18.1.11.2. Product Portfolio

            18.1.11.3. Profitability by Market Segment

            18.1.11.4. Sales Footprint

            18.1.11.5. Strategy Overview

                18.1.11.5.1. Marketing Strategy

                18.1.11.5.2. Product Strategy

        18.1.12. Vega

            18.1.12.1. Overview

            18.1.12.2. Product Portfolio

            18.1.12.3. Profitability by Market Segment

            18.1.12.4. Sales Footprint

            18.1.12.5. Strategy Overview

                18.1.12.5.1. Marketing Strategy

                18.1.12.5.2. Product Strategy

        18.1.13. Valeo

            18.1.13.1. Overview

            18.1.13.2. Product Portfolio

            18.1.13.3. Profitability by Market Segment

            18.1.13.4. Sales Footprint

            18.1.13.5. Strategy Overview

                18.1.13.5.1. Marketing Strategy

                18.1.13.5.2. Product Strategy

        18.1.14. Babyvelle

            18.1.14.1. Overview

            18.1.14.2. Product Portfolio

            18.1.14.3. Profitability by Market Segment

            18.1.14.4. Sales Footprint

            18.1.14.5. Strategy Overview

                18.1.14.5.1. Marketing Strategy

                18.1.14.5.2. Product Strategy

        18.1.15. Hunkar

            18.1.15.1. Overview

            18.1.15.2. Product Portfolio

            18.1.15.3. Profitability by Market Segment

            18.1.15.4. Sales Footprint

            18.1.15.5. Strategy Overview

                18.1.15.5.1. Marketing Strategy

                18.1.15.5.2. Product Strategy

19. Assumptions & Acronyms Used

20. Research Methodology
Recommendations

Consumer Product

Baby Personal Care Market

March 2018

REP-GB-108

March 2023

250 pages

Consumer Product

Baby Ear Thermometer Market

August 2019

REP-GB-10201

June 2022

250 pages

Consumer Product

Baby strollers and prams Market

January 2019

REP-GB-8466

June 2022

250 pages

Consumer Product

Baby Teeth Care Products Market

August 2019

REP-GB-10108

June 2022

250 pages

Explore Consumer Product Insights

View Reports
Future Market Insights

Baby Pacifier Thermometer Market