Baby Snacks Market Size, Share, and Forecast Outlook 2025 to 2035

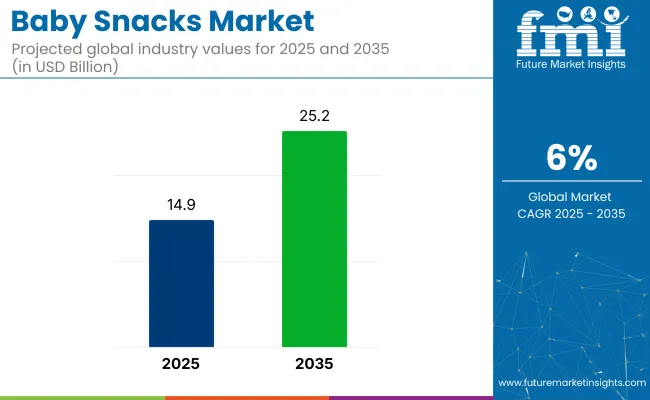
The global baby snacks market is set to expand significantly from USD 14.9 billion in 2025 to USD 25.2 billion by 2035, registering a steady CAGR of 6%.
Quick Stats of the Baby Snacks Market

  • Industry Size (2025): USD 14.9 billion
  • Industry Size (2035): USD 25.2 billion
  • CAGR (2025 to 2035): 6%
  • Top Product Type (2025): Vegetable-based Snacks (57%)
  • Key Growth Region: Asia Pacific (India)
  • Key Players: Abbott Laboratories, Amara Organic Foods, Danone S.A. (Happy Baby Organics), Ella's Kitchen, Hain Celestial Group (Earth's Best)

Baby Snacks Market

Growing health consciousness among parents, demand for clean-label convenience, and the rising preference for organic and allergen-free formulations are key drivers behind this growth. As parents seek alternatives to conventional baby food, innovations in vegetable-based and whole-food snacks are gaining momentum.

A major turning point in consumer sentiment emerged from a 2025 BBC News investigation, which revealed that many popular baby food pouches contained excessive sugar and critically low levels of essential nutrients like iron and vitamin C. Notably, even savory options provided less than 5% of a toddler’s iron requirement, and misleading “no added sugar” labels drew public backlash.

These findings triggered regulatory discussions around front-of-pack sugar warnings and stricter nutrition transparency. The outcome is an accelerated demand for nutrient-rich, whole-food-based, transparently labeled baby snacks.

The industry holds a niche yet growing share within its parent markets. In the baby food market, it accounts for approximately 5-7%, as these snacks are a specialized segment focused on providing convenient, nutritious options for infants and toddlers. Within the broader snacks market, the share is around 1-2%, as these snacks cater to a specific demographic.

In the health and wellness food market, the share is about 2-3%, driven by the increasing demand for organic, healthy snacks for young children. Within the packaged food market, these snacks represent approximately 3-4%, as they are typically packaged for convenience. In the convenience food market, the share is around 2-3%, as baby snacks are designed for easy, on-the-go consumption for busy parents.

Leading companies like Gerber (Nestlé), Happy Family Organics, Kraft Heinz, and Little Freddie are innovating with functional nutrition formats-such as teething crisps, melt-in-mouth veggie wafers, and iron-fortified finger foods-catering to both infants and toddlers. With clean labeling, responsible sourcing, and developmental nutrition at the forefront, the industry is poised for responsible growth.

Analysis of Baby Snacks Market by Top Investment Segments

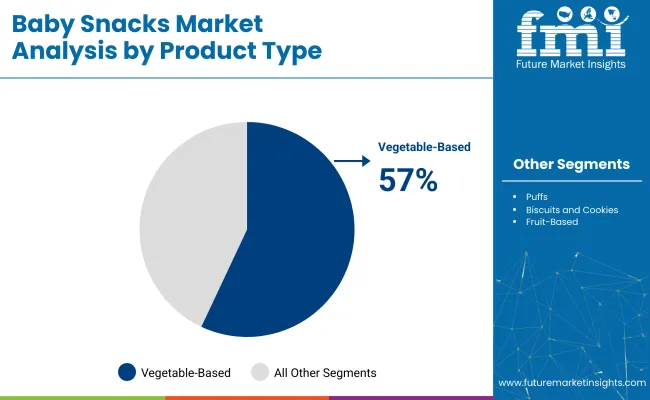
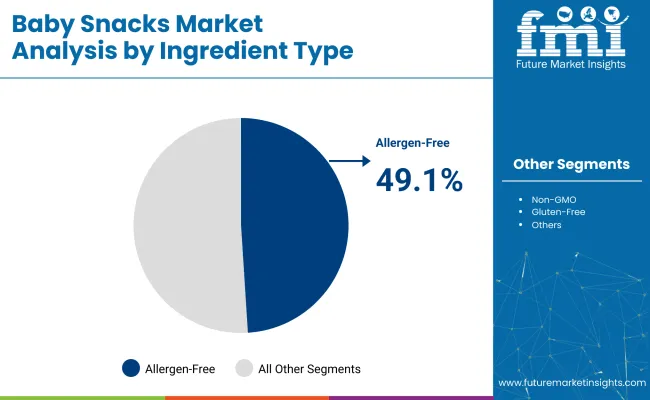
The industry is projected to grow with vegetable-based snacks, allergen-free ingredients, and direct-to-consumer channels leading the way in 2025. Vegetable-based snacks will dominate with 57%, allergen-free ingredients will capture 49.1%, and direct-to-consumer platforms will hold 23.8% of the industry share.

Vegetable-based snacks lead the product category with 57% share in 2025

Vegetable-based snacks are expected to dominate the product category in the industry with a 57% share in 2025. Health-conscious parents are increasingly choosing these nutrient-rich, clean-label snacks for infants and toddlers, aligning with pediatric dietary recommendations.

These snacks are rich in fiber, vitamins, and natural flavors, promoting better satiety and nutrition. Brands are launching products like baked veggie sticks, puffed snacks, and dehydrated vegetable bites to support weaning stages and encourage healthy eating habits. As concerns over sugar and additives in traditional snacks rise, demand for plant-based, minimally processed options is accelerating.
  • Rich in fiber, vitamins, and natural flavors for better nutrition
  • Baked veggie sticks and puffed snacks support weaning stages
  • Growing demand for minimally processed, plant-based snacks in early childhood nutrition

Baby Snacks Market Analysis By Product Type

Allergen-free ingredients dominate formulations with 49.1% industry share

Allergen-free ingredients are projected to lead the formulation segment, accounting for 49.1% of the industry share in 2025. As food allergies become more prevalent among infants, parents are increasingly seeking formulations free from major allergens like dairy, soy, eggs, gluten, and nuts. This trend is fueled by the need for food that ensures infant safety, particularly for first-time parents concerned about allergic reactions.

Regulatory support from pediatric associations and the growing availability of hypoallergenic snack options contribute to the segment's growth. Brands are developing rice, quinoa, and oat-based alternatives fortified with essential nutrients, catering to the demand for clean and transparent ingredient labels.
  • Rising prevalence of food allergies drives demand for allergen-free snacks
  • Regulatory support and pediatric recommendations boost allergen-free product adoption
  • Rice, quinoa, and oat-based alternatives offer balanced nutrition and transparency

Baby Snacks Market Analysis By Ingredients

Direct-to-consumer channels drive distribution with 23.8% industry share

Direct-to-consumer (DTC) platforms are expected to dominate the distribution channel segment, capturing 23.8% of the industry share in 2025. Modern parents increasingly prefer purchasing these snacks directly from trusted brand websites and subscription platforms, prioritizing convenience, speed, and personalized options.

DTC platforms enable brands to offer customized bundles, allergen-specific filters, and exclusive organic or premium snack lines. Social media and digital parenting communities further amplify the reach of DTC channels, enhancing brand loyalty through targeted sampling and AI-powered recommendations. As traditional retail faces limitations in variety and shelf space, DTC offers a more agile and scalable growth path.

  • DTC platforms offer convenience and personalized shopping experiences
  • Social media and digital parenting communities enhance DTC reach
  • AI-powered recommendations and targeted sampling boost customer loyalty

Top Baby Snacks Market Dynamics

The industry is growing due to health-focused innovations, clean-label products, and the rise of e-commerce and subscription models. Parents prioritize nutritious, allergen-free snacks for their children, and online platforms are offering convenience and personalized options.

Health-First Snacking: Nutrient-Rich, Clean-Label Innovations

Parents are increasingly choosing nutrient-dense, clean-label snacks for their infants and toddlers. Brands are fortifying products with essential nutrients like vitamins, iron, and protein to support childhood development. Leading companies like Gerber and Plum Organics are launching whole-grain snacks, fruit bars, and non-GMO yogurts, while offering plant-based alternatives like sweet potatoes and quinoa.

Allergen-free and gluten-free options are becoming popular, with packaging innovations such as resealable pouches and portion-controlled trays adding to convenience. Certification demands for USDA Organic and Non-GMO Project Verified products are also rising.

  • Parents are opting for nutrient-rich snacks with clean, simple ingredients.
  • Brands are fortifying snacks with vitamins, iron, and protein to support development.
  • Packaging innovations and certifications like USDA Organic and Non-GMO are increasingly demanded.

E-Commerce and Subscription Models Expanding Industry Reach

E-commerce and subscription models are transforming how these snacks reach consumers. Parents are using direct-to-consumer platforms to receive curated monthly snack boxes, which allow them to sample new products without visiting stores. Digital marketplaces like Amazon Baby Store and specialty retailers are showcasing health-focused, user-rated snacks.

Subscription services are offering personalized bundles tailored to specific ages, allergies, and flavor preferences, catering to busy households. Brands are leveraging social media advertising, influencer collaborations, and mobile apps to engage millennial parents and emphasize repeat-purchase convenience.
  • Online platforms and subscription services are offering personalized, convenient snack options.
  • Digital marketplaces and specialty retailers highlight health-focused baby snacks with user ratings.
  • Brands are investing in social media and influencer partnerships to engage millennial parents.

Top Countries Driving Baby Snacks Production, Retail Supply, and Nutritional Standards

Country Wise Analysis Of Baby Snacks Market Cagr 2025 To 2035

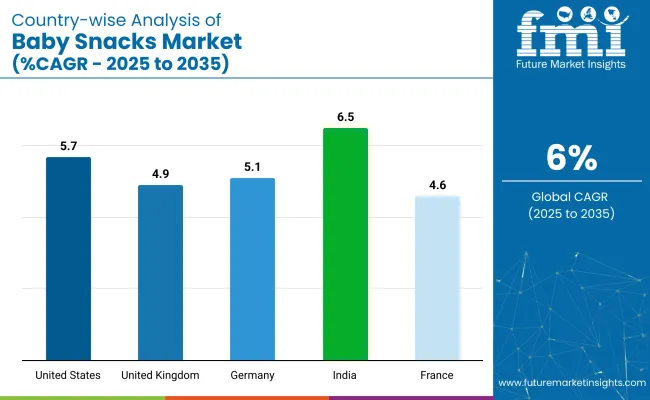
Countries CAGR (2025 to 2035)
United States 5.7%
United Kingdom 4.9%
India 6.5%
Germany 5.1%
France 4.6%

The industry demand is projected to rise at a 6% CAGR from 2025 to 2035. Of the five profiled countries out of 40 covered, India leads at 6.5%, followed by the United States at 5.7% and Germany at 5.1%, while the United Kingdom records 4.9% and France posts 4.6%.

These rates translate to a growth premium of +8% for India, +2% for the United States, and -4% for Germany versus the baseline, whereas the United Kingdom and France trail by -18% and -23%, respectively. Divergence reflects local catalysts: increasing demand for organic and nutritious baby snacks in India, expanding baby food markets in the USA, and the slow but steady growth in traditional industries in Europe.

Growth Analysis of Baby Snacks Market in the United States

The industry in the United States is set to record a CAGR of 5.7% from 2025 to 2035. Demand has been anchored by health-oriented parenting, with fruit purées, whole-grain crackers, and dairy puffs preferred for toddlers. Leading brands-Gerber, Happy Family, Plum Organics-have shifted toward transparent labelling and superfood inclusions.

Clean-label certification and allergen-management protocols have reinforced retailer confidence. Online grocery expansion has widened geographic reach, while big-box shelf resets have granted high-traffic visibility. Functional additions such as probiotics and iron have been incorporated to align with pediatric nutrition advice, sustaining repeat purchase rates.

  • Probiotic cereal bites have been positioned as digestive-support snacks for ages 8 months+.
  • Merchandising algorithms on mass-market e-commerce sites have boosted cross-category bundling.
  • Recyclable pouch formats with portion windows have replaced opaque plastic tubs.

Future Outlook for Baby Snacks Market in the United Kingdom

Sales of baby snacks in the United Kingdom are projected to grow at a CAGR of 4.9% through 2035. Lower-sugar formulations, driven by HFSS regulation, have guided reformulation using fruit purées, ancient grains, and vegetable puffs. Ella’s Kitchen and Organix have emphasized nutrient density and compostable packaging, winning listings across grocery multiples and independent pharmacies.

Baby-led weaning has normalized finger-food uptake, so texture-rich wafers and soft breadsticks have gained favor. Retailers have responded by dedicating aisle space to portion-controlled packs that assist parents in managing snack frequency.

  • HFSS compliance badges are displayed on front-of-pack icons to aid quick comparison.
  • Vegetable-forward snack multipacks target nursery lunch-box programs.
  • QR-linked provenance stories are printed on outer cartons for shopper reassurance.

Demand Forecast for Baby Snacks Market in India

Demand for baby snacks in India is estimated to grow at a CAGR of 6.5% during 2025 to 2035. Rising maternal awareness and time-pressed households have increased reliance on conveniently packed nutrient-dense bites. Domestic start-ups such as Slurrp Farm and Timios have introduced ragi, moong-dal, and jaggery blends that resonate with regional taste palates.

Government nutrition drives have highlighted iron and protein gaps, encouraging fortified snack launches. Direct-to-consumer channels and pharmacy chains have penetrated tier-2 cities, expanding category reach. Ayurvedic positioning has been adopted to communicate natural functional benefits without synthetic additives.

  • Millet-based teething sticks feature calcium fortification for bone health claims.
  • Subscription boxes deliver monthly assortments aligned with developmental milestones.
  • Regional co-packers have adopted nitrogen-flush technology to extend shelf life in humid zones.

Analysis of Baby Snacks Market in Germany

The industry in Germany is expected to grow at a CAGR of 5.1% through 2035. Organic certification and non-GMO assurance have remained central to purchase decisions. Brands including Hipp and Holle have employed spelt and oat in biscuit and fruit-bar formats, supported by strict toxin-screening regimes.

Retailers maintain planogram slots for low-sugar, allergen-light options endorsed by pediatric associations. Educational campaigns on early nutrient balance have encouraged repeated purchases of iron-enriched snacks. Supply chains have prioritized recyclable trays and paper-based overwraps to satisfy packaging directives.

  • Pulse-protein crisps are promoted as plant-based iron contributors for infants 10 months+.
  • Cold-pressed fruit wafers avoid baking to preserve vitamin content.
  • Digital loyalty apps reward barcode scans with dietician-approved meal plans.

Baby Snacks Market Growth Outlook in France

The industry in France is projected to grow at a CAGR of 4.6% through 2035. Gourmet sensibilities have propelled demand for culinary-authentic snacks like vegetable crisps, baked crackers, and soft fruit cubes. Suppliers Babybio and Good Goût have blended quinoa, beetroot, and goat cheese into textures suitable from six months.

National health-agency guidance on reduced salt and sugar has reinforced reformulation momentum. Organic provenance and short ingredient lists are highlighted on shelf-edge labels, reinforcing parental trust. Category growth benefits from a mature pharmacy channel that curates premium infant-nutrition assortments.
  • Steam-baked mini-crackers include thyme and carrot for palate development.
  • Re-seal pouches with tactile grips aid self-feeding without mess.
  • Agrifood cooperatives supply traceable cereal inputs certified under Label Rouge.

Leading Baby Snacks Market Suppliers

Baby Snacks Market Analysis By Company

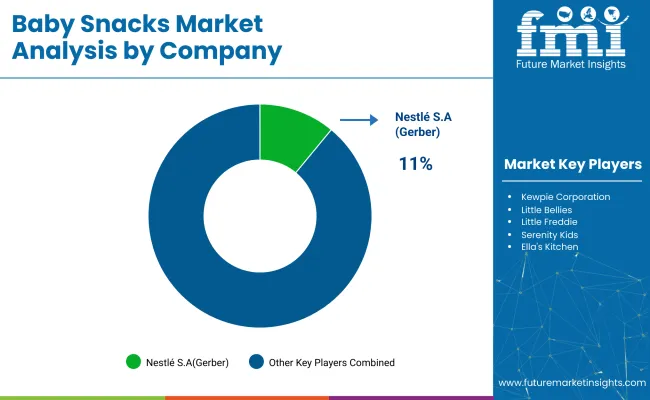
The baby snack industry is shaped by dominant players, key players, and emerging brands. Dominant players such as Nestlé S.A. (Gerber), Danone S.A. (Happy Baby Organics), and The Kraft Heinz Company lead the global industry with strong brand equity, wide retail reach, and diverse product offerings.

Key players like Amara Organic Foods, Serenity Kids, and Sprout Foods emphasize clean-label innovation and digital-first distribution strategies. Emerging players, including Little Bellies and Little Freddie, are gaining traction in regional industries by focusing on organic, allergen-free snacks and affordable pricing, catering to evolving parental preferences and local nutritional guidelines.

Recent Industry News

  • In June 2025, the NHS updated its Start for Life guidance, warning against regular use of baby food pouches and jars due to low nutritional value and risk of tooth decay, according to coverage by The Times UK.
  • A June 2025 study published in Appetite and reported by The Times UK found that 74% of British babies aged 6-7 months consumed processed snacks too early, influenced by misleading packaging that created a false perception of healthiness and safety.

Report Scope - Baby Snacks Market

Report Attributes Details
Industry Size (2025) USD 14.9 billion
Projected Industry Size (2035) USD 25.2 billion
CAGR (2025 to 2035) 6%
Base Year for Estimation 2024
Historical Period 2020 to 2024
Projections Period 2025 to 2035
Quantitative Units USD billion for value and million units for volume
Product Types Analyzed (Segment 1) Puffs, Biscuits and Cookies, Fruit-Based Snacks, Yogurt Drops and Freeze-Dried Snacks, Vegetable-Based Snacks, Teething Biscuits and Rusks
Ingredient Types Analyzed (Segment 2) Organic, Conventional, Non-GMO, Gluten-Free, Allergen-Free
Distribution Channels Analyzed (Segment 3) Supermarkets and Hypermarkets, Convenience Stores and Drugstores, Specialty Baby Stores, Online Retail, Direct-to-Consumer, Others
Countries Covered United States, Canada, Germany, United Kingdom, France, Italy, Spain, China, India, Japan, South Korea, Australia, Brazil, Mexico, Saudi Arabia, UAE, South Africa
Key Players influencing the Industry Abbott Laboratories, Amara Organic Foods, Danone S.A. (Happy Baby Organics), Ella's Kitchen, Hain Celestial Group (Earth's Best), Hero Group (Beech-Nut), Kewpie Corporation, Little Bellies, Little Freddie, Nestlé S.A. (Gerber), Plum Organics (Campbell Soup Company), Serenity Kids, Sprout Foods, Inc., The Kraft Heinz Company
Additional Attributes Dollar sales by snack category, demand for organic and allergen-free formulations, retail vs. D2C share, emerging snacking formats like freeze-dried and vegetable-based options, innovations in nutrition and packaging

Key Players

  • Abbott Laboratories
  • Amara Organic Foods
  • Danone S.A. (Happy Baby Organics)
  • Ella's Kitchen
  • Hain Celestial Group (Earth's Best)
  • Hero Group (Beech-Nut)
  • Kewpie Corporation
  • Little Bellies
  • Little Freddie
  • Nestlé S.A. (Gerber)
  • Plum Organics (Campbell Soup Company)
  • Serenity Kids
  • Sprout Foods, Inc.
  • The Kraft Heinz Company

Key Segments Studied in the Baby Snacks Market

By Product Type:

By product type, the industry is segmented into puffs, biscuits and cookies, fruit-based snacks, yogurt drops and freeze-dried snacks, vegetable-based snacks, and teething biscuits and rusks.

By Ingredient Type:

By ingredient type, the industry is segmented into organic, conventional, non-GMO, gluten-free, and allergen-free.

By Distribution Channel:

By distribution channel, the industry includes supermarkets and hypermarkets, convenience stores and drugstores, specialty baby stores, online retail, direct-to-consumer, and others.

By Region:

By region, the industry is categorized into North America, Latin America, East Asia, South Asia & Pacific, Western Europe, Eastern Europe, and Middle East & Africa.

Table of Content

  1. Executive Summary
    • Global Market Outlook
    • Demand-side Trends
    • Supply-side Trends
    • Technology Roadmap Analysis
    • Analysis and Recommendations
  2. Market Overview
    • Market Coverage / Taxonomy
    • Market Definition / Scope / Limitations
  3. Market Background
    • Market Dynamics
      • Drivers
      • Restraints
      • Opportunity
      • Trends
    • Scenario Forecast
      • Demand in Optimistic Scenario
      • Demand in Likely Scenario
      • Demand in Conservative Scenario
    • Opportunity Map Analysis
    • Product Life Cycle Analysis
    • Supply Chain Analysis
      • Supply Side Participants and their Roles
        • Producers
        • Mid-Level Participants (Traders/ Agents/ Brokers)
        • Wholesalers and Distributors
      • Value Added and Value Created at Node in the Supply Chain
      • List of Raw Material Suppliers
      • List of Existing and Potential Buyer’s
    • Investment Feasibility Matrix
    • Value Chain Analysis
      • Profit Margin Analysis
      • Wholesalers and Distributors
      • Retailers
    • PESTLE and Porter’s Analysis
    • Regulatory Landscape
      • By Key Regions
      • By Key Countries
    • Regional Parent Market Outlook
    • Production and Consumption Statistics
    • Import and Export Statistics
  4. Global Market Analysis 2020 to 2024 and Forecast, 2025 to 2035
    • Historical Market Size Value (USD Billion) & Volume (Million Units) Analysis, 2020 to 2024
    • Current and Future Market Size Value (USD Billion) & Volume (Million Units) Projections, 2025 to 2035
      • Y-o-Y Growth Trend Analysis
      • Absolute $ Opportunity Analysis
  5. Global Market Pricing Analysis 2020 to 2024 and Forecast 2025 to 2035
  6. Global Market Analysis 2020 to 2024 and Forecast 2025 to 2035, By Product Type
    • Introduction / Key Findings
    • Historical Market Size Value (USD Billion) & Volume (Million Units) Analysis By Product Type, 2020 to 2024
    • Current and Future Market Size Value (USD Billion) & Volume (Million Units) Analysis and Forecast By Product Type, 2025 to 2035
      • Puffs
      • Biscuits and Cookies
      • Fruit-Based Snacks
      • Yogurt Drops and Freeze-Dried Snacks
      • Vegetable-Based Snacks
      • Teething Biscuits and Rusks
    • Y-o-Y Growth Trend Analysis By Product Type, 2020 to 2024
    • Absolute $ Opportunity Analysis By Product Type, 2025 to 2035
  7. Global Market Analysis 2020 to 2024 and Forecast 2025 to 2035, By Ingredient Type
    • Introduction / Key Findings
    • Historical Market Size Value (USD Billion) & Volume (Million Units) Analysis By Ingredient Type, 2020 to 2024
    • Current and Future Market Size Value (USD Billion) & Volume (Million Units) Analysis and Forecast By Ingredient Type, 2025 to 2035
      • Organic
      • Conventional
      • Non-GMO
      • Gluten-Free
      • Allergen-Free
    • Y-o-Y Growth Trend Analysis By Ingredient Type, 2020 to 2024
    • Absolute $ Opportunity Analysis By Ingredient Type, 2025 to 2035
  8. Global Market Analysis 2020 to 2024 and Forecast 2025 to 2035, By Distribution Channel
    • Introduction / Key Findings
    • Historical Market Size Value (USD Billion) & Volume (Million Units) Analysis By Distribution Channel, 2020 to 2024
    • Current and Future Market Size Value (USD Billion) & Volume (Million Units) Analysis and Forecast By Distribution Channel, 2025 to 2035
      • Supermarkets and Hypermarkets
      • Convenience Stores and Drugstores
      • Specialty Baby Stores
      • Online Retail
      • Direct-to-Consumer
      • Others
    • Y-o-Y Growth Trend Analysis By Distribution Channel, 2020 to 2024
    • Absolute $ Opportunity Analysis By Distribution Channel, 2025 to 2035
  9. Global Market Analysis 2020 to 2024 and Forecast 2025 to 2035, By Region
    • Introduction
    • Historical Market Size Value (USD Billion) & Volume (Million Units) Analysis By Region, 2020 to 2024
    • Current Market Size Value (USD Billion) & Volume (Million Units) Analysis and Forecast By Region, 2025 to 2035
      • North America
      • Latin America
      • Western Europe
      • Eastern Europe
      • East Asia
      • South Asia & Pacific
      • Middle East and Africa
    • Market Attractiveness Analysis By Region
  10. North America Market Analysis 2020 to 2024 and Forecast 2025 to 2035, By Country
    • Historical Market Size Value (USD Billion) & Volume (Million Units) Trend Analysis By Market Taxonomy, 2020 to 2024
    • Market Size Value (USD Billion) & Volume (Million Units) Forecast By Market Taxonomy, 2025 to 2035
      • By Country
        • USA
        • Canada
        • Mexico
      • By Product Type
      • By Ingredient Type
      • By Distribution Channel
    • Market Attractiveness Analysis
      • By Country
      • By Product Type
      • By Ingredient Type
      • By Distribution Channel
    • Key Takeaways
  11. Latin America Market Analysis 2020 to 2024 and Forecast 2025 to 2035, By Country
    • Historical Market Size Value (USD Billion) & Volume (Million Units) Trend Analysis By Market Taxonomy, 2020 to 2024
    • Market Size Value (USD Billion) & Volume (Million Units) Forecast By Market Taxonomy, 2025 to 2035
      • By Country
        • Brazil
        • Argentina
        • Rest of LATAM
      • By Product Type
      • By Ingredient Type
      • By Distribution Channel
    • Market Attractiveness Analysis
      • By Country
      • By Product Type
      • By Ingredient Type
      • By Distribution Channel
    • Key Takeaways
  12. Western Europe Market Analysis 2020 to 2024 and Forecast 2025 to 2035, By Country
    • Historical Market Size Value (USD Billion) & Volume (Million Units) Trend Analysis By Market Taxonomy, 2020 to 2024
    • Market Size Value (USD Billion) & Volume (Million Units) Forecast By Market Taxonomy, 2025 to 2035
      • By Country
        • Germany
        • Italy
        • France
        • UK
        • Spain
        • BENELUX
        • Nordic
        • Rest of W. Europe
      • By Product Type
      • By Ingredient Type
      • By Distribution Channel
    • Market Attractiveness Analysis
      • By Country
      • By Product Type
      • By Ingredient Type
      • By Distribution Channel
    • Key Takeaways
  13. Eastern Europe Market Analysis 2020 to 2024 and Forecast 2025 to 2035, By Country
    • Historical Market Size Value (USD Billion) & Volume (Million Units) Trend Analysis By Market Taxonomy, 2020 to 2024
    • Market Size Value (USD Billion) & Volume (Million Units) Forecast By Market Taxonomy, 2025 to 2035
      • By Country
        • Russia
        • Hungary
        • Poland
        • Balkan & Baltics
        • Rest of E. Europe
      • By Product Type
      • By Ingredient Type
      • By Distribution Channel
    • Market Attractiveness Analysis
      • By Country
      • By Product Type
      • By Ingredient Type
      • By Distribution Channel
    • Key Takeaways
  14. East Asia Market Analysis 2020 to 2024 and Forecast 2025 to 2035, By Country
    • Historical Market Size Value (USD Billion) & Volume (Million Units) Trend Analysis By Market Taxonomy, 2020 to 2024
    • Market Size Value (USD Billion) & Volume (Million Units) Forecast By Market Taxonomy, 2025 to 2035
      • By Country
        • China
        • Japan
        • South Korea
      • By Product Type
      • By Ingredient Type
      • By Distribution Channel
    • Market Attractiveness Analysis
      • By Country
      • By Product Type
      • By Ingredient Type
      • By Distribution Channel
    • Key Takeaways
  15. South Asia & Pacific Market Analysis 2020 to 2024 and Forecast 2025 to 2035, By Country
    • Historical Market Size Value (USD Billion) & Volume (Million Units) Trend Analysis By Market Taxonomy, 2020 to 2024
    • Market Size Value (USD Billion) & Volume (Million Units) Forecast By Market Taxonomy, 2025 to 2035
      • By Country
        • India
        • Australia & New Zealand
        • ASEAN
        • Rest of SAP
      • By Product Type
      • By Ingredient Type
      • By Distribution Channel
    • Market Attractiveness Analysis
      • By Country
      • By Product Type
      • By Ingredient Type
      • By Distribution Channel
    • Key Takeaways
  16. Middle East and Africa Market Analysis 2020 to 2024 and Forecast 2025 to 2035, By Country
    • Historical Market Size Value (USD Billion) & Volume (Million Units) Trend Analysis By Market Taxonomy, 2020 to 2024
    • Market Size Value (USD Billion) & Volume (Million Units) Forecast By Market Taxonomy, 2025 to 2035
      • By Country
        • GCC Countries
        • Northern Africa
        • South Africa
        • Turkiye
        • Rest of MEA
      • By Product Type
      • By Ingredient Type
      • By Distribution Channel
    • Market Attractiveness Analysis
      • By Country
      • By Product Type
      • By Ingredient Type
      • By Distribution Channel
    • Key Takeaways
  17. Key Countries Market Analysis
    • USA
      • Pricing Analysis
      • Market Share Analysis, 2024
        • By Product Type
        • By Ingredient Type
        • By Distribution Channel
    • Canada
      • Pricing Analysis
      • Market Share Analysis, 2024
        • By Product Type
        • By Ingredient Type
        • By Distribution Channel
    • Brazil
      • Pricing Analysis
      • Market Share Analysis, 2024
        • By Product Type
        • By Ingredient Type
        • By Distribution Channel
    • Mexico
      • Pricing Analysis
      • Market Share Analysis, 2024
        • By Product Type
        • By Ingredient Type
        • By Distribution Channel
    • Argentina
      • Pricing Analysis
      • Market Share Analysis, 2024
        • By Product Type
        • By Ingredient Type
        • By Distribution Channel
  18. Market Structure Analysis
    • Competition Dashboard
    • Competition Benchmarking
    • Market Share Analysis of Top Players
      • By Regional
      • By Product Type
      • By Ingredient Type
      • By Distribution Channel
  19. Competition Analysis
    • Competition Deep Dive
      • Abbott Laboratories
        • Overview
        • Product Portfolio
        • Profitability by Market Segments (Product/Age /Sales Channel/Region)
        • Sales Footprint
        • Strategy Overview
          • Marketing Strategy
          • Product Strategy
          • Channel Strategy
      • Amara Organic Foods
        • Overview
        • Product Portfolio
        • Profitability by Market Segments (Product/Age /Sales Channel/Region)
        • Sales Footprint
        • Strategy Overview
          • Marketing Strategy
          • Product Strategy
          • Channel Strategy
      • Danone S.A. (Happy Baby Organics)
        • Overview
        • Product Portfolio
        • Profitability by Market Segments (Product/Age /Sales Channel/Region)
        • Sales Footprint
        • Strategy Overview
          • Marketing Strategy
          • Product Strategy
          • Channel Strategy
      • Ella's Kitchen
        • Overview
        • Product Portfolio
        • Profitability by Market Segments (Product/Age /Sales Channel/Region)
        • Sales Footprint
        • Strategy Overview
          • Marketing Strategy
          • Product Strategy
          • Channel Strategy
      • Hain Celestial Group (Earth's Best)
        • Overview
        • Product Portfolio
        • Profitability by Market Segments (Product/Age /Sales Channel/Region)
        • Sales Footprint
        • Strategy Overview
          • Marketing Strategy
          • Product Strategy
          • Channel Strategy
      • Hero Group (Beech-Nut)
        • Overview
        • Product Portfolio
        • Profitability by Market Segments (Product/Age /Sales Channel/Region)
        • Sales Footprint
        • Strategy Overview
          • Marketing Strategy
          • Product Strategy
          • Channel Strategy
      • Kewpie Corporation
        • Overview
        • Product Portfolio
        • Profitability by Market Segments (Product/Age /Sales Channel/Region)
        • Sales Footprint
        • Strategy Overview
          • Marketing Strategy
          • Product Strategy
          • Channel Strategy
      • Little Bellies
        • Overview
        • Product Portfolio
        • Profitability by Market Segments (Product/Age /Sales Channel/Region)
        • Sales Footprint
        • Strategy Overview
          • Marketing Strategy
          • Product Strategy
          • Channel Strategy
      • Little Freddie
        • Overview
        • Product Portfolio
        • Profitability by Market Segments (Product/Age /Sales Channel/Region)
        • Sales Footprint
        • Strategy Overview
          • Marketing Strategy
          • Product Strategy
          • Channel Strategy
      • Nestlé S.A. (Gerber)
        • Overview
        • Product Portfolio
        • Profitability by Market Segments (Product/Age /Sales Channel/Region)
        • Sales Footprint
        • Strategy Overview
          • Marketing Strategy
          • Product Strategy
          • Channel Strategy
      • Plum Organics (Campbell Soup Company)
        • Overview
        • Product Portfolio
        • Profitability by Market Segments (Product/Age /Sales Channel/Region)
        • Sales Footprint
        • Strategy Overview
          • Marketing Strategy
          • Product Strategy
          • Channel Strategy
      • Serenity Kids
        • Overview
        • Product Portfolio
        • Profitability by Market Segments (Product/Age /Sales Channel/Region)
        • Sales Footprint
        • Strategy Overview
          • Marketing Strategy
          • Product Strategy
          • Channel Strategy
      • Sprout Foods, Inc.
        • Overview
        • Product Portfolio
        • Profitability by Market Segments (Product/Age /Sales Channel/Region)
        • Sales Footprint
        • Strategy Overview
          • Marketing Strategy
          • Product Strategy
          • Channel Strategy
      • The Kraft Heinz Company
        • Overview
        • Product Portfolio
        • Profitability by Market Segments (Product/Age /Sales Channel/Region)
        • Sales Footprint
        • Strategy Overview
          • Marketing Strategy
          • Product Strategy
          • Channel Strategy
  20. Assumptions & Acronyms Used
  21. Research Methodology

List of Tables

  • Table 1: Global Market Value (USD Billion) Forecast by Region, 2020 to 2035
  • Table 2: Global Market Volume (Million Units) Forecast by Region, 2020 to 2035
  • Table 3: Global Market Value (USD Billion) Forecast by Product Type, 2020 to 2035
  • Table 4: Global Market Volume (Million Units) Forecast by Product Type, 2020 to 2035
  • Table 5: Global Market Value (USD Billion) Forecast by Ingredient Type, 2020 to 2035
  • Table 6: Global Market Volume (Million Units) Forecast by Ingredient Type, 2020 to 2035
  • Table 7: Global Market Value (USD Billion) Forecast by Distribution Channel, 2020 to 2035
  • Table 8: Global Market Volume (Million Units) Forecast by Distribution Channel, 2020 to 2035
  • Table 9: North America Market Value (USD Billion) Forecast by Country, 2020 to 2035
  • Table 10: North America Market Volume (Million Units) Forecast by Country, 2020 to 2035
  • Table 11: North America Market Value (USD Billion) Forecast by Product Type, 2020 to 2035
  • Table 12: North America Market Volume (Million Units) Forecast by Product Type, 2020 to 2035
  • Table 13: North America Market Value (USD Billion) Forecast by Ingredient Type, 2020 to 2035
  • Table 14: North America Market Volume (Million Units) Forecast by Ingredient Type, 2020 to 2035
  • Table 15: North America Market Value (USD Billion) Forecast by Distribution Channel, 2020 to 2035
  • Table 16: North America Market Volume (Million Units) Forecast by Distribution Channel, 2020 to 2035
  • Table 17: Latin America Market Value (USD Billion) Forecast by Country, 2020 to 2035
  • Table 18: Latin America Market Volume (Million Units) Forecast by Country, 2020 to 2035
  • Table 19: Latin America Market Value (USD Billion) Forecast by Product Type, 2020 to 2035
  • Table 20: Latin America Market Volume (Million Units) Forecast by Product Type, 2020 to 2035
  • Table 21: Latin America Market Value (USD Billion) Forecast by Ingredient Type, 2020 to 2035
  • Table 22: Latin America Market Volume (Million Units) Forecast by Ingredient Type, 2020 to 2035
  • Table 23: Latin America Market Value (USD Billion) Forecast by Distribution Channel, 2020 to 2035
  • Table 24: Latin America Market Volume (Million Units) Forecast by Distribution Channel, 2020 to 2035
  • Table 25: Western Europe Market Value (USD Billion) Forecast by Country, 2020 to 2035
  • Table 26: Western Europe Market Volume (Million Units) Forecast by Country, 2020 to 2035
  • Table 27: Western Europe Market Value (USD Billion) Forecast by Product Type, 2020 to 2035
  • Table 28: Western Europe Market Volume (Million Units) Forecast by Product Type, 2020 to 2035
  • Table 29: Western Europe Market Value (USD Billion) Forecast by Ingredient Type, 2020 to 2035
  • Table 30: Western Europe Market Volume (Million Units) Forecast by Ingredient Type, 2020 to 2035
  • Table 31: Western Europe Market Value (USD Billion) Forecast by Distribution Channel, 2020 to 2035
  • Table 32: Western Europe Market Volume (Million Units) Forecast by Distribution Channel, 2020 to 2035
  • Table 33: Eastern Europe Market Value (USD Billion) Forecast by Country, 2020 to 2035
  • Table 34: Eastern Europe Market Volume (Million Units) Forecast by Country, 2020 to 2035
  • Table 35: Eastern Europe Market Value (USD Billion) Forecast by Product Type, 2020 to 2035
  • Table 36: Eastern Europe Market Volume (Million Units) Forecast by Product Type, 2020 to 2035
  • Table 37: Eastern Europe Market Value (USD Billion) Forecast by Ingredient Type, 2020 to 2035
  • Table 38: Eastern Europe Market Volume (Million Units) Forecast by Ingredient Type, 2020 to 2035
  • Table 39: Eastern Europe Market Value (USD Billion) Forecast by Distribution Channel, 2020 to 2035
  • Table 40: Eastern Europe Market Volume (Million Units) Forecast by Distribution Channel, 2020 to 2035
  • Table 41: East Asia Market Value (USD Billion) Forecast by Country, 2020 to 2035
  • Table 42: East Asia Market Volume (Million Units) Forecast by Country, 2020 to 2035
  • Table 43: East Asia Market Value (USD Billion) Forecast by Product Type, 2020 to 2035
  • Table 44: East Asia Market Volume (Million Units) Forecast by Product Type, 2020 to 2035
  • Table 45: East Asia Market Value (USD Billion) Forecast by Ingredient Type, 2020 to 2035
  • Table 46: East Asia Market Volume (Million Units) Forecast by Ingredient Type, 2020 to 2035
  • Table 47: East Asia Market Value (USD Billion) Forecast by Distribution Channel, 2020 to 2035
  • Table 48: East Asia Market Volume (Million Units) Forecast by Distribution Channel, 2020 to 2035
  • Table 49: South Asia & Pacific Market Value (USD Billion) Forecast by Country, 2020 to 2035
  • Table 50: South Asia & Pacific Market Volume (Million Units) Forecast by Country, 2020 to 2035
  • Table 51: South Asia & Pacific Market Value (USD Billion) Forecast by Product Type, 2020 to 2035
  • Table 52: South Asia & Pacific Market Volume (Million Units) Forecast by Product Type, 2020 to 2035
  • Table 53: South Asia & Pacific Market Value (USD Billion) Forecast by Ingredient Type, 2020 to 2035
  • Table 54: South Asia & Pacific Market Volume (Million Units) Forecast by Ingredient Type, 2020 to 2035
  • Table 55: South Asia & Pacific Market Value (USD Billion) Forecast by Distribution Channel, 2020 to 2035
  • Table 56: South Asia & Pacific Market Volume (Million Units) Forecast by Distribution Channel, 2020 to 2035
  • Table 57: Middle East and Africa Market Value (USD Billion) Forecast by Country, 2020 to 2035
  • Table 58: Middle East and Africa Market Volume (Million Units) Forecast by Country, 2020 to 2035
  • Table 59: Middle East and Africa Market Value (USD Billion) Forecast by Product Type, 2020 to 2035
  • Table 60: Middle East and Africa Market Volume (Million Units) Forecast by Product Type, 2020 to 2035
  • Table 61: Middle East and Africa Market Value (USD Billion) Forecast by Ingredient Type, 2020 to 2035
  • Table 62: Middle East and Africa Market Volume (Million Units) Forecast by Ingredient Type, 2020 to 2035
  • Table 63: Middle East and Africa Market Value (USD Billion) Forecast by Distribution Channel, 2020 to 2035
  • Table 64: Middle East and Africa Market Volume (Million Units) Forecast by Distribution Channel, 2020 to 2035

List of Figures

  • Figure 1: Global Market Volume (Million Units) Forecast 2020 to 2035
  • Figure 2: Global Market Pricing Analysis
  • Figure 3: Global Market Value (USD Billion) Forecast 2020 to 2035
  • Figure 4: Global Market Value Share and BPS Analysis by Product Type, 2025 and 2035
  • Figure 5: Global Market Y-o-Y Growth Comparison by Product Type, 2025 to 2035
  • Figure 6: Global Market Attractiveness Analysis by Product Type
  • Figure 7: Global Market Value Share and BPS Analysis by Ingredient Type, 2025 and 2035
  • Figure 8: Global Market Y-o-Y Growth Comparison by Ingredient Type, 2025 to 2035
  • Figure 9: Global Market Attractiveness Analysis by Ingredient Type
  • Figure 10: Global Market Value Share and BPS Analysis by Distribution Channel, 2025 and 2035
  • Figure 11: Global Market Y-o-Y Growth Comparison by Distribution Channel, 2025 to 2035
  • Figure 12: Global Market Attractiveness Analysis by Distribution Channel
  • Figure 13: Global Market Value (USD Billion) Share and BPS Analysis by Region, 2025 and 2035
  • Figure 14: Global Market Y-o-Y Growth Comparison by Region, 2025 to 2035
  • Figure 15: Global Market Attractiveness Analysis by Region
  • Figure 16: North America Market Incremental $ Opportunity, 2025 to 2035
  • Figure 17: Latin America Market Incremental $ Opportunity, 2025 to 2035
  • Figure 18: Western Europe Market Incremental $ Opportunity, 2025 to 2035
  • Figure 19: Eastern Europe Market Incremental $ Opportunity, 2025 to 2035
  • Figure 20: East Asia Market Incremental $ Opportunity, 2025 to 2035
  • Figure 21: South Asia & Pacific Market Incremental $ Opportunity, 2025 to 2035
  • Figure 22: Middle East and Africa Market Incremental $ Opportunity, 2025 to 2035
  • Figure 23: North America Market Value Share and BPS Analysis by Country, 2025 and 2035
  • Figure 24: North America Market Value Share and BPS Analysis by Product Type, 2025 and 2035
  • Figure 25: North America Market Y-o-Y Growth Comparison by Product Type, 2025 to 2035
  • Figure 26: North America Market Attractiveness Analysis by Product Type
  • Figure 27: North America Market Value Share and BPS Analysis by Ingredient Type, 2025 and 2035
  • Figure 28: North America Market Y-o-Y Growth Comparison by Ingredient Type, 2025 to 2035
  • Figure 29: North America Market Attractiveness Analysis by Ingredient Type
  • Figure 30: North America Market Value Share and BPS Analysis by Distribution Channel, 2025 and 2035
  • Figure 31: North America Market Y-o-Y Growth Comparison by Distribution Channel, 2025 to 2035
  • Figure 32: North America Market Attractiveness Analysis by Distribution Channel
  • Figure 33: Latin America Market Value Share and BPS Analysis by Country, 2025 and 2035
  • Figure 34: Latin America Market Value Share and BPS Analysis by Product Type, 2025 and 2035
  • Figure 35: Latin America Market Y-o-Y Growth Comparison by Product Type, 2025 to 2035
  • Figure 36: Latin America Market Attractiveness Analysis by Product Type
  • Figure 37: Latin America Market Value Share and BPS Analysis by Ingredient Type, 2025 and 2035
  • Figure 38: Latin America Market Y-o-Y Growth Comparison by Ingredient Type, 2025 to 2035
  • Figure 39: Latin America Market Attractiveness Analysis by Ingredient Type
  • Figure 40: Latin America Market Value Share and BPS Analysis by Distribution Channel, 2025 and 2035
  • Figure 41: Latin America Market Y-o-Y Growth Comparison by Distribution Channel, 2025 to 2035
  • Figure 42: Latin America Market Attractiveness Analysis by Distribution Channel
  • Figure 43: Western Europe Market Value Share and BPS Analysis by Country, 2025 and 2035
  • Figure 44: Western Europe Market Value Share and BPS Analysis by Product Type, 2025 and 2035
  • Figure 45: Western Europe Market Y-o-Y Growth Comparison by Product Type, 2025 to 2035
  • Figure 46: Western Europe Market Attractiveness Analysis by Product Type
  • Figure 47: Western Europe Market Value Share and BPS Analysis by Ingredient Type, 2025 and 2035
  • Figure 48: Western Europe Market Y-o-Y Growth Comparison by Ingredient Type, 2025 to 2035
  • Figure 49: Western Europe Market Attractiveness Analysis by Ingredient Type
  • Figure 50: Western Europe Market Value Share and BPS Analysis by Distribution Channel, 2025 and 2035
  • Figure 51: Western Europe Market Y-o-Y Growth Comparison by Distribution Channel, 2025 to 2035
  • Figure 52: Western Europe Market Attractiveness Analysis by Distribution Channel
  • Figure 53: Eastern Europe Market Value Share and BPS Analysis by Country, 2025 and 2035
  • Figure 54: Eastern Europe Market Value Share and BPS Analysis by Product Type, 2025 and 2035
  • Figure 55: Eastern Europe Market Y-o-Y Growth Comparison by Product Type, 2025 to 2035
  • Figure 56: Eastern Europe Market Attractiveness Analysis by Product Type
  • Figure 57: Eastern Europe Market Value Share and BPS Analysis by Ingredient Type, 2025 and 2035
  • Figure 58: Eastern Europe Market Y-o-Y Growth Comparison by Ingredient Type, 2025 to 2035
  • Figure 59: Eastern Europe Market Attractiveness Analysis by Ingredient Type
  • Figure 60: Eastern Europe Market Value Share and BPS Analysis by Distribution Channel, 2025 and 2035
  • Figure 61: Eastern Europe Market Y-o-Y Growth Comparison by Distribution Channel, 2025 to 2035
  • Figure 62: Eastern Europe Market Attractiveness Analysis by Distribution Channel
  • Figure 63: East Asia Market Value Share and BPS Analysis by Country, 2025 and 2035
  • Figure 64: East Asia Market Value Share and BPS Analysis by Product Type, 2025 and 2035
  • Figure 65: East Asia Market Y-o-Y Growth Comparison by Product Type, 2025 to 2035
  • Figure 66: East Asia Market Attractiveness Analysis by Product Type
  • Figure 67: East Asia Market Value Share and BPS Analysis by Ingredient Type, 2025 and 2035
  • Figure 68: East Asia Market Y-o-Y Growth Comparison by Ingredient Type, 2025 to 2035
  • Figure 69: East Asia Market Attractiveness Analysis by Ingredient Type
  • Figure 70: East Asia Market Value Share and BPS Analysis by Distribution Channel, 2025 and 2035
  • Figure 71: East Asia Market Y-o-Y Growth Comparison by Distribution Channel, 2025 to 2035
  • Figure 72: East Asia Market Attractiveness Analysis by Distribution Channel
  • Figure 73: South Asia & Pacific Market Value Share and BPS Analysis by Country, 2025 and 2035
  • Figure 74: South Asia & Pacific Market Value Share and BPS Analysis by Product Type, 2025 and 2035
  • Figure 75: South Asia & Pacific Market Y-o-Y Growth Comparison by Product Type, 2025 to 2035
  • Figure 76: South Asia & Pacific Market Attractiveness Analysis by Product Type
  • Figure 77: South Asia & Pacific Market Value Share and BPS Analysis by Ingredient Type, 2025 and 2035
  • Figure 78: South Asia & Pacific Market Y-o-Y Growth Comparison by Ingredient Type, 2025 to 2035
  • Figure 79: South Asia & Pacific Market Attractiveness Analysis by Ingredient Type
  • Figure 80: South Asia & Pacific Market Value Share and BPS Analysis by Distribution Channel, 2025 and 2035
  • Figure 81: South Asia & Pacific Market Y-o-Y Growth Comparison by Distribution Channel, 2025 to 2035
  • Figure 82: South Asia & Pacific Market Attractiveness Analysis by Distribution Channel
  • Figure 83: Middle East and Africa Market Value Share and BPS Analysis by Country, 2025 and 2035
  • Figure 84: Middle East and Africa Market Value Share and BPS Analysis by Product Type, 2025 and 2035
  • Figure 85: Middle East and Africa Market Y-o-Y Growth Comparison by Product Type, 2025 to 2035
  • Figure 86: Middle East and Africa Market Attractiveness Analysis by Product Type
  • Figure 87: Middle East and Africa Market Value Share and BPS Analysis by Ingredient Type, 2025 and 2035
  • Figure 88: Middle East and Africa Market Y-o-Y Growth Comparison by Ingredient Type, 2025 to 2035
  • Figure 89: Middle East and Africa Market Attractiveness Analysis by Ingredient Type
  • Figure 90: Middle East and Africa Market Value Share and BPS Analysis by Distribution Channel, 2025 and 2035
  • Figure 91: Middle East and Africa Market Y-o-Y Growth Comparison by Distribution Channel, 2025 to 2035
  • Figure 92: Middle East and Africa Market Attractiveness Analysis by Distribution Channel
  • Figure 93: Global Market - Tier Structure Analysis
  • Figure 94: Global Market - Company Share Analysis

Frequently Asked Questions

What is the estimated size of the baby snacks market in 2025?

The industry is projected to be valued at USD 14.9 billion in 2025.

What is the expected size of the baby snacks market by 2035?

The industry is forecast to reach USD 25.2 billion by 2035.

What is the projected CAGR for the baby snacks market from 2025 to 2035?

The industry is expected to grow at a CAGR of 6% during the forecast period.

Which product type dominates the baby snacks market in 2025?

Vegetable-based snacks lead the industry with a 57% share in 2025.

Who is the leading company in the baby snacks market and what is its industry share?

Nestlé S.A. (Gerber) is the leading player in the industry, holding an 11% industry share.

Explore Similar Insights

Future Market Insights

Baby Snacks Market