Baby Toddler Bar Market Size and Share Forecast Outlook 2025 to 2035

The global baby toddler bar market is estimated at USD 7.3 billion in 2025 and is projected to grow to USD 10.9 billion by 2035, at a CAGR of 4.2%. Production of baby toddler bars is being refined toward vegetable based and protein fortified bars that are believed to support early development and satiation. Brands investing in age appropriate texture design, portioned packaging, and natural sweeteners will outperform legacy snack makers.
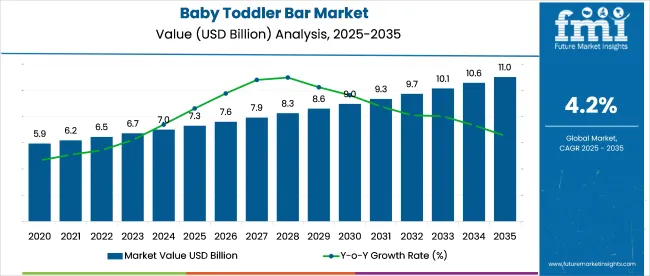
Quick Stats of the Baby Toddler Bar Market

  • Industry Size (2025): USD 7.3 billion
  • Industry Value (2035): USD 10.9 billion
  • Forecast CAGR (2025 to 2035): 4.2%
  • Leading Segment: Organic Baby Toddler Bars (42.1%)
  • Key Growth Region: South Asia (India)
  • Key Players: The Kraft Heinz Company, Nestlé, The Hain Celestial Group, Hero Group, Danone

Baby Toddler Bar Market

Baby toddler bars hold a significant position in parent markets. In the baby food market, it accounts for approximately 3-5%, as toddler bars represent a small but growing segment of food products for young children. In the broader snacks market, the share is around 1-2%, as baby toddler bars cater specifically to children and are a niche within the general snack industry.

In the functional foods market, the share is about 2-3%, driven by the growing demand for functional foods designed to support health, growth, and development in young children. In the organic food market, its share is approximately 2-4%, as organic toddler bars appeal to health-conscious parents. In the health and wellness market, the share is around 1-2%, with an increasing focus on nutritious and balanced snack options for children.

In August 2024, Mark Teperson, CEO of Baby Bunting, commented on the company’s strategic shift amid a challenging retail environment in the baby products sector. While not focused exclusively on toddler bars, he reflects on broader trends in the baby nutrition and snack category. Baby Bunting’s turnaround strategy has included product innovation, streamlined pricing, and expansion efforts to enhance competitiveness and consumer reach.

Analyzing Baby Toddler Bar Market by Top Investment Segments

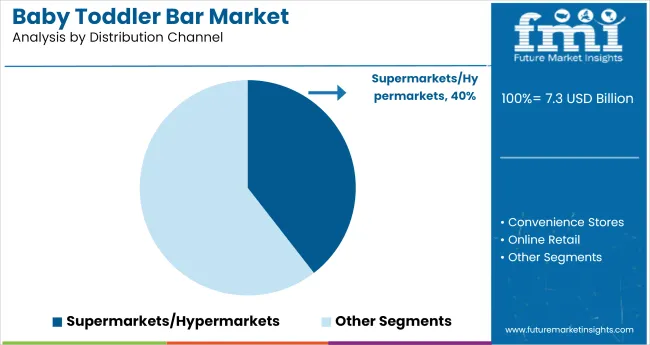
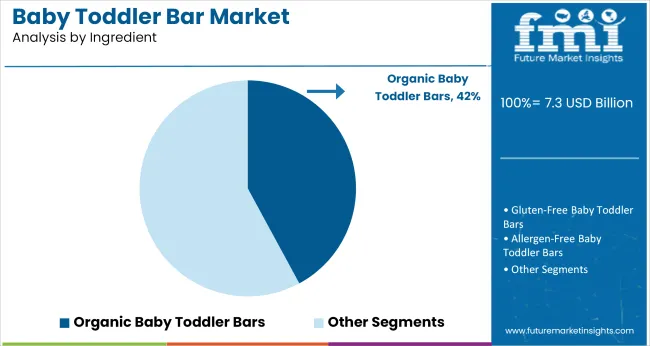
The industry is projected to grow with fruit-based bars leading the product segment at 34.7%. Supermarkets/hypermarkets will dominate distribution channels at 39.5%, and organic bars will hold the largest share in the ingredient segment with 42.1%.
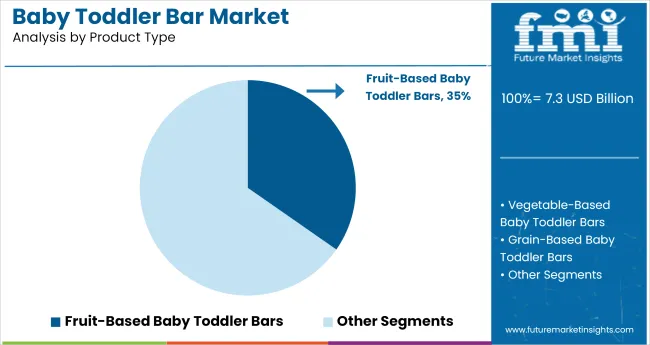
Fruit-based baby toddler bars lead product type with 34.7% industry share

Baby Toddler Bar Market Analysis By Product Type

Fruit-based baby toddler bars are expected to dominate the industry, accounting for 34.7% of the industry share in 2025. These bars are highly favored for their natural taste, nutritional content, and appeal to both parents and toddlers. The inclusion of fruits, such as apple, banana, and berries, provides essential vitamins and minerals while ensuring a convenient snack for toddlers. As consumers increasingly seek healthy, tasty alternatives to traditional snack foods, fruit-based toddler bars are poised to remain the preferred choice in the industry, especially in regions where natural, wholesome ingredients are prioritized.
  • Natural taste and nutritional content make fruit-based bars appealing to parents and toddlers
  • Rich in essential vitamins and minerals, supporting toddler health and development
  • Growing demand for healthy snack alternatives positions fruit-based bars as industry leaders

Supermarkets/Hypermarkets lead distribution channel with 39.5% industry share

Baby Toddler Bar Market Analysis By Distribution Channel

Supermarkets and hypermarkets are projected to hold 39.5% of the industry share in 2025. These retail giants offer a wide range of baby toddler bars, providing easy access for parents looking for convenient, nutritious snacks for their children. The availability of both branded and private-label products in supermarkets makes it the primary distribution channel, attracting a broad consumer base. The organized retail space also benefits from effective promotional campaigns, in-store displays, and frequent sales events, which further drive the demand for toddler bars in these outlets.
  • Supermarkets and hypermarkets provide easy access and a broad range of toddler bars
  • Both branded and private-label options attract diverse consumer segments
  • In-store promotions and sales events drive increased demand and industry visibility

Organic baby toddler bars dominate ingredient segment with 42.1% industry share

Baby Toddler Bar Market Analysis By Ingredient

Organic baby toddler bars are expected to capture 42.1% of the ingredient segment industry share in 2025. As health-conscious parents seek cleaner, non-GMO options, organic bars are gaining significant traction. These bars are made with organic, sustainably sourced ingredients, including fruits, whole grains, and plant-based proteins, providing a healthy, safe snack for toddlers. The rising awareness of the benefits of organic diets, combined with increasing concerns over food additives and pesticides, is pushing organic toddler bars to the forefront of the industry.

  • Organic ingredients appeal to health-conscious parents seeking non-GMO, clean-label products
  • Made with sustainably sourced, safe ingredients that meet parent concerns about additives and pesticides
  • Rising demand for organic food choices supports the continued growth of organic toddler bars

Top Baby Toddler Bar Market Dynamics

The industry is growing due to rising demand for convenient, nutritious snacks that support early childhood development. However, high price points and limited availability in developing regions are hindering industry expansion, particularly in lower-income and rural areas.

Rising Demand for Convenient and Nutritious Baby Snacks

The industry is expanding due to an increasing demand for convenient, nutritious snack options for young children. Parents are looking for healthy, ready-to-eat snacks that offer essential nutrients to support their child’s growth and development. With busy lifestyles and a growing awareness of the importance of early nutrition, baby toddler bars, made from natural ingredients and fortified with vitamins, are becoming a preferred choice. This shift is propelling the industry forward, as brands cater to the demand for balanced and portable nutrition.

  • Growing demand for convenient and healthy snack options for toddlers.
  • Parents are prioritizing nutritious bars to support children’s early development.
  • Baby toddler bars are becoming a preferred snack due to their portability and nutritional value.

High Price Points and Limited Availability in Developing Markets

Despite growth, the industry faces challenges, particularly from high price points and limited availability in developing regions. Premium ingredients used in toddler bars increase production costs, which can make these products less accessible in lower-income industries. Additionally, the lack of widespread distribution channels, especially in rural and developing areas, further restricts industry reach. These barriers hinder the industry’s expansion potential, particularly in regions with limited purchasing power and infrastructure.
  • High production costs make baby toddler bars expensive in lower-income industries.
  • Limited availability in developing regions due to distribution challenges.
  • Price sensitivity and infrastructure constraints limit market growth in rural areas.

Analyzing Key Countries Producing, Distributing, and Consuming Baby Toddler Bar Products

Country Wise Analysis Of Baby Toddler Bar Market

Countries CAGR (2025 to 2035)
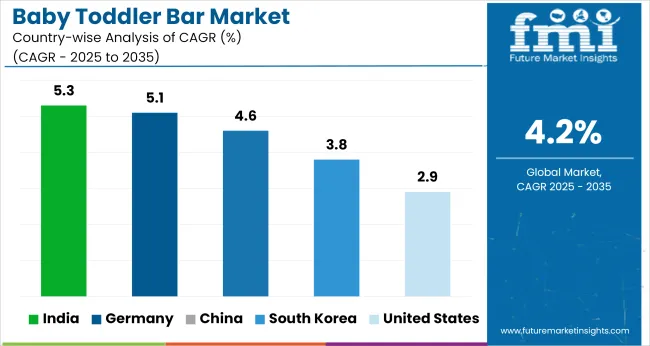
United States 2.9%
India 5.3%
China 4.6%
Germany 5.1%
South Korea 3.8%

Global industry demand is projected to rise at a 4.2% CAGR from 2025 to 2035. Of the five profiled countries out of 40 covered, India leads at 5.3%, followed by Germany at 5.1%, and China at 4.6%, while the United States posts 2.9% and South Korea records 3.8%. These rates translate to a growth premium of +26% for India, +21% for Germany, and +9% for China versus the baseline, while the United States shows slower growth.

Divergence reflects local catalysts: rising health-consciousness and growing demand for convenient and nutritious snacks in India and Germany, while more mature industries like the United States experience slower adoption and limited incremental growth in the baby toddler food sector.

United States Baby Toddler Bar Market Growth Outlook

The industry in the United States is projected to grow at a CAGR of 2.9% from 2025 to 2035. Demand has been shaped by rising interest in toddler-specific nutrition formats that offer convenience and perceived health benefits. Parents are purchasing clean-label, allergen-conscious bars that comply with pediatric dietary guidelines.

Bars enriched with iron, DHA, and fruit-based sweeteners are gaining traction. Shelf space in mass retail has been expanded for toddler-friendly formats. Growth is further supported by WIC-eligible product inclusion and partnerships between pediatricians and brands for trial packs. Promotion strategies targeting working parents through online grocery bundles continue to drive repeat purchases across subscription models.

  • Pediatric dietitians favor bars with DHA and iron for early brain development
  • Direct-to-consumer platforms offer subscription boxes tailored to age and allergies
  • Regulatory compliance with baby food heavy metal limits affects formulation protocols

India Baby Toddler Bar Market Growth Forecast

India’s industry is projected to expand at a CAGR of 5.3% from 2025 to 2035. Demand is rising in metropolitan households seeking convenient and nutritious options for weaning-age children. Millet-based bars, often blended with dates, jaggery, and ghee, are gaining share due to regional ingredient familiarity and digestive benefits.

Pediatricians in urban clinics are recommending fortified snack bars with iron and calcium. D2C brands are launching customized sampler kits for first-time parents. Offline distribution is being strengthened through pharmacies and wellness chains. Government support for child nutrition startups and increased e-commerce access in Tier II cities are expected to accelerate brand penetration and repeat purchases over the next decade.

  • Millet-based bars supported under India's National Nutrition Mission for toddlers
  • Cold-extrusion facilities receive state grants in Karnataka and Maharashtra
  • Pediatricians endorse bars with amla, turmeric, and protein isolates for immune support

China Baby Toddler Bar Market Outlook

Demand is expected to grow at a CAGR of 4.6% between 2025 and 2035. Parents in Tier 1 and Tier 2 cities are shifting from sugary packaged snacks to portioned, nutrient-focused toddler bars. Domestic companies are reformulating rice- and oat-based variants with DHA, lutein, and probiotics, targeting brain and gut development.

E-commerce platforms like JD and Tmall support product sampling and influencer-driven education for young families. Cross-border brands from Japan and South Korea are increasing shelf presence in mother-baby stores. Regulatory clarity from the SAMR is encouraging product standardization, especially around labeling of allergens and nutrient claims, making toddler bars a key segment in early-stage functional food adoption.

  • Imported oat-based toddler bars promoted on Tmall and JD.com
  • Parents in Tier 1 cities prioritize organic labeling and traceability
  • Regulatory certification for children’s foods limits preservatives and added sugars

Germany Baby Toddler Bar Market Growth Outlook

Germany’s industry is projected to expand at a CAGR of 5.1% from 2025 to 2035. Parental preference for organic, additive-free toddler nutrition is reshaping product formulation. Brands are replacing traditional sweeteners with fruit concentrates and incorporating iron, zinc, and B12 for fortified blends.

Regional producers are leveraging EU organic certification to access specialty stores and pharmacy retail chains. Retailers are expanding shelf space for toddler-specific snacks, particularly those free from gluten, dairy, or common allergens. Demand is highest in urban households prioritizing convenience and health. German Food Code (LFGB) regulations are pushing manufacturers to reformulate for minimal processing and maximum transparency.

  • Baby bars with spelt, apple puree, and chia see strong demand in organic chains
  • Federal guidelines promote low-sugar snack options in early childhood
  • Regional manufacturers benefit from subsidies for organic processing conversion

Sales Forecast for Baby Toddler Bar Market in South Korea

South Korea’s industry is anticipated to grow at a CAGR of 3.8% through 2035. Nutritional concerns among new parents are boosting demand for low-sugar, allergen-conscious snack options for toddlers. Locally made bars incorporate traditional grains like glutinous rice and millet, appealing to national dietary habits.

Functional claims around digestion, immunity, and visual development have gained visibility through pediatric clinic tie-ins and maternity hospital promotions. E-commerce channels are dominant, especially via parenting platforms that offer bundled monthly nutrition kits. Industry expansion is supported by MFDS regulations mandating disclosure of food origin, additive content, and nutrient density in toddler-focused packaged goods.
  • KFDA-compliant bars with limited sugar and age-based formulation are gaining traction
  • Pediatric clinics promote snack bars as transition foods during early daycare
  • Premium SKUs use domestic grains and are sold through influencer-led online campaigns

Leading Baby Toddler Bar Market Suppliers

Baby Toddler Bar Market Analysis By Company

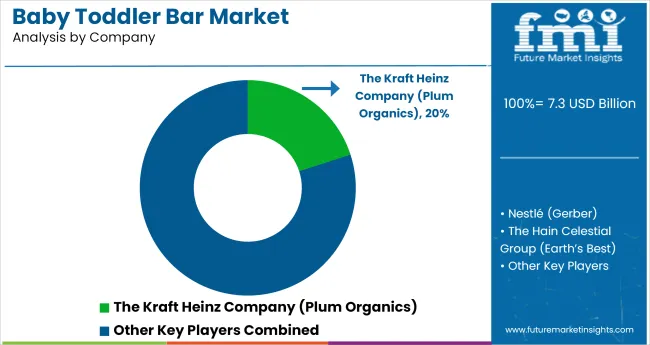
The global industry is led by The Kraft Heinz Company, particularly through its Plum Organics brand, which holds a significant share of approximately 20-25%. Plum Organics offers a variety of organic and nutritious snack options tailored for infants and toddlers, aligning with the growing demand for clean-label and health-conscious products. Their product range includes fruit and veggie bars, providing essential nutrients in convenient formats for busy parents. The brand's commitment to quality and innovation has positioned it as a leader in the industry.

Recent Industry Developments

  • In June 2025, Creative Nature launched its Berry & Beetroot Oatie Snack Bars in Tesco’s free-from aisles across the UK. These toddler-friendly bars are free from the top 14 allergens, offering an inclusive, fruit- and vegetable-based snacking option for sensitive children.
  • In April 2024, Ready® introduced Kids Whole Grain Protein Bars, each containing 6 g of protein, 8 g of whole grains, and 20% less sugar than competing brands. These bars cater to active children, offering a balanced snack option with better nutritional value for on-the-go consumption.

Key Players

  • The Kraft Heinz Company (Plum Organics)
  • Nestlé (Gerber)
  • The Hain Celestial Group (Earth’s Best)
  • Hero Group (Beech-Nut)
  • Danone (Happy Family Organics)

Report Scope

Report Attributes Details
Industry Size (2025) USD 7.3 billion
Industry Value (2035) USD 10.9 billion
Forecast CAGR (2025 to 2035) 4.2%
Base Year for Estimation 2024
Historical Period 2020 to 2024
Projections Period 2025 to 2035
Quantitative Units USD billion for value and million units for volume
Product Type Segmentation Fruit-Based Baby Toddler Bars, Vegetable-Based Baby Toddler Bars, Grain-Based Baby Toddler Bars, Nut-Based Baby Toddler Bars, Mixed Ingredient Baby Toddler Bars
Distribution Channel Segmentation Supermarkets/Hypermarkets, Convenience Stores, Online Retail, Drugstores/Pharmacies, Specialty Stores, Direct Sales
Ingredient Segmentation Organic Baby Toddler Bars, Gluten-Free Baby Toddler Bars, Allergen-Free Baby Toddler Bars, Fortified/Enriched Baby Toddler Bars
Regions Covered North America, Latin America, Eastern Europe, Western Europe, East Asia, South Asia & Pacific, Central Asia, Balkan and Baltic Countries, Russia & Belarus, Middle East & Africa
Countries Covered United States, Canada, Mexico, Brazil, Argentina, Germany, France, United Kingdom, Italy, Spain, Netherlands, China, India, Japan, South Korea, Australia, New Zealand, GCC Countries, South Africa
Key Players Influencing the Industry The Kraft Heinz Company (Plum Organics), Nestlé (Gerber), The Hain Celestial Group (Earth’s Best), Hero Group (Beech-Nut), Danone (Happy Family Organics)
Additional Attributes Dollar sales by product type, distribution channel, and ingredient, increasing demand for organic and allergen-free baby foods, growth in online retail and convenience store channels, rising preference for fortified and nutritious options in baby food, regional trends in baby food consumption and product innovation.

Baby Toddler Bar Market Analyzed by Key Investment Segments

By Product Type:

Product segmentation includes Fruit-Based Baby Toddler Bars, Vegetable-Based Baby Toddler Bars, Grain-Based Baby Toddler Bars, Nut-Based Baby Toddler Bars, and Mixed Ingredient Baby Toddler Bars.

By Distribution Channel:

The distribution landscape comprises Supermarkets/Hypermarkets, Convenience Stores, Online Retail, Drugstores/Pharmacies, and Others such as Specialty Stores and Direct Sales.

By Ingredient:

Ingredient categories include Organic Baby Toddler Bars, Gluten-Free Baby Toddler Bars, Allergen-Free Baby Toddler Bars, and Fortified/Enriched Baby Toddler Bars.

By Region:

Industry analysis has been carried out in key countries of North America, Latin America, Eastern Europe, Western Europe, East Asia, South Asia & Pacific, Central Asia, Balkan and Baltic Countries, Russia & Belarus and the Middle East & Africa.

Table of Content

  1. Executive Summary
    • Global Market Outlook
    • Demand-side Trends
    • Supply-side Trends
    • Technology Roadmap Analysis
    • Analysis and Recommendations
  2. Market Overview
    • Market Coverage / Taxonomy
    • Market Definition / Scope / Limitations
  3. Market Background
    • Market Dynamics
      • Drivers
      • Restraints
      • Opportunity
      • Trends
    • Scenario Forecast
      • Demand in Optimistic Scenario
      • Demand in Likely Scenario
      • Demand in Conservative Scenario
    • Opportunity Map Analysis
    • Product Life Cycle Analysis
    • Supply Chain Analysis
      • Supply Side Participants and their Roles
        • Producers
        • Mid-Level Participants (Traders/ Agents/ Brokers)
        • Wholesalers and Distributors
      • Value Added and Value Created at Node in the Supply Chain
      • List of Raw Material Suppliers
      • List of Existing and Potential Buyer’s
    • Investment Feasibility Matrix
    • Value Chain Analysis
      • Profit Margin Analysis
      • Wholesalers and Distributors
      • Retailers
    • PESTLE and Porter’s Analysis
    • Regulatory Landscape
      • By Key Regions
      • By Key Countries
    • Regional Parent Market Outlook
    • Production and Consumption Statistics
    • Import and Export Statistics
  4. Global Market Analysis 2020 to 2024 and Forecast, 2025 to 2035
    • Historical Market Size Value (USD Billion) & Volume (Million Units) Analysis, 2020 to 2024
    • Current and Future Market Size Value (USD Billion) & Volume (Million Units) Projections, 2025 to 2035
      • Y-o-Y Growth Trend Analysis
      • Absolute $ Opportunity Analysis
  5. Global Market Pricing Analysis 2020 to 2024 and Forecast 2025 to 2035
  6. Global Market Analysis 2020 to 2024 and Forecast 2025 to 2035, By Product Type
    • Introduction / Key Findings
    • Historical Market Size Value (USD Billion) & Volume (Million Units) Analysis By Product Type, 2020 to 2024
    • Current and Future Market Size Value (USD Billion) & Volume (Million Units) Analysis and Forecast By Product Type, 2025 to 2035
      • Fruit-Based Baby Toddler Bars
      • Vegetable-Based Baby Toddler Bars
      • Grain-Based Baby Toddler Bars
      • Nut-Based Baby Toddler Bars
      • Mixed Ingredient Baby Toddler Bars
    • Y-o-Y Growth Trend Analysis By Product Type, 2020 to 2024
    • Absolute $ Opportunity Analysis By Product Type, 2025 to 2035
  7. Global Market Analysis 2020 to 2024 and Forecast 2025 to 2035, By Distribution Channel
    • Introduction / Key Findings
    • Historical Market Size Value (USD Billion) & Volume (Million Units) Analysis By Distribution Channel, 2020 to 2024
    • Current and Future Market Size Value (USD Billion) & Volume (Million Units) Analysis and Forecast By Distribution Channel, 2025 to 2035
      • Supermarkets/Hypermarkets
      • Convenience Stores
      • Online Retail
      • Drugstores/Pharmacies
      • Others (Specialty Stores, Direct Sales)
    • Y-o-Y Growth Trend Analysis By Distribution Channel, 2020 to 2024
    • Absolute $ Opportunity Analysis By Distribution Channel, 2025 to 2035
  8. Global Market Analysis 2020 to 2024 and Forecast 2025 to 2035, By Ingredient
    • Introduction / Key Findings
    • Historical Market Size Value (USD Billion) & Volume (Million Units) Analysis By Ingredient, 2020 to 2024
    • Current and Future Market Size Value (USD Billion) & Volume (Million Units) Analysis and Forecast By Ingredient, 2025 to 2035
      • Organic Baby Toddler Bars
      • Gluten-Free Baby Toddler Bars
      • Allergen-Free Baby Toddler Bars
      • Fortified/Enriched Baby Toddler Bars
    • Y-o-Y Growth Trend Analysis By Ingredient, 2020 to 2024
    • Absolute $ Opportunity Analysis By Ingredient, 2025 to 2035
  9. Global Market Analysis 2020 to 2024 and Forecast 2025 to 2035, By Region
    • Introduction
    • Historical Market Size Value (USD Billion) & Volume (Million Units) Analysis By Region, 2020 to 2024
    • Current Market Size Value (USD Billion) & Volume (Million Units) Analysis and Forecast By Region, 2025 to 2035
      • North America
      • Latin America
      • Western Europe
      • Eastern Europe
      • East Asia
      • South Asia & Pacific
      • Middle East and Africa
    • Market Attractiveness Analysis By Region
  10. North America Market Analysis 2020 to 2024 and Forecast 2025 to 2035, By Country
    • Historical Market Size Value (USD Billion) & Volume (Million Units) Trend Analysis By Market Taxonomy, 2020 to 2024
    • Market Size Value (USD Billion) & Volume (Million Units) Forecast By Market Taxonomy, 2025 to 2035
      • By Country
        • USA
        • Canada
        • Mexico
      • By Product Type
      • By Distribution Channel
      • By Ingredient
    • Market Attractiveness Analysis
      • By Country
      • By Product Type
      • By Distribution Channel
      • By Ingredient
    • Key Takeaways
  11. Latin America Market Analysis 2020 to 2024 and Forecast 2025 to 2035, By Country
    • Historical Market Size Value (USD Billion) & Volume (Million Units) Trend Analysis By Market Taxonomy, 2020 to 2024
    • Market Size Value (USD Billion) & Volume (Million Units) Forecast By Market Taxonomy, 2025 to 2035
      • By Country
        • Brazil
        • Argentina
        • Rest of LATAM
      • By Product Type
      • By Distribution Channel
      • By Ingredient
    • Market Attractiveness Analysis
      • By Country
      • By Product Type
      • By Distribution Channel
      • By Ingredient
    • Key Takeaways
  12. Western Europe Market Analysis 2020 to 2024 and Forecast 2025 to 2035, By Country
    • Historical Market Size Value (USD Billion) & Volume (Million Units) Trend Analysis By Market Taxonomy, 2020 to 2024
    • Market Size Value (USD Billion) & Volume (Million Units) Forecast By Market Taxonomy, 2025 to 2035
      • By Country
        • Germany
        • Italy
        • France
        • UK
        • Spain
        • BENELUX
        • Nordic
        • Rest of W.Europe
      • By Product Type
      • By Distribution Channel
      • By Ingredient
    • Market Attractiveness Analysis
      • By Country
      • By Product Type
      • By Distribution Channel
      • By Ingredient
    • Key Takeaways
  13. Eastern Europe Market Analysis 2020 to 2024 and Forecast 2025 to 2035, By Country
    • Historical Market Size Value (USD Billion) & Volume (Million Units) Trend Analysis By Market Taxonomy, 2020 to 2024
    • Market Size Value (USD Billion) & Volume (Million Units) Forecast By Market Taxonomy, 2025 to 2035
      • By Country
        • Russia
        • Hungary
        • Poland
        • Balkan & Baltics
        • Rest of E. Europe
      • By Product Type
      • By Distribution Channel
      • By Ingredient
    • Market Attractiveness Analysis
      • By Country
      • By Product Type
      • By Distribution Channel
      • By Ingredient
    • Key Takeaways
  14. East Asia Market Analysis 2020 to 2024 and Forecast 2025 to 2035, By Country
    • Historical Market Size Value (USD Billion) & Volume (Million Units) Trend Analysis By Market Taxonomy, 2020 to 2024
    • Market Size Value (USD Billion) & Volume (Million Units) Forecast By Market Taxonomy, 2025 to 2035
      • By Country
        • China
        • Japan
        • South Korea
      • By Product Type
      • By Distribution Channel
      • By Ingredient
    • Market Attractiveness Analysis
      • By Country
      • By Product Type
      • By Distribution Channel
      • By Ingredient
    • Key Takeaways
  15. South Asia & Pacific Market Analysis 2020 to 2024 and Forecast 2025 to 2035, By Country
    • Historical Market Size Value (USD Billion) & Volume (Million Units) Trend Analysis By Market Taxonomy, 2020 to 2024
    • Market Size Value (USD Billion) & Volume (Million Units) Forecast By Market Taxonomy, 2025 to 2035
      • By Country
        • India
        • Australia & New Zealand
        • ASEAN
        • Rest of SAP
      • By Product Type
      • By Distribution Channel
      • By Ingredient
    • Market Attractiveness Analysis
      • By Country
      • By Product Type
      • By Distribution Channel
      • By Ingredient
    • Key Takeaways
  16. Middle East and Africa Market Analysis 2020 to 2024 and Forecast 2025 to 2035, By Country
    • Historical Market Size Value (USD Billion) & Volume (Million Units) Trend Analysis By Market Taxonomy, 2020 to 2024
    • Market Size Value (USD Billion) & Volume (Million Units) Forecast By Market Taxonomy, 2025 to 2035
      • By Country
        • GCC Countries
        • Northern Africa
        • South Africa
        • Turkiye
        • Rest of MEA
      • By Product Type
      • By Distribution Channel
      • By Ingredient
    • Market Attractiveness Analysis
      • By Country
      • By Product Type
      • By Distribution Channel
      • By Ingredient
    • Key Takeaways
  17. Key Countries Market Analysis
    • USA
      • Pricing Analysis
      • Market Share Analysis, 2024
        • By Product Type
        • By Distribution Channel
        • By Ingredient
    • Canada
      • Pricing Analysis
      • Market Share Analysis, 2024
        • By Product Type
        • By Distribution Channel
        • By Ingredient
    • Brazil
      • Pricing Analysis
      • Market Share Analysis, 2024
        • By Product Type
        • By Distribution Channel
        • By Ingredient
    • Mexico
      • Pricing Analysis
      • Market Share Analysis, 2024
        • By Product Type
        • By Distribution Channel
        • By Ingredient
    • Argentina
      • Pricing Analysis
      • Market Share Analysis, 2024
        • By Product Type
        • By Distribution Channel
        • By Ingredient
  18. Market Structure Analysis
    • Competition Dashboard
    • Competition Benchmarking
    • Market Share Analysis of Top Players
      • By Regional
      • By Product Type
      • By Distribution Channel
      • By Ingredient
  19. Competition Analysis
    • Competition Deep Dive
      • The Kraft Heinz Company (Plum Organics)
        • Overview
        • Product Portfolio
        • Profitability by Market Segments (Product/Age /Sales Channel/Region)
        • Sales Footprint
        • Strategy Overview
          • Marketing Strategy
          • Product Strategy
          • Channel Strategy
      • Nestlé (Gerber)
        • Overview
        • Product Portfolio
        • Profitability by Market Segments (Product/Age /Sales Channel/Region)
        • Sales Footprint
        • Strategy Overview
          • Marketing Strategy
          • Product Strategy
          • Channel Strategy
      • The Hain Celestial Group (Earth’s Best)
        • Overview
        • Product Portfolio
        • Profitability by Market Segments (Product/Age /Sales Channel/Region)
        • Sales Footprint
        • Strategy Overview
          • Marketing Strategy
          • Product Strategy
          • Channel Strategy
      • Hero Group (Beech-Nut)
        • Overview
        • Product Portfolio
        • Profitability by Market Segments (Product/Age /Sales Channel/Region)
        • Sales Footprint
        • Strategy Overview
          • Marketing Strategy
          • Product Strategy
          • Channel Strategy
      • Danone (Happy Family Organics)
        • Overview
        • Product Portfolio
        • Profitability by Market Segments (Product/Age /Sales Channel/Region)
        • Sales Footprint
        • Strategy Overview
          • Marketing Strategy
          • Product Strategy
          • Channel Strategy
  20. Assumptions & Acronyms Used
  21. Research Methodology

List of Tables

  • Table 1: Global Market Value (USD Billion) Forecast by Region, 2020 to 2035
  • Table 2: Global Market Volume (Million Units) Forecast by Region, 2020 to 2035
  • Table 3: Global Market Value (USD Billion) Forecast by Product Type, 2020 to 2035
  • Table 4: Global Market Volume (Million Units) Forecast by Product Type, 2020 to 2035
  • Table 5: Global Market Value (USD Billion) Forecast by Distribution Channel, 2020 to 2035
  • Table 6: Global Market Volume (Million Units) Forecast by Distribution Channel, 2020 to 2035
  • Table 7: Global Market Value (USD Billion) Forecast by Ingredient, 2020 to 2035
  • Table 8: Global Market Volume (Million Units) Forecast by Ingredient, 2020 to 2035
  • Table 9: North America Market Value (USD Billion) Forecast by Country, 2020 to 2035
  • Table 10: North America Market Volume (Million Units) Forecast by Country, 2020 to 2035
  • Table 11: North America Market Value (USD Billion) Forecast by Product Type, 2020 to 2035
  • Table 12: North America Market Volume (Million Units) Forecast by Product Type, 2020 to 2035
  • Table 13: North America Market Value (USD Billion) Forecast by Distribution Channel, 2020 to 2035
  • Table 14: North America Market Volume (Million Units) Forecast by Distribution Channel, 2020 to 2035
  • Table 15: North America Market Value (USD Billion) Forecast by Ingredient, 2020 to 2035
  • Table 16: North America Market Volume (Million Units) Forecast by Ingredient, 2020 to 2035
  • Table 17: Latin America Market Value (USD Billion) Forecast by Country, 2020 to 2035
  • Table 18: Latin America Market Volume (Million Units) Forecast by Country, 2020 to 2035
  • Table 19: Latin America Market Value (USD Billion) Forecast by Product Type, 2020 to 2035
  • Table 20: Latin America Market Volume (Million Units) Forecast by Product Type, 2020 to 2035
  • Table 21: Latin America Market Value (USD Billion) Forecast by Distribution Channel, 2020 to 2035
  • Table 22: Latin America Market Volume (Million Units) Forecast by Distribution Channel, 2020 to 2035
  • Table 23: Latin America Market Value (USD Billion) Forecast by Ingredient, 2020 to 2035
  • Table 24: Latin America Market Volume (Million Units) Forecast by Ingredient, 2020 to 2035
  • Table 25: Western Europe Market Value (USD Billion) Forecast by Country, 2020 to 2035
  • Table 26: Western Europe Market Volume (Million Units) Forecast by Country, 2020 to 2035
  • Table 27: Western Europe Market Value (USD Billion) Forecast by Product Type, 2020 to 2035
  • Table 28: Western Europe Market Volume (Million Units) Forecast by Product Type, 2020 to 2035
  • Table 29: Western Europe Market Value (USD Billion) Forecast by Distribution Channel, 2020 to 2035
  • Table 30: Western Europe Market Volume (Million Units) Forecast by Distribution Channel, 2020 to 2035
  • Table 31: Western Europe Market Value (USD Billion) Forecast by Ingredient, 2020 to 2035
  • Table 32: Western Europe Market Volume (Million Units) Forecast by Ingredient, 2020 to 2035
  • Table 33: Eastern Europe Market Value (USD Billion) Forecast by Country, 2020 to 2035
  • Table 34: Eastern Europe Market Volume (Million Units) Forecast by Country, 2020 to 2035
  • Table 35: Eastern Europe Market Value (USD Billion) Forecast by Product Type, 2020 to 2035
  • Table 36: Eastern Europe Market Volume (Million Units) Forecast by Product Type, 2020 to 2035
  • Table 37: Eastern Europe Market Value (USD Billion) Forecast by Distribution Channel, 2020 to 2035
  • Table 38: Eastern Europe Market Volume (Million Units) Forecast by Distribution Channel, 2020 to 2035
  • Table 39: Eastern Europe Market Value (USD Billion) Forecast by Ingredient, 2020 to 2035
  • Table 40: Eastern Europe Market Volume (Million Units) Forecast by Ingredient, 2020 to 2035
  • Table 41: East Asia Market Value (USD Billion) Forecast by Country, 2020 to 2035
  • Table 42: East Asia Market Volume (Million Units) Forecast by Country, 2020 to 2035
  • Table 43: East Asia Market Value (USD Billion) Forecast by Product Type, 2020 to 2035
  • Table 44: East Asia Market Volume (Million Units) Forecast by Product Type, 2020 to 2035
  • Table 45: East Asia Market Value (USD Billion) Forecast by Distribution Channel, 2020 to 2035
  • Table 46: East Asia Market Volume (Million Units) Forecast by Distribution Channel, 2020 to 2035
  • Table 47: East Asia Market Value (USD Billion) Forecast by Ingredient, 2020 to 2035
  • Table 48: East Asia Market Volume (Million Units) Forecast by Ingredient, 2020 to 2035
  • Table 49: South Asia & Pacific Market Value (USD Billion) Forecast by Country, 2020 to 2035
  • Table 50: South Asia & Pacific Market Volume (Million Units) Forecast by Country, 2020 to 2035
  • Table 51: South Asia & Pacific Market Value (USD Billion) Forecast by Product Type, 2020 to 2035
  • Table 52: South Asia & Pacific Market Volume (Million Units) Forecast by Product Type, 2020 to 2035
  • Table 53: South Asia & Pacific Market Value (USD Billion) Forecast by Distribution Channel, 2020 to 2035
  • Table 54: South Asia & Pacific Market Volume (Million Units) Forecast by Distribution Channel, 2020 to 2035
  • Table 55: South Asia & Pacific Market Value (USD Billion) Forecast by Ingredient, 2020 to 2035
  • Table 56: South Asia & Pacific Market Volume (Million Units) Forecast by Ingredient, 2020 to 2035
  • Table 57: Middle East and Africa Market Value (USD Billion) Forecast by Country, 2020 to 2035
  • Table 58: Middle East and Africa Market Volume (Million Units) Forecast by Country, 2020 to 2035
  • Table 59: Middle East and Africa Market Value (USD Billion) Forecast by Product Type, 2020 to 2035
  • Table 60: Middle East and Africa Market Volume (Million Units) Forecast by Product Type, 2020 to 2035
  • Table 61: Middle East and Africa Market Value (USD Billion) Forecast by Distribution Channel, 2020 to 2035
  • Table 62: Middle East and Africa Market Volume (Million Units) Forecast by Distribution Channel, 2020 to 2035
  • Table 63: Middle East and Africa Market Value (USD Billion) Forecast by Ingredient, 2020 to 2035
  • Table 64: Middle East and Africa Market Volume (Million Units) Forecast by Ingredient, 2020 to 2035

List of Figures

  • Figure 1: Global Market Volume (Million Units) Forecast 2020 to 2035
  • Figure 2: Global Market Pricing Analysis
  • Figure 3: Global Market Value (USD Billion) Forecast 2020 to 2035
  • Figure 4: Global Market Value Share and BPS Analysis by Product Type, 2025 and 2035
  • Figure 5: Global Market Y-o-Y Growth Comparison by Product Type, 2025 to 2035
  • Figure 6: Global Market Attractiveness Analysis by Product Type
  • Figure 7: Global Market Value Share and BPS Analysis by Distribution Channel, 2025 and 2035
  • Figure 8: Global Market Y-o-Y Growth Comparison by Distribution Channel, 2025 to 2035
  • Figure 9: Global Market Attractiveness Analysis by Distribution Channel
  • Figure 10: Global Market Value Share and BPS Analysis by Ingredient, 2025 and 2035
  • Figure 11: Global Market Y-o-Y Growth Comparison by Ingredient, 2025 to 2035
  • Figure 12: Global Market Attractiveness Analysis by Ingredient
  • Figure 13: Global Market Value (USD Billion) Share and BPS Analysis by Region, 2025 and 2035
  • Figure 14: Global Market Y-o-Y Growth Comparison by Region, 2025 to 2035
  • Figure 15: Global Market Attractiveness Analysis by Region
  • Figure 16: North America Market Incremental $ Opportunity, 2025 to 2035
  • Figure 17: Latin America Market Incremental $ Opportunity, 2025 to 2035
  • Figure 18: Western Europe Market Incremental $ Opportunity, 2025 to 2035
  • Figure 19: Eastern Europe Market Incremental $ Opportunity, 2025 to 2035
  • Figure 20: East Asia Market Incremental $ Opportunity, 2025 to 2035
  • Figure 21: South Asia & Pacific Market Incremental $ Opportunity, 2025 to 2035
  • Figure 22: Middle East and Africa Market Incremental $ Opportunity, 2025 to 2035
  • Figure 23: North America Market Value Share and BPS Analysis by Country, 2025 and 2035
  • Figure 24: North America Market Value Share and BPS Analysis by Product Type, 2025 and 2035
  • Figure 25: North America Market Y-o-Y Growth Comparison by Product Type, 2025 to 2035
  • Figure 26: North America Market Attractiveness Analysis by Product Type
  • Figure 27: North America Market Value Share and BPS Analysis by Distribution Channel, 2025 and 2035
  • Figure 28: North America Market Y-o-Y Growth Comparison by Distribution Channel, 2025 to 2035
  • Figure 29: North America Market Attractiveness Analysis by Distribution Channel
  • Figure 30: North America Market Value Share and BPS Analysis by Ingredient, 2025 and 2035
  • Figure 31: North America Market Y-o-Y Growth Comparison by Ingredient, 2025 to 2035
  • Figure 32: North America Market Attractiveness Analysis by Ingredient
  • Figure 33: Latin America Market Value Share and BPS Analysis by Country, 2025 and 2035
  • Figure 34: Latin America Market Value Share and BPS Analysis by Product Type, 2025 and 2035
  • Figure 35: Latin America Market Y-o-Y Growth Comparison by Product Type, 2025 to 2035
  • Figure 36: Latin America Market Attractiveness Analysis by Product Type
  • Figure 37: Latin America Market Value Share and BPS Analysis by Distribution Channel, 2025 and 2035
  • Figure 38: Latin America Market Y-o-Y Growth Comparison by Distribution Channel, 2025 to 2035
  • Figure 39: Latin America Market Attractiveness Analysis by Distribution Channel
  • Figure 40: Latin America Market Value Share and BPS Analysis by Ingredient, 2025 and 2035
  • Figure 41: Latin America Market Y-o-Y Growth Comparison by Ingredient, 2025 to 2035
  • Figure 42: Latin America Market Attractiveness Analysis by Ingredient
  • Figure 43: Western Europe Market Value Share and BPS Analysis by Country, 2025 and 2035
  • Figure 44: Western Europe Market Value Share and BPS Analysis by Product Type, 2025 and 2035
  • Figure 45: Western Europe Market Y-o-Y Growth Comparison by Product Type, 2025 to 2035
  • Figure 46: Western Europe Market Attractiveness Analysis by Product Type
  • Figure 47: Western Europe Market Value Share and BPS Analysis by Distribution Channel, 2025 and 2035
  • Figure 48: Western Europe Market Y-o-Y Growth Comparison by Distribution Channel, 2025 to 2035
  • Figure 49: Western Europe Market Attractiveness Analysis by Distribution Channel
  • Figure 50: Western Europe Market Value Share and BPS Analysis by Ingredient, 2025 and 2035
  • Figure 51: Western Europe Market Y-o-Y Growth Comparison by Ingredient, 2025 to 2035
  • Figure 52: Western Europe Market Attractiveness Analysis by Ingredient
  • Figure 53: Eastern Europe Market Value Share and BPS Analysis by Country, 2025 and 2035
  • Figure 54: Eastern Europe Market Value Share and BPS Analysis by Product Type, 2025 and 2035
  • Figure 55: Eastern Europe Market Y-o-Y Growth Comparison by Product Type, 2025 to 2035
  • Figure 56: Eastern Europe Market Attractiveness Analysis by Product Type
  • Figure 57: Eastern Europe Market Value Share and BPS Analysis by Distribution Channel, 2025 and 2035
  • Figure 58: Eastern Europe Market Y-o-Y Growth Comparison by Distribution Channel, 2025 to 2035
  • Figure 59: Eastern Europe Market Attractiveness Analysis by Distribution Channel
  • Figure 60: Eastern Europe Market Value Share and BPS Analysis by Ingredient, 2025 and 2035
  • Figure 61: Eastern Europe Market Y-o-Y Growth Comparison by Ingredient, 2025 to 2035
  • Figure 62: Eastern Europe Market Attractiveness Analysis by Ingredient
  • Figure 63: East Asia Market Value Share and BPS Analysis by Country, 2025 and 2035
  • Figure 64: East Asia Market Value Share and BPS Analysis by Product Type, 2025 and 2035
  • Figure 65: East Asia Market Y-o-Y Growth Comparison by Product Type, 2025 to 2035
  • Figure 66: East Asia Market Attractiveness Analysis by Product Type
  • Figure 67: East Asia Market Value Share and BPS Analysis by Distribution Channel, 2025 and 2035
  • Figure 68: East Asia Market Y-o-Y Growth Comparison by Distribution Channel, 2025 to 2035
  • Figure 69: East Asia Market Attractiveness Analysis by Distribution Channel
  • Figure 70: East Asia Market Value Share and BPS Analysis by Ingredient, 2025 and 2035
  • Figure 71: East Asia Market Y-o-Y Growth Comparison by Ingredient, 2025 to 2035
  • Figure 72: East Asia Market Attractiveness Analysis by Ingredient
  • Figure 73: South Asia & Pacific Market Value Share and BPS Analysis by Country, 2025 and 2035
  • Figure 74: South Asia & Pacific Market Value Share and BPS Analysis by Product Type, 2025 and 2035
  • Figure 75: South Asia & Pacific Market Y-o-Y Growth Comparison by Product Type, 2025 to 2035
  • Figure 76: South Asia & Pacific Market Attractiveness Analysis by Product Type
  • Figure 77: South Asia & Pacific Market Value Share and BPS Analysis by Distribution Channel, 2025 and 2035
  • Figure 78: South Asia & Pacific Market Y-o-Y Growth Comparison by Distribution Channel, 2025 to 2035
  • Figure 79: South Asia & Pacific Market Attractiveness Analysis by Distribution Channel
  • Figure 80: South Asia & Pacific Market Value Share and BPS Analysis by Ingredient, 2025 and 2035
  • Figure 81: South Asia & Pacific Market Y-o-Y Growth Comparison by Ingredient, 2025 to 2035
  • Figure 82: South Asia & Pacific Market Attractiveness Analysis by Ingredient
  • Figure 83: Middle East and Africa Market Value Share and BPS Analysis by Country, 2025 and 2035
  • Figure 84: Middle East and Africa Market Value Share and BPS Analysis by Product Type, 2025 and 2035
  • Figure 85: Middle East and Africa Market Y-o-Y Growth Comparison by Product Type, 2025 to 2035
  • Figure 86: Middle East and Africa Market Attractiveness Analysis by Product Type
  • Figure 87: Middle East and Africa Market Value Share and BPS Analysis by Distribution Channel, 2025 and 2035
  • Figure 88: Middle East and Africa Market Y-o-Y Growth Comparison by Distribution Channel, 2025 to 2035
  • Figure 89: Middle East and Africa Market Attractiveness Analysis by Distribution Channel
  • Figure 90: Middle East and Africa Market Value Share and BPS Analysis by Ingredient, 2025 and 2035
  • Figure 91: Middle East and Africa Market Y-o-Y Growth Comparison by Ingredient, 2025 to 2035
  • Figure 92: Middle East and Africa Market Attractiveness Analysis by Ingredient
  • Figure 93: Global Market - Tier Structure Analysis
  • Figure 94: Global Market - Company Share Analysis

Frequently Asked Questions

What is the size of the baby toddler bar market in 2025?

The size of the industry in 2025 is USD 7.3 billion.

What is the projected value of the baby toddler bar market in 2035 and its CAGR?

The value of the industry in 2035 is projected to reach USD 10.9 billion, with a CAGR of 4.2%.

What is the leading ingredient segment in the baby toddler bar market?

Organic baby toddler bars dominate the ingredient segment in the industry with a 42.1% industry share.

Which country will lead the baby toddler bar market?

India will lead the industry with a 5.3% CAGR from 2025 to 2035.

Who is the leading company in the baby toddler bar market?

The leading company in the industry is The Kraft Heinz Company (Plum Organics) with a 20% industry share.

Explore Similar Insights

Future Market Insights

Baby Toddler Bar Market