Baby Food Packaging Market Size and Share Forecast Outlook 2025 to 2035

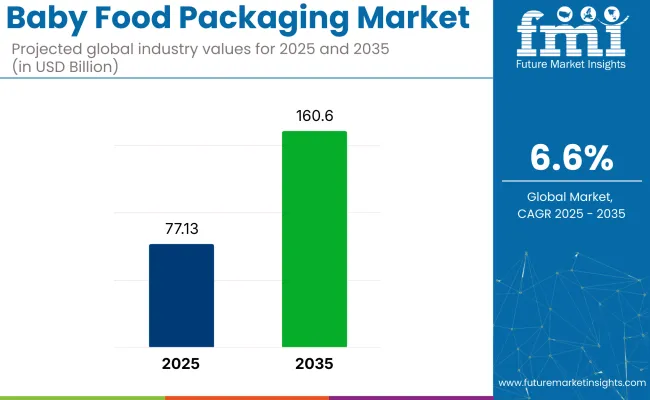
The global baby food packaging market is projected to grow at a valuation of USD 77.13 billion in 2025 to USD 160.6 billion by 2035 at a CAGR of 6.6% during the forecast period.
Baby Food Packaging Market Quick Stats

  • Market Value (2025): USD 77.13 billion
  • Forecast Value (2035): USD 160.6 billion
  • Forecast CAGR: 6.6%
  • Leading Segment in 2025: Plastic (~40% share)
  • Key Growth Region: Asia Pacific (India)
  • Top Key Players: Amcor plc, Tetra Pak, Sonoco Products Company, Winpak Ltd, Greiner Packaging

Baby Food Packaging Market

This growth is driven by the increasing demand for safe, secure, and convenient packaging solutions for baby food products. As the awareness around infant health continues to rise, the need for hygienic packaging that preserves the nutritional integrity of the food while ensuring its safety is propelling industry expansion. Additionally, the rising concerns over plastic waste are encouraging the shift toward eco-friendly packaging solutions.

As regulations around food packaging become more stringent, there is a significant shift toward scalable packaging solutions. In January 2025, an article published by the USA News stated that the USA Food and Drug Administration set new maximum lead levels for baby foods, including jarred fruits and vegetables, yogurts, and dry cereals, aiming to reduce young children's exposure to the toxic metal, which can cause developmental and neurological issues.

The agency issued final guidance that it estimates could decrease lead exposure from processed baby foods by approximately 20% to 30%. While the limits are voluntary for food manufacturers, the FDA will have the authority to take enforcement action if products exceed the established levels.

The industry holds a specific share in various parent markets. It accounts for approximately 5-7% of the food packaging market, as it focuses on specialized packaging for infant nutrition. In the flexible packaging market, the baby food packaging sector contributes about 6-8%, driven by the widespread use of flexible pouches due to their convenience. Within the plastic packaging market, it holds around 4-6%, as a significant portion of baby food packaging is made from plastic materials, including bottles and containers.

The market's share in the paper packaging market is estimated at 3-5%, as paper-based solutions are increasingly used for eco-friendly packaging. In the glass packaging market, the baby food packaging sector accounts for about 2-3%, with glass jars used for premium baby food items. These shares emphasize the niche but important role of baby food packaging across multiple sectors.

Analyzing Baby Food Packaging Market by Top Investment Segments

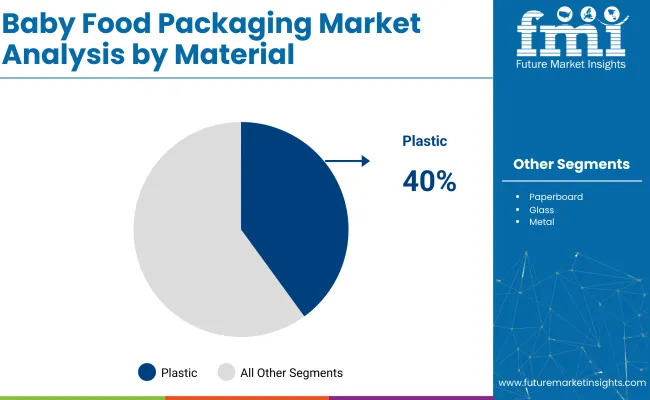
The industry is divided into materials, product types, packaging, and end use. Materials used include plastic, paperboard, glass, and metal. Plastic accounts for 40% share. In terms of product types, the market covers both powder and liquid formats. The powdered form holds 55% of the share.

Plastic Material Segment to Lead with 40% Share in 2025

In 2025, the plastic material segment is projected to dominate the industry, holding a 40% share. Plastic is cost-effective, flexible, and can preserve the quality of baby food.
  • Companies such as Amcor, Sealed Air, and Berry Global are developing innovative packaging solutions using plastic materials to meet the growing demand for eco-friendly alternatives.
  • Plastic packaging safeguards baby food products by preventing contamination, extending shelf life, and ensuring ease of use. As consumer preferences for practical, durable packaging rise, plastic will continue to dominate in baby food packaging.

Baby Food Packaging Market Analysis By Material

Powdered Baby Food to Hold 55% Share in 2025

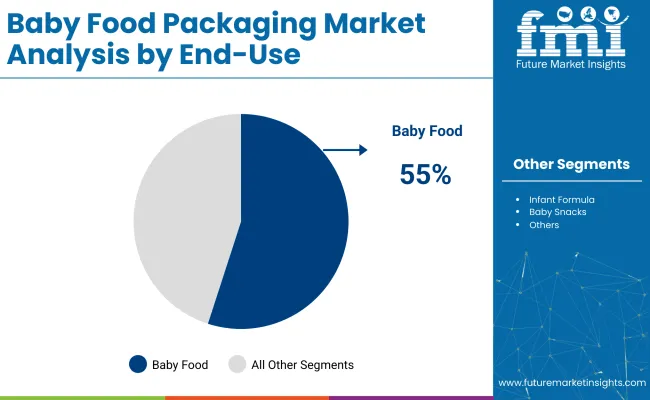
Powdered baby food, particularly infant formula and cereals, is expected to hold a 55% share of the industry in 2025. This product format is popular due to its convenience, long shelf life, and ease of transportation.
  • Popular brands like Nestlé, Abbott, and Danone are increasingly innovating within the powdered baby food space, offering a variety of flavors and nutritional profiles.
  • Packaging solutions are designed to prevent moisture and maintain the product’s nutritional content. As more parents turn to powdered baby food options, this segment will continue to lead the industry in terms of both demand and innovation.

Baby Food Packaging Market Analysis By End Use

Pouch Packaging to Hold 40% Share in 2025

Pouch packaging is expected to hold a 40% share of the industry in 2025. Pouches are growing in popularity due to their lightweight, ease of use, and ability to preserve the product's freshness and nutrients.

  • Flexible packaging solutions for baby food, particularly purees and snacks, are being developed by companies such as Mondi Group, Smurfit Kappa, and Huhtamaki. Pouches are seen as a convenient option for both consumers and manufacturers due to their portability and minimalistic design.
  • As demand for on-the-go baby food increases, the pouch segment will continue to see substantial growth and development in the industry.

Infant Formula Packaging to Drive 50% Market Demand in 2025

The packaging of infant formula is expected to account for 50% of the industry in 2025. The demand for infant formula continues to rise as more parents turn to formula feeding.

  • Companies like Abbott, Nestlé, and Mead Johnson are focusing on developing secure, tamper-evident packaging that ensures the safety and integrity of the product.
  • Packaging is also evolving to include features such as airtight seals to preserve the formula's freshness and nutritional value. As consumer concerns about product safety and convenience grow, the infant formula packaging segment will remain a significant driver of the industry's expansion.

Top Baby Food Packaging Market Dynamics

The industry is being driven by increasing demand for convenience and safety. Technological advancements and evolving consumer preferences are propelling growth, while high production costs and regulatory complexities are limiting expansion.

Increasing demand for convenient and safe packaging solutions is driving industry growth

The demand for convenient, ready-to-eat baby food products is being boosted by the growing number of working parents. Packaging solutions that offer portability, ease of use, and safety are being increasingly preferred by consumers.

There is a rising demand for nature-friendly packaging materials, including biodegradable films, recyclable plastics, and paperboard, as consumers and manufacturers are becoming more environmentally conscious. This shift toward eco-friendly solutions, combined with stricter regulations on packaging waste, is driving industry growth. Manufacturers are focusing on adopting these materials to meet both consumer and regulatory demands.

High production costs and regulatory complexities are limiting industry growth

Despite the growth potential, the industry is facing challenges related to high production costs and regulatory complexities. The adoption of sustainable packaging materials often comes with higher manufacturing expenses, which are being passed on to the consumer. Additionally, varying packaging and labeling regulations across different regions add complexity to industry expansion, requiring additional investment in compliance.

Manufacturers are struggling to balance the demand for innovative packaging with the need to maintain affordability. These factors are potentially hindering the widespread adoption of advanced packaging solutions and may slow down the industry growth.
Analyzing Top Countries Producing, Distributing, and Delivering Baby Food Packaging Solutions

Country Wise Analysis Of Baby Food Packaging Market

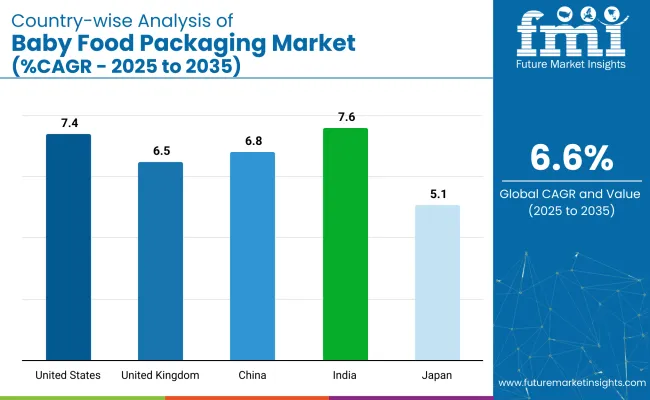
Countries CAGR (%)
United States 7.4%
United Kingdom 6.5%
China 6.8%
India 7.6%
Japan 5.1%

In the global context, the OECD countries, including the United States and the United Kingdom, exhibit steady growth. The United States, with a projected CAGR of 7.4%, leads the charge, driven by increasing demand for convenient and tamper-proof packaging solutions.

The country's expanding consumer base for high-quality baby food packaging, alongside the growing importance of safety and user experience, makes it a key player in the global market. The United Kingdom, at a CAGR of 6.5%, shows stable growth, supported by rising demand for eco-friendly and high-quality packaging solutions, with companies like Gerresheimer and AptarGroup spearheading innovations.

In contrast, India, a key player within the BRICS group, is experiencing faster growth, with a projected CAGR of 7.6%. India’s increasing birth rates and rising disposable incomes are fueling a growing demand for high-quality, safe packaging solutions.

The expanding middle class and the rise of e-commerce further accelerate the demand for convenient and eco-friendly packaging. Additionally, China, within the ASEAN region, is expanding at a CAGR of 6.8%, driven by rapid industrialization, increased demand for packaged baby food, and advancements in packaging technologies.

The OECD countries contribute to the steady demand for Baby Food Packaging, with the USA having high demand for advanced packaging solutions, while India and China in the BRICS and ASEAN groups offer the highest growth potential due to their emerging middle classes. Both developed and emerging markets will play crucial roles in shaping the future of the industry at a global level.

In-depth Analysis of the United States Baby Food Packaging Market

The United States industry is expected to grow at a CAGR of 7.4% through 2035. Growth is supported by increasing demand for convenient, tamper-proof packaging solutions that preserve the integrity of baby food products.

  • Companies such as Amcor, Tetra Pak, and Silgan Holdings are investing in advanced packaging technologies, improving user experience and enhancing safety.
  • Government regulations regarding pharmaceutical packaging and consumer awareness of product quality are contributing to the industry’s growth. The focus on eco-friendly materials and regulatory standards supporting packaging safety ensures steady demand for packaging solutions.

Detailed Analysis of the United Kingdom Baby Food Packaging Market

The United Kingdom industry is projected to grow at a CAGR of 6.5% through 2035. Growth is being driven by rising demand for high-quality packaging solutions in the baby food industry, alongside increasing consumer demand for eco-friendly alternatives.

  • Established companies such as Gerresheimer, AptarGroup, and Berry Global are advancing packaging technologies to ensure better protection and shelf-life for baby food products.
  • Government policies supporting packaging safety makes the UK a key industry for glass packaging solutions.

China Baby Food Packaging Market Growth Outlook

The industry is expected to grow at a CAGR of 6.8% through 2035. Expansion is driven by rapid industrialization, increased demand for packaged baby food, and advancements in packaging technologies.

  • Established companies such as Zhejiang Glass, Piramal Glass, and China National Pharmaceutical Group (Sinopharm) are investing in the development of advanced packaging solutions.
  • Government policies aimed at improving packaging standards and consumer safety contribute to industry growth. The growing middle-class population further accelerate demand for convenient and safe packaging solutions. The packaging industry benefits from an increasing preference for functional, eco-friendly packaging.

India Baby Food Packaging Market Analysis and Opportunities Analysis

The industry is expected to grow at a CAGR of 7.6% through 2035. Growth is driven by increasing birth rates and rising disposable incomes. Local companies like Bormioli Pharma, SGD Pharma, and Piramal Glass are expanding their production capacities and improving packaging quality to meet growing demand.

  • Government initiatives promoting infant nutrition and packaging standards support industry growth. The rise of e-commerce and changing consumer preferences for convenient and eco-friendly packaging further accelerate adoption.
  • The increasing demand for high-quality packaging solutions is further driving the adoption of packaging solutions.

Japan Baby Food Packaging Market Growth Outlook

The industry is projected to grow at a CAGR of 5.1% through 2035. Growth is supported by the country’s advanced manufacturing sector and strong focus on product safety and packaging quality.
  • Companies such as Nipro Corporation, Gerresheimer, and SGD Pharma are advancing packaging technologies to enhance product safety, integrity, and shelf life. Government regulations mandating high-quality packaging and an increasing emphasis on pharmaceutical safety ensure steady industry demand.
  • Innovations in packaging materials and designs contribute to the continued growth of the industry in Japan. Japan’s focus on packaging solutions strengthens its position in the global industry.

Top Suppliers in the Industry

Baby Food Packaging Market Analysis By Company

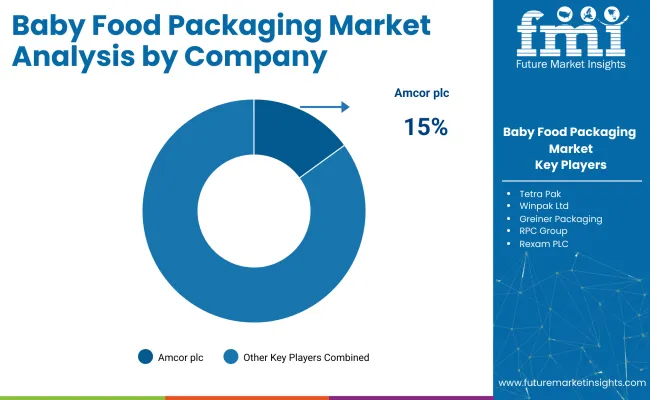
The global industry is characterized by a diverse range of players segmented key manufacturers, suppliers, and distributors, among others, in the supply chain. Key players like Amcor plc, Tetra Pak, and Sonoco Products Company dominate the industry due to their extensive product portfolios, technological advancements, and strong global presence in the food and beverage packaging sector.

Other significant players such as Winpak Ltd, Greiner Packaging, and Printpack focus on specialized markets, offering innovative packaging solutions tailored to the unique requirements of baby food products. Emerging players like Logos Packaging and Guala Pack S.p.A. target regional markets with cost-effective and niche product offerings, catering to specific consumer needs and preferences.

Recent Baby Food Packaging Industry News

  • In January 2023, ByHeart, a next-generation baby nutrition company, acquired Cascadia Nutrition, an FDA-registered packaging and blending plant in Portland, Oregon, to gain control over its manufacturing processes.
  • In June 2023, Nature's Path Organic Foods acquired Love Child Organics, a Canadian baby food and kids' snack brand, reinforcing its commitment to organic offerings in the baby food sector.

Top Suppliers in the Industry

  • Amcor plc
  • Tetra Pak
  • Sonoco Products Company
  • Winpak Ltd
  • Greiner Packaging
  • Printpack
  • Logos Packaging
  • Guala Pack S.p.A.
  • Ardagh Group
  • Mondi Group
  • Bemis Company Inc.
  • Rexam PLC
  • RPC Group

Research Coverage and Scope Summary

Report Attributes Details
Current Total Market Size (2025) USD 77.13 billion
Projected Market Size (2035) USD 160.6 billion
CAGR (2025 to 2035) 6.6%
Base Year for Estimation 2024
Historical Period 2020 to 2024
Projections Period 2025 to 2035
Quantitative Units USD billion for value, metric tons for volume
Materials Analyzed (Segment 1) Plastic; Paperboard; Glass; Metal
Product Types Analyzed (Segment 2) Powder; Liquid
Packaging Types Covered (Segment 3) Pouches; Bottles; Cartons; Cans; Other packaging types
End-Use Segments Covered (Segment 4) Infant formula, Baby snacks, Baby food, Other end-uses
Regions Covered Asia Pacific; North America; Europe; Latin America; Middle East & Africa
Countries Covered United States; Canada , United Kingdom; Germany; France; Italy; Spain; Netherlands , China; India; Japan; South Korea; Australia , Brazil ; Mexico; Argentina , Saudi Arabia; UAE; South Africa; Egypt; Turkey
Key Players Influencing the Industry Amcor plc; Tetra Pak; Sonoco Products Company; Winpak Ltd; Greiner Packaging; Printpack; Logos Packaging; Guala Pack S.p.A.; Ardagh Group; Mondi Group; Bemis Company Inc. , Rexam PLC , RPC Gr oup
Additional Attributes Dollar sales by material type (plastic, paperboard, glass, metal); Growth in liquid vs powder product types; Packaging format trends (pouches, bottles, cans); Regional industry demand for baby food packaging solutions; Technological advancements in packaging

Baby Food Packaging Market Analyzed by Key Investment Segments

By Material:

The industry is segmented into plastic, paperboard, glass, and metal.

By Product Type:

The industry includes powder and liquid product types.

By Packaging:

The industry covers pouches, bottles, cartons, cans, and others.

By End-Use:

The industry includes infant formula, baby snacks, baby food, and others.

By Region:

The industry spans Asia Pacific, North America, Europe, Latin America, and Middle East & Africa.

Table of Content

  1. Executive Summary
    • Global Market Outlook
    • Demand-side Trends
    • Supply-side Trends
    • Technology Roadmap Analysis
    • Analysis and Recommendations
  2. Market Overview
    • Market Coverage / Taxonomy
    • Market Definition / Scope / Limitations
  3. Market Background
    • Market Dynamics
      • Drivers
      • Restraints
      • Opportunity
      • Trends
    • Scenario Forecast
      • Demand in Optimistic Scenario
      • Demand in Likely Scenario
      • Demand in Conservative Scenario
    • Opportunity Map Analysis
    • Product Life Cycle Analysis
    • Supply Chain Analysis
      • Supply Side Participants and their Roles
        • Producers
        • Mid-Level Participants (Traders/ Agents/ Brokers)
        • Wholesalers and Distributors
      • Value Added and Value Created at Node in the Supply Chain
      • List of Raw Material Suppliers
      • List of Existing and Potential Buyer’s
    • Investment Feasibility Matrix
    • Value Chain Analysis
      • Profit Margin Analysis
      • Wholesalers and Distributors
      • Retailers
    • PESTLE and Porter’s Analysis
    • Regulatory Landscape
      • By Key Regions
      • By Key Countries
    • Regional Parent Market Outlook
    • Production and Consumption Statistics
    • Import and Export Statistics
  4. Global Market Analysis 2020 to 2024 and Forecast, 2025 to 2035
    • Historical Market Size Value (USD Billion) & Volume (MT ton) Analysis, 2020 to 2024
    • Current and Future Market Size Value (USD Billion) & Volume (MT ton) Projections, 2025 to 2035
      • Y-o-Y Growth Trend Analysis
      • Absolute $ Opportunity Analysis
  5. Global Market Pricing Analysis 2020 to 2024 and Forecast 2025 to 2035
  6. Global Market Analysis 2020 to 2024 and Forecast 2025 to 2035, By Material
    • Introduction / Key Findings
    • Historical Market Size Value (USD Billion) & Volume (MT ton) Analysis By Material, 2020 to 2024
    • Current and Future Market Size Value (USD Billion) & Volume (MT ton) Analysis and Forecast By Material, 2025 to 2035
      • Plastic
      • Paperboard
      • Glass
      • Metal
    • Y-o-Y Growth Trend Analysis By Material, 2020 to 2024
    • Absolute $ Opportunity Analysis By Material, 2025 to 2035
  7. Global Market Analysis 2020 to 2024 and Forecast 2025 to 2035, By Product Type
    • Introduction / Key Findings
    • Historical Market Size Value (USD Billion) & Volume (MT ton) Analysis By Product Type, 2020 to 2024
    • Current and Future Market Size Value (USD Billion) & Volume (MT ton) Analysis and Forecast By Product Type, 2025 to 2035
      • Powder
      • Liquid
    • Y-o-Y Growth Trend Analysis By Product Type, 2020 to 2024
    • Absolute $ Opportunity Analysis By Product Type, 2025 to 2035
  8. Global Market Analysis 2020 to 2024 and Forecast 2025 to 2035, By Packaging
    • Introduction / Key Findings
    • Historical Market Size Value (USD Billion) & Volume (MT ton) Analysis By Packaging, 2020 to 2024
    • Current and Future Market Size Value (USD Billion) & Volume (MT ton) Analysis and Forecast By Packaging, 2025 to 2035
      • Pouches
      • Bottles
      • Cartons
      • Cans
      • Others
    • Y-o-Y Growth Trend Analysis By Packaging, 2020 to 2024
    • Absolute $ Opportunity Analysis By Packaging, 2025 to 2035
  9. Global Market Analysis 2020 to 2024 and Forecast 2025 to 2035, By End-Use
    • Introduction / Key Findings
    • Historical Market Size Value (USD Billion) & Volume (MT ton) Analysis By End-Use, 2020 to 2024
    • Current and Future Market Size Value (USD Billion) & Volume (MT ton) Analysis and Forecast By End-Use, 2025 to 2035
      • Infant Formula
      • Baby Snacks
      • Baby Food
      • Others
    • Y-o-Y Growth Trend Analysis By End-Use, 2020 to 2024
    • Absolute $ Opportunity Analysis By End-Use, 2025 to 2035
  10. Global Market Analysis 2020 to 2024 and Forecast 2025 to 2035, By Region
    • Introduction
    • Historical Market Size Value (USD Billion) & Volume (MT ton) Analysis By Region, 2020 to 2024
    • Current Market Size Value (USD Billion) & Volume (MT ton) Analysis and Forecast By Region, 2025 to 2035
      • North America
      • Latin America
      • Western Europe
      • Eastern Europe
      • East Asia
      • South Asia & Pacific
      • Middle East and Africa
    • Market Attractiveness Analysis By Region
  11. North America Market Analysis 2020 to 2024 and Forecast 2025 to 2035, By Country
    • Historical Market Size Value (USD Billion) & Volume (MT ton) Trend Analysis By Market Taxonomy, 2020 to 2024
    • Market Size Value (USD Billion) & Volume (MT ton) Forecast By Market Taxonomy, 2025 to 2035
      • By Country
        • USA
        • Canada
        • Mexico
      • By Material
      • By Product Type
      • By Packaging
      • By End-Use
    • Market Attractiveness Analysis
      • By Country
      • By Material
      • By Product Type
      • By Packaging
      • By End-Use
    • Key Takeaways
  12. Latin America Market Analysis 2020 to 2024 and Forecast 2025 to 2035, By Country
    • Historical Market Size Value (USD Billion) & Volume (MT ton) Trend Analysis By Market Taxonomy, 2020 to 2024
    • Market Size Value (USD Billion) & Volume (MT ton) Forecast By Market Taxonomy, 2025 to 2035
      • By Country
        • Brazil
        • Argentina
        • Rest of LATAM
      • By Material
      • By Product Type
      • By Packaging
      • By End-Use
    • Market Attractiveness Analysis
      • By Country
      • By Material
      • By Product Type
      • By Packaging
      • By End-Use
    • Key Takeaways
  13. Western Europe Market Analysis 2020 to 2024 and Forecast 2025 to 2035, By Country
    • Historical Market Size Value (USD Billion) & Volume (MT ton) Trend Analysis By Market Taxonomy, 2020 to 2024
    • Market Size Value (USD Billion) & Volume (MT ton) Forecast By Market Taxonomy, 2025 to 2035
      • By Country
        • Germany
        • Italy
        • France
        • UK
        • Spain
        • BENELUX
        • Nordic
        • Rest of W.Europe
      • By Material
      • By Product Type
      • By Packaging
      • By End-Use
    • Market Attractiveness Analysis
      • By Country
      • By Material
      • By Product Type
      • By Packaging
      • By End-Use
    • Key Takeaways
  14. Eastern Europe Market Analysis 2020 to 2024 and Forecast 2025 to 2035, By Country
    • Historical Market Size Value (USD Billion) & Volume (MT ton) Trend Analysis By Market Taxonomy, 2020 to 2024
    • Market Size Value (USD Billion) & Volume (MT ton) Forecast By Market Taxonomy, 2025 to 2035
      • By Country
        • Russia
        • Hungary
        • Poland
        • Balkan & Baltics
        • Rest of E. Europe
      • By Material
      • By Product Type
      • By Packaging
      • By End-Use
    • Market Attractiveness Analysis
      • By Country
      • By Material
      • By Product Type
      • By Packaging
      • By End-Use
    • Key Takeaways
  15. East Asia Market Analysis 2020 to 2024 and Forecast 2025 to 2035, By Country
    • Historical Market Size Value (USD Billion) & Volume (MT ton) Trend Analysis By Market Taxonomy, 2020 to 2024
    • Market Size Value (USD Billion) & Volume (MT ton) Forecast By Market Taxonomy, 2025 to 2035
      • By Country
        • China
        • Japan
        • South Korea
      • By Material
      • By Product Type
      • By Packaging
      • By End-Use
    • Market Attractiveness Analysis
      • By Country
      • By Material
      • By Product Type
      • By Packaging
      • By End-Use
    • Key Takeaways
  16. South Asia & Pacific Market Analysis 2020 to 2024 and Forecast 2025 to 2035, By Country
    • Historical Market Size Value (USD Billion) & Volume (MT ton) Trend Analysis By Market Taxonomy, 2020 to 2024
    • Market Size Value (USD Billion) & Volume (MT ton) Forecast By Market Taxonomy, 2025 to 2035
      • By Country
        • India
        • Australia & New Zealand
        • ASEAN
        • Rest of SAP
      • By Material
      • By Product Type
      • By Packaging
      • By End-Use
    • Market Attractiveness Analysis
      • By Country
      • By Material
      • By Product Type
      • By Packaging
      • By End-Use
    • Key Takeaways
  17. Middle East and Africa Market Analysis 2020 to 2024 and Forecast 2025 to 2035, By Country
    • Historical Market Size Value (USD Billion) & Volume (MT ton) Trend Analysis By Market Taxonomy, 2020 to 2024
    • Market Size Value (USD Billion) & Volume (MT ton) Forecast By Market Taxonomy, 2025 to 2035
      • By Country
        • GCC Countries
        • Northern Africa
        • South Africa
        • Turkiye
        • Rest of MEA
      • By Material
      • By Product Type
      • By Packaging
      • By End-Use
    • Market Attractiveness Analysis
      • By Country
      • By Material
      • By Product Type
      • By Packaging
      • By End-Use
    • Key Takeaways
  18. Key Countries Market Analysis
    • USA
      • Pricing Analysis
      • Market Share Analysis, 2024
        • By Material
        • By Product Type
        • By Packaging
        • By End-Use
    • Canada
      • Pricing Analysis
      • Market Share Analysis, 2024
        • By Material
        • By Product Type
        • By Packaging
        • By End-Use
    • Brazil
      • Pricing Analysis
      • Market Share Analysis, 2024
        • By Material
        • By Product Type
        • By Packaging
        • By End-Use
    • Mexico
      • Pricing Analysis
      • Market Share Analysis, 2024
        • By Material
        • By Product Type
        • By Packaging
        • By End-Use
    • Argentina
      • Pricing Analysis
      • Market Share Analysis, 2024
        • By Material
        • By Product Type
        • By Packaging
        • By End-Use
  19. Market Structure Analysis
    • Competition Dashboard
    • Competition Benchmarking
    • Market Share Analysis of Top Players
      • By Regional
      • By Material
      • By Product Type
      • By Packaging
      • By End-Use
  20. Competition Analysis
    • Competition Deep Dive
      • Amcor plc
        • Overview
        • Product Portfolio
        • Profitability by Market Segments (Product/Age /Sales Channel/Region)
        • Sales Footprint
        • Strategy Overview
          • Marketing Strategy
          • Product Strategy
          • Channel Strategy
      • Tetra Pak
        • Overview
        • Product Portfolio
        • Profitability by Market Segments (Product/Age /Sales Channel/Region)
        • Sales Footprint
        • Strategy Overview
          • Marketing Strategy
          • Product Strategy
          • Channel Strategy
      • Sonoco Products Company
        • Overview
        • Product Portfolio
        • Profitability by Market Segments (Product/Age /Sales Channel/Region)
        • Sales Footprint
        • Strategy Overview
          • Marketing Strategy
          • Product Strategy
          • Channel Strategy
      • Winpak Ltd
        • Overview
        • Product Portfolio
        • Profitability by Market Segments (Product/Age /Sales Channel/Region)
        • Sales Footprint
        • Strategy Overview
          • Marketing Strategy
          • Product Strategy
          • Channel Strategy
      • Greiner Packaging
        • Overview
        • Product Portfolio
        • Profitability by Market Segments (Product/Age /Sales Channel/Region)
        • Sales Footprint
        • Strategy Overview
          • Marketing Strategy
          • Product Strategy
          • Channel Strategy
      • Printpack
        • Overview
        • Product Portfolio
        • Profitability by Market Segments (Product/Age /Sales Channel/Region)
        • Sales Footprint
        • Strategy Overview
          • Marketing Strategy
          • Product Strategy
          • Channel Strategy
      • Logos Packaging
        • Overview
        • Product Portfolio
        • Profitability by Market Segments (Product/Age /Sales Channel/Region)
        • Sales Footprint
        • Strategy Overview
          • Marketing Strategy
          • Product Strategy
          • Channel Strategy
      • Guala Pack S.p.A.
        • Overview
        • Product Portfolio
        • Profitability by Market Segments (Product/Age /Sales Channel/Region)
        • Sales Footprint
        • Strategy Overview
          • Marketing Strategy
          • Product Strategy
          • Channel Strategy
      • Ardagh Group
        • Overview
        • Product Portfolio
        • Profitability by Market Segments (Product/Age /Sales Channel/Region)
        • Sales Footprint
        • Strategy Overview
          • Marketing Strategy
          • Product Strategy
          • Channel Strategy
      • Mondi Group
        • Overview
        • Product Portfolio
        • Profitability by Market Segments (Product/Age /Sales Channel/Region)
        • Sales Footprint
        • Strategy Overview
          • Marketing Strategy
          • Product Strategy
          • Channel Strategy
      • Bemis Company Inc.
        • Overview
        • Product Portfolio
        • Profitability by Market Segments (Product/Age /Sales Channel/Region)
        • Sales Footprint
        • Strategy Overview
          • Marketing Strategy
          • Product Strategy
          • Channel Strategy
      • Rexam PLC
        • Overview
        • Product Portfolio
        • Profitability by Market Segments (Product/Age /Sales Channel/Region)
        • Sales Footprint
        • Strategy Overview
          • Marketing Strategy
          • Product Strategy
          • Channel Strategy
      • RPC Group
        • Overview
        • Product Portfolio
        • Profitability by Market Segments (Product/Age /Sales Channel/Region)
        • Sales Footprint
        • Strategy Overview
          • Marketing Strategy
          • Product Strategy
          • Channel Strategy
  21. Assumptions & Acronyms Used
  22. Research Methodology

List of Tables

  • Table 1: Global Market Value (USD Billion) Forecast by Region, 2020 to 2035
  • Table 2: Global Market Volume (MT ton) Forecast by Region, 2020 to 2035
  • Table 3: Global Market Value (USD Billion) Forecast by Material, 2020 to 2035
  • Table 4: Global Market Volume (MT ton) Forecast by Material, 2020 to 2035
  • Table 5: Global Market Value (USD Billion) Forecast by Product Type, 2020 to 2035
  • Table 6: Global Market Volume (MT ton) Forecast by Product Type, 2020 to 2035
  • Table 7: Global Market Value (USD Billion) Forecast by Packaging, 2020 to 2035
  • Table 8: Global Market Volume (MT ton) Forecast by Packaging, 2020 to 2035
  • Table 9: Global Market Value (USD Billion) Forecast by End-Use, 2020 to 2035
  • Table 10: Global Market Volume (MT ton) Forecast by End-Use, 2020 to 2035
  • Table 11: North America Market Value (USD Billion) Forecast by Country, 2020 to 2035
  • Table 12: North America Market Volume (MT ton) Forecast by Country, 2020 to 2035
  • Table 13: North America Market Value (USD Billion) Forecast by Material, 2020 to 2035
  • Table 14: North America Market Volume (MT ton) Forecast by Material, 2020 to 2035
  • Table 15: North America Market Value (USD Billion) Forecast by Product Type, 2020 to 2035
  • Table 16: North America Market Volume (MT ton) Forecast by Product Type, 2020 to 2035
  • Table 17: North America Market Value (USD Billion) Forecast by Packaging, 2020 to 2035
  • Table 18: North America Market Volume (MT ton) Forecast by Packaging, 2020 to 2035
  • Table 19: North America Market Value (USD Billion) Forecast by End-Use, 2020 to 2035
  • Table 20: North America Market Volume (MT ton) Forecast by End-Use, 2020 to 2035
  • Table 21: Latin America Market Value (USD Billion) Forecast by Country, 2020 to 2035
  • Table 22: Latin America Market Volume (MT ton) Forecast by Country, 2020 to 2035
  • Table 23: Latin America Market Value (USD Billion) Forecast by Material, 2020 to 2035
  • Table 24: Latin America Market Volume (MT ton) Forecast by Material, 2020 to 2035
  • Table 25: Latin America Market Value (USD Billion) Forecast by Product Type, 2020 to 2035
  • Table 26: Latin America Market Volume (MT ton) Forecast by Product Type, 2020 to 2035
  • Table 27: Latin America Market Value (USD Billion) Forecast by Packaging, 2020 to 2035
  • Table 28: Latin America Market Volume (MT ton) Forecast by Packaging, 2020 to 2035
  • Table 29: Latin America Market Value (USD Billion) Forecast by End-Use, 2020 to 2035
  • Table 30: Latin America Market Volume (MT ton) Forecast by End-Use, 2020 to 2035
  • Table 31: Western Europe Market Value (USD Billion) Forecast by Country, 2020 to 2035
  • Table 32: Western Europe Market Volume (MT ton) Forecast by Country, 2020 to 2035
  • Table 33: Western Europe Market Value (USD Billion) Forecast by Material, 2020 to 2035
  • Table 34: Western Europe Market Volume (MT ton) Forecast by Material, 2020 to 2035
  • Table 35: Western Europe Market Value (USD Billion) Forecast by Product Type, 2020 to 2035
  • Table 36: Western Europe Market Volume (MT ton) Forecast by Product Type, 2020 to 2035
  • Table 37: Western Europe Market Value (USD Billion) Forecast by Packaging, 2020 to 2035
  • Table 38: Western Europe Market Volume (MT ton) Forecast by Packaging, 2020 to 2035
  • Table 39: Western Europe Market Value (USD Billion) Forecast by End-Use, 2020 to 2035
  • Table 40: Western Europe Market Volume (MT ton) Forecast by End-Use, 2020 to 2035
  • Table 41: Eastern Europe Market Value (USD Billion) Forecast by Country, 2020 to 2035
  • Table 42: Eastern Europe Market Volume (MT ton) Forecast by Country, 2020 to 2035
  • Table 43: Eastern Europe Market Value (USD Billion) Forecast by Material, 2020 to 2035
  • Table 44: Eastern Europe Market Volume (MT ton) Forecast by Material, 2020 to 2035
  • Table 45: Eastern Europe Market Value (USD Billion) Forecast by Product Type, 2020 to 2035
  • Table 46: Eastern Europe Market Volume (MT ton) Forecast by Product Type, 2020 to 2035
  • Table 47: Eastern Europe Market Value (USD Billion) Forecast by Packaging, 2020 to 2035
  • Table 48: Eastern Europe Market Volume (MT ton) Forecast by Packaging, 2020 to 2035
  • Table 49: Eastern Europe Market Value (USD Billion) Forecast by End-Use, 2020 to 2035
  • Table 50: Eastern Europe Market Volume (MT ton) Forecast by End-Use, 2020 to 2035
  • Table 51: East Asia Market Value (USD Billion) Forecast by Country, 2020 to 2035
  • Table 52: East Asia Market Volume (MT ton) Forecast by Country, 2020 to 2035
  • Table 53: East Asia Market Value (USD Billion) Forecast by Material, 2020 to 2035
  • Table 54: East Asia Market Volume (MT ton) Forecast by Material, 2020 to 2035
  • Table 55: East Asia Market Value (USD Billion) Forecast by Product Type, 2020 to 2035
  • Table 56: East Asia Market Volume (MT ton) Forecast by Product Type, 2020 to 2035
  • Table 57: East Asia Market Value (USD Billion) Forecast by Packaging, 2020 to 2035
  • Table 58: East Asia Market Volume (MT ton) Forecast by Packaging, 2020 to 2035
  • Table 59: East Asia Market Value (USD Billion) Forecast by End-Use, 2020 to 2035
  • Table 60: East Asia Market Volume (MT ton) Forecast by End-Use, 2020 to 2035
  • Table 61: South Asia & Pacific Market Value (USD Billion) Forecast by Country, 2020 to 2035
  • Table 62: South Asia & Pacific Market Volume (MT ton) Forecast by Country, 2020 to 2035
  • Table 63: South Asia & Pacific Market Value (USD Billion) Forecast by Material, 2020 to 2035
  • Table 64: South Asia & Pacific Market Volume (MT ton) Forecast by Material, 2020 to 2035
  • Table 65: South Asia & Pacific Market Value (USD Billion) Forecast by Product Type, 2020 to 2035
  • Table 66: South Asia & Pacific Market Volume (MT ton) Forecast by Product Type, 2020 to 2035
  • Table 67: South Asia & Pacific Market Value (USD Billion) Forecast by Packaging, 2020 to 2035
  • Table 68: South Asia & Pacific Market Volume (MT ton) Forecast by Packaging, 2020 to 2035
  • Table 69: South Asia & Pacific Market Value (USD Billion) Forecast by End-Use, 2020 to 2035
  • Table 70: South Asia & Pacific Market Volume (MT ton) Forecast by End-Use, 2020 to 2035
  • Table 71: Middle East and Africa Market Value (USD Billion) Forecast by Country, 2020 to 2035
  • Table 72: Middle East and Africa Market Volume (MT ton) Forecast by Country, 2020 to 2035
  • Table 73: Middle East and Africa Market Value (USD Billion) Forecast by Material, 2020 to 2035
  • Table 74: Middle East and Africa Market Volume (MT ton) Forecast by Material, 2020 to 2035
  • Table 75: Middle East and Africa Market Value (USD Billion) Forecast by Product Type, 2020 to 2035
  • Table 76: Middle East and Africa Market Volume (MT ton) Forecast by Product Type, 2020 to 2035
  • Table 77: Middle East and Africa Market Value (USD Billion) Forecast by Packaging, 2020 to 2035
  • Table 78: Middle East and Africa Market Volume (MT ton) Forecast by Packaging, 2020 to 2035
  • Table 79: Middle East and Africa Market Value (USD Billion) Forecast by End-Use, 2020 to 2035
  • Table 80: Middle East and Africa Market Volume (MT ton) Forecast by End-Use, 2020 to 2035

List of Figures

  • Figure 1: Global Market Volume (MT ton) Forecast 2020 to 2035
  • Figure 2: Global Market Pricing Analysis
  • Figure 3: Global Market Value (USD Billion) Forecast 2020 to 2035
  • Figure 4: Global Market Value Share and BPS Analysis by Material, 2025 and 2035
  • Figure 5: Global Market Y-o-Y Growth Comparison by Material, 2025 to 2035
  • Figure 6: Global Market Attractiveness Analysis by Material
  • Figure 7: Global Market Value Share and BPS Analysis by Product Type, 2025 and 2035
  • Figure 8: Global Market Y-o-Y Growth Comparison by Product Type, 2025 to 2035
  • Figure 9: Global Market Attractiveness Analysis by Product Type
  • Figure 10: Global Market Value Share and BPS Analysis by Packaging, 2025 and 2035
  • Figure 11: Global Market Y-o-Y Growth Comparison by Packaging, 2025 to 2035
  • Figure 12: Global Market Attractiveness Analysis by Packaging
  • Figure 13: Global Market Value Share and BPS Analysis by End-Use, 2025 and 2035
  • Figure 14: Global Market Y-o-Y Growth Comparison by End-Use, 2025 to 2035
  • Figure 15: Global Market Attractiveness Analysis by End-Use
  • Figure 16: Global Market Value (USD Billion) Share and BPS Analysis by Region, 2025 and 2035
  • Figure 17: Global Market Y-o-Y Growth Comparison by Region, 2025 to 2035
  • Figure 18: Global Market Attractiveness Analysis by Region
  • Figure 19: North America Market Incremental $ Opportunity, 2025 to 2035
  • Figure 20: Latin America Market Incremental $ Opportunity, 2025 to 2035
  • Figure 21: Western Europe Market Incremental $ Opportunity, 2025 to 2035
  • Figure 22: Eastern Europe Market Incremental $ Opportunity, 2025 to 2035
  • Figure 23: East Asia Market Incremental $ Opportunity, 2025 to 2035
  • Figure 24: South Asia & Pacific Market Incremental $ Opportunity, 2025 to 2035
  • Figure 25: Middle East and Africa Market Incremental $ Opportunity, 2025 to 2035
  • Figure 26: North America Market Value Share and BPS Analysis by Country, 2025 and 2035
  • Figure 27: North America Market Value Share and BPS Analysis by Material, 2025 and 2035
  • Figure 28: North America Market Y-o-Y Growth Comparison by Material, 2025 to 2035
  • Figure 29: North America Market Attractiveness Analysis by Material
  • Figure 30: North America Market Value Share and BPS Analysis by Product Type, 2025 and 2035
  • Figure 31: North America Market Y-o-Y Growth Comparison by Product Type, 2025 to 2035
  • Figure 32: North America Market Attractiveness Analysis by Product Type
  • Figure 33: North America Market Value Share and BPS Analysis by Packaging, 2025 and 2035
  • Figure 34: North America Market Y-o-Y Growth Comparison by Packaging, 2025 to 2035
  • Figure 35: North America Market Attractiveness Analysis by Packaging
  • Figure 36: North America Market Value Share and BPS Analysis by End-Use, 2025 and 2035
  • Figure 37: North America Market Y-o-Y Growth Comparison by End-Use, 2025 to 2035
  • Figure 38: North America Market Attractiveness Analysis by End-Use
  • Figure 39: Latin America Market Value Share and BPS Analysis by Country, 2025 and 2035
  • Figure 40: Latin America Market Value Share and BPS Analysis by Material, 2025 and 2035
  • Figure 41: Latin America Market Y-o-Y Growth Comparison by Material, 2025 to 2035
  • Figure 42: Latin America Market Attractiveness Analysis by Material
  • Figure 43: Latin America Market Value Share and BPS Analysis by Product Type, 2025 and 2035
  • Figure 44: Latin America Market Y-o-Y Growth Comparison by Product Type, 2025 to 2035
  • Figure 45: Latin America Market Attractiveness Analysis by Product Type
  • Figure 46: Latin America Market Value Share and BPS Analysis by Packaging, 2025 and 2035
  • Figure 47: Latin America Market Y-o-Y Growth Comparison by Packaging, 2025 to 2035
  • Figure 48: Latin America Market Attractiveness Analysis by Packaging
  • Figure 49: Latin America Market Value Share and BPS Analysis by End-Use, 2025 and 2035
  • Figure 50: Latin America Market Y-o-Y Growth Comparison by End-Use, 2025 to 2035
  • Figure 51: Latin America Market Attractiveness Analysis by End-Use
  • Figure 52: Western Europe Market Value Share and BPS Analysis by Country, 2025 and 2035
  • Figure 53: Western Europe Market Value Share and BPS Analysis by Material, 2025 and 2035
  • Figure 54: Western Europe Market Y-o-Y Growth Comparison by Material, 2025 to 2035
  • Figure 55: Western Europe Market Attractiveness Analysis by Material
  • Figure 56: Western Europe Market Value Share and BPS Analysis by Product Type, 2025 and 2035
  • Figure 57: Western Europe Market Y-o-Y Growth Comparison by Product Type, 2025 to 2035
  • Figure 58: Western Europe Market Attractiveness Analysis by Product Type
  • Figure 59: Western Europe Market Value Share and BPS Analysis by Packaging, 2025 and 2035
  • Figure 60: Western Europe Market Y-o-Y Growth Comparison by Packaging, 2025 to 2035
  • Figure 61: Western Europe Market Attractiveness Analysis by Packaging
  • Figure 62: Western Europe Market Value Share and BPS Analysis by End-Use, 2025 and 2035
  • Figure 63: Western Europe Market Y-o-Y Growth Comparison by End-Use, 2025 to 2035
  • Figure 64: Western Europe Market Attractiveness Analysis by End-Use
  • Figure 65: Eastern Europe Market Value Share and BPS Analysis by Country, 2025 and 2035
  • Figure 66: Eastern Europe Market Value Share and BPS Analysis by Material, 2025 and 2035
  • Figure 67: Eastern Europe Market Y-o-Y Growth Comparison by Material, 2025 to 2035
  • Figure 68: Eastern Europe Market Attractiveness Analysis by Material
  • Figure 69: Eastern Europe Market Value Share and BPS Analysis by Product Type, 2025 and 2035
  • Figure 70: Eastern Europe Market Y-o-Y Growth Comparison by Product Type, 2025 to 2035
  • Figure 71: Eastern Europe Market Attractiveness Analysis by Product Type
  • Figure 72: Eastern Europe Market Value Share and BPS Analysis by Packaging, 2025 and 2035
  • Figure 73: Eastern Europe Market Y-o-Y Growth Comparison by Packaging, 2025 to 2035
  • Figure 74: Eastern Europe Market Attractiveness Analysis by Packaging
  • Figure 75: Eastern Europe Market Value Share and BPS Analysis by End-Use, 2025 and 2035
  • Figure 76: Eastern Europe Market Y-o-Y Growth Comparison by End-Use, 2025 to 2035
  • Figure 77: Eastern Europe Market Attractiveness Analysis by End-Use
  • Figure 78: East Asia Market Value Share and BPS Analysis by Country, 2025 and 2035
  • Figure 79: East Asia Market Value Share and BPS Analysis by Material, 2025 and 2035
  • Figure 80: East Asia Market Y-o-Y Growth Comparison by Material, 2025 to 2035
  • Figure 81: East Asia Market Attractiveness Analysis by Material
  • Figure 82: East Asia Market Value Share and BPS Analysis by Product Type, 2025 and 2035
  • Figure 83: East Asia Market Y-o-Y Growth Comparison by Product Type, 2025 to 2035
  • Figure 84: East Asia Market Attractiveness Analysis by Product Type
  • Figure 85: East Asia Market Value Share and BPS Analysis by Packaging, 2025 and 2035
  • Figure 86: East Asia Market Y-o-Y Growth Comparison by Packaging, 2025 to 2035
  • Figure 87: East Asia Market Attractiveness Analysis by Packaging
  • Figure 88: East Asia Market Value Share and BPS Analysis by End-Use, 2025 and 2035
  • Figure 89: East Asia Market Y-o-Y Growth Comparison by End-Use, 2025 to 2035
  • Figure 90: East Asia Market Attractiveness Analysis by End-Use
  • Figure 91: South Asia & Pacific Market Value Share and BPS Analysis by Country, 2025 and 2035
  • Figure 92: South Asia & Pacific Market Value Share and BPS Analysis by Material, 2025 and 2035
  • Figure 93: South Asia & Pacific Market Y-o-Y Growth Comparison by Material, 2025 to 2035
  • Figure 94: South Asia & Pacific Market Attractiveness Analysis by Material
  • Figure 95: South Asia & Pacific Market Value Share and BPS Analysis by Product Type, 2025 and 2035
  • Figure 96: South Asia & Pacific Market Y-o-Y Growth Comparison by Product Type, 2025 to 2035
  • Figure 97: South Asia & Pacific Market Attractiveness Analysis by Product Type
  • Figure 98: South Asia & Pacific Market Value Share and BPS Analysis by Packaging, 2025 and 2035
  • Figure 99: South Asia & Pacific Market Y-o-Y Growth Comparison by Packaging, 2025 to 2035
  • Figure 100: South Asia & Pacific Market Attractiveness Analysis by Packaging
  • Figure 101: South Asia & Pacific Market Value Share and BPS Analysis by End-Use, 2025 and 2035
  • Figure 102: South Asia & Pacific Market Y-o-Y Growth Comparison by End-Use, 2025 to 2035
  • Figure 103: South Asia & Pacific Market Attractiveness Analysis by End-Use
  • Figure 104: Middle East and Africa Market Value Share and BPS Analysis by Country, 2025 and 2035
  • Figure 105: Middle East and Africa Market Value Share and BPS Analysis by Material, 2025 and 2035
  • Figure 106: Middle East and Africa Market Y-o-Y Growth Comparison by Material, 2025 to 2035
  • Figure 107: Middle East and Africa Market Attractiveness Analysis by Material
  • Figure 108: Middle East and Africa Market Value Share and BPS Analysis by Product Type, 2025 and 2035
  • Figure 109: Middle East and Africa Market Y-o-Y Growth Comparison by Product Type, 2025 to 2035
  • Figure 110: Middle East and Africa Market Attractiveness Analysis by Product Type
  • Figure 111: Middle East and Africa Market Value Share and BPS Analysis by Packaging, 2025 and 2035
  • Figure 112: Middle East and Africa Market Y-o-Y Growth Comparison by Packaging, 2025 to 2035
  • Figure 113: Middle East and Africa Market Attractiveness Analysis by Packaging
  • Figure 114: Middle East and Africa Market Value Share and BPS Analysis by End-Use, 2025 and 2035
  • Figure 115: Middle East and Africa Market Y-o-Y Growth Comparison by End-Use, 2025 to 2035
  • Figure 116: Middle East and Africa Market Attractiveness Analysis by End-Use
  • Figure 117: Global Market - Tier Structure Analysis
  • Figure 118: Global Market - Company Share Analysis

Frequently Asked Questions

What is the projected market value of the Baby Food Packaging Market in 2025?

The projected market value of the Baby Food Packaging Market in 2025 is USD 77.13 billion.

What is the forecast market value of the Baby Food Packaging Market by 2035?

The forecast market value of the Baby Food Packaging Market by 2035 is USD 160.6 billion.

What is the expected CAGR for the Baby Food Packaging Market from 2025 to 2035?

The expected CAGR for the Baby Food Packaging Market from 2025 to 2035 is 6.6%.

Which segment will lead the Baby Food Packaging Market in 2025?

Plastic will lead the Baby Food Packaging Market in 2025 with a 40% market share.

Which region is expected to experience the highest growth in the Baby Food Packaging Market?

Asia Pacific, particularly India, is expected to be the key growth region for the Baby Food Packaging Market.

Explore Similar Insights

Future Market Insights

Baby Food Packaging Market