Baby Ear Thermometer Market Overview (2022 to 2032)

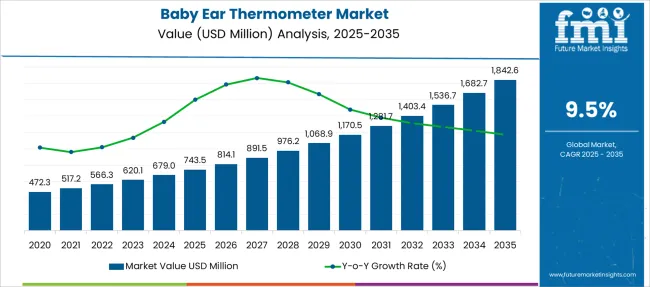
The baby ear thermometer market is expected to register a CAGR of 9.5% during the forecast period, up from USD 566.3 Million in 2022 to reach a valuation of USD 1403.42 Million by 2032.

The sales of baby ear thermometers are rising as they provide real-time tracking and help with health histories.

Attributes Details
Baby Ear Thermometer Market Value (2022) USD 566.3 Million
Baby Ear Thermometer Market Projected Value (2032) USD 1403.42 Million
Baby Ear Thermometer Market CAGR (2022 to 2032) 9.5%

Due to the increasing demand for baby ear thermometers, critical players in the baby ear thermometer market are under pressure to provide more efficient and accurate baby ear thermometers.

The increase in people's lifestyles, expansion in disposable income of the middle-class group, increase in working couples, and increased concern about baby health are all driving factors for the baby ear thermometer market share.

However, substituting normal thermometers, and the growth in raw material prices have been a continual limitation on the baby ear thermometer market. Some of the key baby ear thermometer market trends promoting the demand for baby ear thermometers include new smart thermometers that can communicate data over Wi-Fi and Bluetooth.

What are the Key Drivers to the Baby Ear Thermometer Market Share?

The sales of baby ear thermometers are rising due to their usefulness while checking the temperature of an infant and further treating the related illness. It detects the temperature generated by the eardrum and surrounding tissue.

The demand for baby ear thermometers is rising due to recent developments such as night light environment displays for convenient usage at night and pre-warmed tips for comfort and professional accuracy. Another factor propelling the sales of baby ear thermometers is built-in memory that allows you to track a baby's temperature over time.

The baby ear thermometer has numerous benefits that fuel the baby ear thermometer market expansion.

The key driver of the rising demand for baby ear thermometers is parents' care and readiness for their infant's health. Parental readiness has improved as a result of increasing demand for baby ear thermometers, fueling the baby ear thermometer market growth.

Due to the smart features and convenience, the demand for baby ear thermometers Is projected to rise during the forecast period. The baby ear thermometer market may restrain due to the limitations like ear infections in the baby.

Pulling on a baby's ear may make toddlers uncomfortable, and their wiggling may hinder the accuracy of a reading. Even so, most baby ear thermometers on the market are only suggested for infants older than six months. Market participants are likely to provide a technical solution to boost the growth of baby ear thermometers' market share.
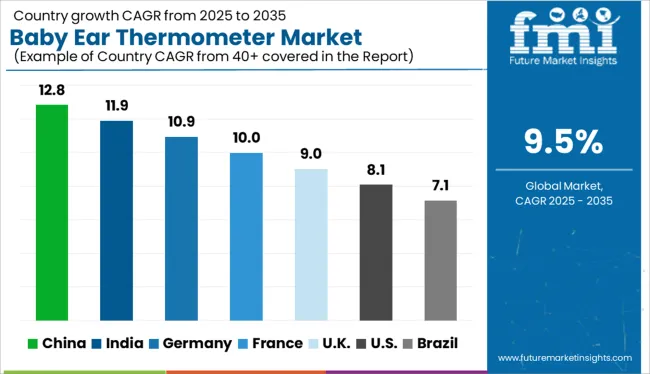
Which Region holds the Highest Growth Potential in the Baby Ear Thermometer Market?

Due to the large number of products available, the sales of baby ear thermometer is proliferating in Europe. The high awareness of baby ear thermometers and their user-friendliness has fueled the demand and sales of baby ear thermometers in North America, followed by Europe.

Thanks to a slew of new products, the demand for baby ear thermometers in Oceania has exploded in recent years. This, in turn, is anticipated to boost the sales of baby ear thermometers during the forecast period.

The most emerging markets for baby ear thermometers are expected to be East Asia and South Asia, as key players have focused on these countries due to the rising population and large number of youngsters. As a result of this, the sales of baby ear thermometer is projected to rise.

By increasing product awareness, the Middle East and Africa are expected to drive the baby ear thermometer market share. Furthermore, growing investments in the healthcare sector are fueling the Latin American market for baby ear thermometers.
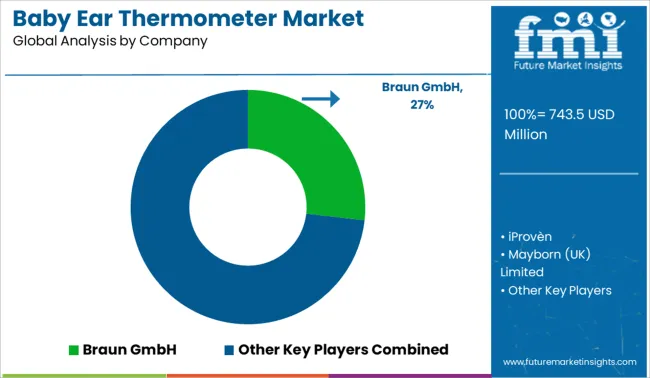
Who are the Key Players in the Baby Ear Thermometer Market?

Key players in the baby ear thermometer market have taken the efforts necessary to improve device accuracy and overall operation. The key players in the baby ear thermometer market have introduced new devices with enhanced temperature readings and smart connectivity. They have increased the gadgets' accuracy as well as their functionality for more efficient temperature detection.

Major players in the baby ear thermometer market are Braun GmbH, iProvèn, Mayborn (United Kingdom) Limited, First Years Inc., Safety 1st, SUMMER, Motorola, Kinsa, Inc., ANKOVO, Exergen Corporation, Cardinal Health, Bound Tree, Cherub Baby Australia, and among others.

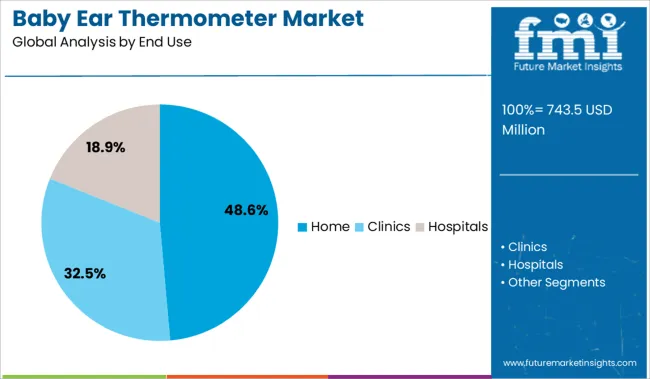
Baby ear thermometers are being used more frequently by parents at home. Due to various health-related difficulties in babies, more parents are purchasing smart baby thermometers for continuous monitoring of the baby's health.

  • Kinsa has created a baby ear thermometer ;that is built specifically for children and connects to the Kinsa app on a smartphone to keep track of temperature readings and monitor fever progression.
  • Braun GmbH's age-precision technology in baby ear thermometers has propelled market expansion to new heights.

Report Scope

Report Attribute Details
Growth rate CAGR of 9.5% from 2022 to 2032
The base year for estimation 2021
Historical data 2015 to 2020
Forecast period 2022 to 2032
Quantitative units Revenue in USD billion, volume in kilotons, and CAGR from 2022 to 2032
Report Coverage Revenue forecast, volume forecast, company ranking, competitive landscape, growth factors, and trends, Pricing Analysis
Segments Covered End use, price range, sales channel, age group, region
Regional scope North America; Western Europe; Eastern Europe; Middle East; Africa; ASEAN; South Asia; Rest of Asia; Australia; and New Zealand
Country scope USA, Canada, Mexico, Germany, United Kingdom, France, Italy, Spain, Russia, Belgium, Poland, Czech Republic, China, India, Japan, Australia, Brazil, Argentina, Colombia, Saudi Arabia, United Arab Emirates(UAE), Iran, South Africa
Key companies profiled Braun GmbH; iProvèn; Mayborn (United Kingdom) Limited; First Years Inc.; Safety 1st; SUMMER; Motorola; Kinsa, Inc.; ANKOVO; Exergen Corporation; Cardinal Health; Bound Tree; Cherub Baby Australia
Customization scope Free report customization (equivalent to up to 8 analysts' working days) with purchase. Addition or alteration to country, regional & segment scope.
Pricing and purchase options Avail customized purchase options to meet your exact research needs.

Key Segments

By End Use:

  • Home
  • Clinics
  • Hospitals

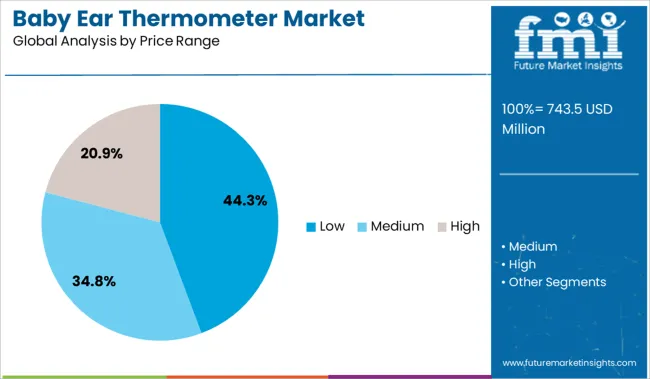
By Price Range:

  • Low
  • Medium
  • High

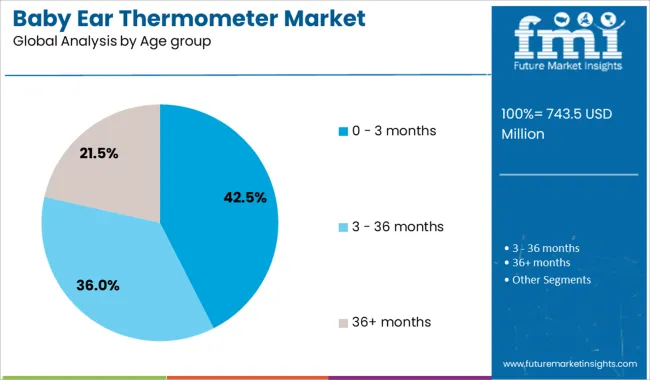
By Age group:

  • 0 - 3 months
  • 3 - 36 months
  • 36+ months

By Sales Channel:

  • Direct
  • Indirect
  • Independent Stores
  • Hypermarket/Supermarket
  • Specialty Stores
  • E-commerce
  • Others

By Region:

  • North America
  • Latin America
  • Asia Pacific
  • Middle East and Africa
  • Europe

Table of Content

  • 1. Executive Summary
  • 2. Market Overview
  • 3. Market Background
  • 4. Global Market Analysis 2017 to 2021 and Forecast, 2022 to 2032
  • 5. Global Market Analysis 2017 to 2021 and Forecast 2022 to 2032, By End Use
    • 5.1. Home
    • 5.2. Clinics and Hospitals
  • 6. Global Market Analysis 2017 to 2021 and Forecast 2022 to 2032, By Price Range
    • 6.1. Low
    • 6.2. Medium
    • 6.3. Premium
  • 7. Global Market Analysis 2017 to 2021 and Forecast 2022 to 2032, By Age group
    • 7.1. 0 - 3 months
    • 7.2. 3 - 36 months
    • 7.3. 36+ months
  • 8. Global Market Analysis 2017 to 2021 and Forecast 2022 to 2032, By Sales Channels
    • 8.1. Online
    • 8.2. Offline
  • 9. Global Market Analysis 2017 to 2021 and Forecast 2022 to 2032, By Region
    • 9.1. North America
    • 9.2. Latin America
    • 9.3. Europe
    • 9.4. East Asia
    • 9.5. South Asia
    • 9.6. Oceania
    • 9.7. Middle East and Africa
  • 10. North America Market Analysis 2017 to 2021 and Forecast 2022 to 2032, By Country
  • 11. Latin America Market Analysis 2017 to 2021 and Forecast 2022 to 2032, By Country
  • 12. Europe Market Analysis 2017 to 2021 and Forecast 2022 to 2032, By Country
  • 13. East Asia Market Analysis 2017 to 2021 and Forecast 2022 to 2032, By Country
  • 14. South Asia Market Analysis 2017 to 2021 and Forecast 2022 to 2032, By Country
  • 15. Oceania Market Analysis 2017 to 2021 and Forecast 2022 to 2032, By Country
  • 16. Middle East and Africa Market Analysis 2017 to 2021 and Forecast 2022 to 2032, By Country
  • 17. Key Countries Market Analysis
  • 18. Market Structure Analysis
  • 19. Competition Analysis
    • 19.1. Braun GmbH
    • 19.2. iProvèn
    • 19.3. Mayborn (UK) Limited
    • 19.4. First Years Inc.
    • 19.5. Safety 1st
    • 19.6. SUMMER
    • 19.7. Motorola
    • 19.8. Kinsa, Inc.
    • 19.9. ANKOVO, Exergen Corporation
    • 19.10. Cardinal Health
    • 19.11. Bound Tree
    • 19.12. Cherub Baby Australia
    • 19.13. Exergen
    • 19.14. De'Longhi
    • 19.15. Mayborn Group
  • 20. Assumptions & Acronyms Used
  • 21. Research Methodology

List of Tables

Table 1: Global Market Value (US$ Million) Forecast by Region, 2017 to 2032

Table 2: Global Market Volume Forecast by Region, 2017 to 2032

Table 3: Global Market Value (US$ Million) Forecast by End Use, 2017 to 2032

Table 4: Global Market Volume Forecast by End Use, 2017 to 2032

Table 5: Global Market Value (US$ Million) Forecast by Price Range, 2017 to 2032

Table 6: Global Market Volume Forecast by Price Range, 2017 to 2032

Table 7: Global Market Value (US$ Million) Forecast by Age Group, 2017 to 2032

Table 8: Global Market Volume Forecast by Age Group, 2017 to 2032

Table 9: Global Market Value (US$ Million) Forecast by Sales Channels, 2017 to 2032

Table 10: Global Market Volume Forecast by Sales Channels, 2017 to 2032

Table 11: North America Market Value (US$ Million) Forecast by Country, 2017 to 2032

Table 12: North America Market Volume Forecast by Country, 2017 to 2032

Table 13: North America Market Value (US$ Million) Forecast by End Use, 2017 to 2032

Table 14: North America Market Volume Forecast by End Use, 2017 to 2032

Table 15: North America Market Value (US$ Million) Forecast by Price Range, 2017 to 2032

Table 16: North America Market Volume Forecast by Price Range, 2017 to 2032

Table 17: North America Market Value (US$ Million) Forecast by Age Group, 2017 to 2032

Table 18: North America Market Volume Forecast by Age Group, 2017 to 2032

Table 19: North America Market Value (US$ Million) Forecast by Sales Channels, 2017 to 2032

Table 20: North America Market Volume Forecast by Sales Channels, 2017 to 2032

Table 21: Latin America Market Value (US$ Million) Forecast by Country, 2017 to 2032

Table 22: Latin America Market Volume Forecast by Country, 2017 to 2032

Table 23: Latin America Market Value (US$ Million) Forecast by End Use, 2017 to 2032

Table 24: Latin America Market Volume Forecast by End Use, 2017 to 2032

Table 25: Latin America Market Value (US$ Million) Forecast by Price Range, 2017 to 2032

Table 26: Latin America Market Volume Forecast by Price Range, 2017 to 2032

Table 27: Latin America Market Value (US$ Million) Forecast by Age Group, 2017 to 2032

Table 28: Latin America Market Volume Forecast by Age Group, 2017 to 2032

Table 29: Latin America Market Value (US$ Million) Forecast by Sales Channels, 2017 to 2032

Table 30: Latin America Market Volume Forecast by Sales Channels, 2017 to 2032

Table 31: Europe Market Value (US$ Million) Forecast by Country, 2017 to 2032

Table 32: Europe Market Volume Forecast by Country, 2017 to 2032

Table 33: Europe Market Value (US$ Million) Forecast by End Use, 2017 to 2032

Table 34: Europe Market Volume Forecast by End Use, 2017 to 2032

Table 35: Europe Market Value (US$ Million) Forecast by Price Range, 2017 to 2032

Table 36: Europe Market Volume Forecast by Price Range, 2017 to 2032

Table 37: Europe Market Value (US$ Million) Forecast by Age Group, 2017 to 2032

Table 38: Europe Market Volume Forecast by Age Group, 2017 to 2032

Table 39: Europe Market Value (US$ Million) Forecast by Sales Channels, 2017 to 2032

Table 40: Europe Market Volume Forecast by Sales Channels, 2017 to 2032

Table 41: East Asia Market Value (US$ Million) Forecast by Country, 2017 to 2032

Table 42: East Asia Market Volume Forecast by Country, 2017 to 2032

Table 43: East Asia Market Value (US$ Million) Forecast by End Use, 2017 to 2032

Table 44: East Asia Market Volume Forecast by End Use, 2017 to 2032

Table 45: East Asia Market Value (US$ Million) Forecast by Price Range, 2017 to 2032

Table 46: East Asia Market Volume Forecast by Price Range, 2017 to 2032

Table 47: East Asia Market Value (US$ Million) Forecast by Age Group, 2017 to 2032

Table 48: East Asia Market Volume Forecast by Age Group, 2017 to 2032

Table 49: East Asia Market Value (US$ Million) Forecast by Sales Channels, 2017 to 2032

Table 50: East Asia Market Volume Forecast by Sales Channels, 2017 to 2032

Table 51: South Asia Market Value (US$ Million) Forecast by Country, 2017 to 2032

Table 52: South Asia Market Volume Forecast by Country, 2017 to 2032

Table 53: South Asia Market Value (US$ Million) Forecast by End Use, 2017 to 2032

Table 54: South Asia Market Volume Forecast by End Use, 2017 to 2032

Table 55: South Asia Market Value (US$ Million) Forecast by Price Range, 2017 to 2032

Table 56: South Asia Market Volume Forecast by Price Range, 2017 to 2032

Table 57: South Asia Market Value (US$ Million) Forecast by Age Group, 2017 to 2032

Table 58: South Asia Market Volume Forecast by Age Group, 2017 to 2032

Table 59: South Asia Market Value (US$ Million) Forecast by Sales Channels, 2017 to 2032

Table 60: South Asia Market Volume Forecast by Sales Channels, 2017 to 2032

Table 61: Oceania Market Value (US$ Million) Forecast by Country, 2017 to 2032

Table 62: Oceania Market Volume Forecast by Country, 2017 to 2032

Table 63: Oceania Market Value (US$ Million) Forecast by End Use, 2017 to 2032

Table 64: Oceania Market Volume Forecast by End Use, 2017 to 2032

Table 65: Oceania Market Value (US$ Million) Forecast by Price Range, 2017 to 2032

Table 66: Oceania Market Volume Forecast by Price Range, 2017 to 2032

Table 67: Oceania Market Value (US$ Million) Forecast by Age Group, 2017 to 2032

Table 68: Oceania Market Volume Forecast by Age Group, 2017 to 2032

Table 69: Oceania Market Value (US$ Million) Forecast by Sales Channels, 2017 to 2032

Table 70: Oceania Market Volume Forecast by Sales Channels, 2017 to 2032

Table 71: MEA Market Value (US$ Million) Forecast by Country, 2017 to 2032

Table 72: MEA Market Volume Forecast by Country, 2017 to 2032

Table 73: MEA Market Value (US$ Million) Forecast by End Use, 2017 to 2032

Table 74: MEA Market Volume Forecast by End Use, 2017 to 2032

Table 75: MEA Market Value (US$ Million) Forecast by Price Range, 2017 to 2032

Table 76: MEA Market Volume Forecast by Price Range, 2017 to 2032

Table 77: MEA Market Value (US$ Million) Forecast by Age Group, 2017 to 2032

Table 78: MEA Market Volume Forecast by Age Group, 2017 to 2032

Table 79: MEA Market Value (US$ Million) Forecast by Sales Channels, 2017 to 2032

Table 80: MEA Market Volume Forecast by Sales Channels, 2017 to 2032

List of Figures

Figure 1: Global Market Value (US$ Million) by End Use, 2022 to 2032

Figure 2: Global Market Value (US$ Million) by Price Range, 2022 to 2032

Figure 3: Global Market Value (US$ Million) by Age Group, 2022 to 2032

Figure 4: Global Market Value (US$ Million) by Sales Channels, 2022 to 2032

Figure 5: Global Market Value (US$ Million) by Region, 2022 to 2032

Figure 6: Global Market Value (US$ Million) Analysis by Region, 2017 to 2032

Figure 7: Global Market Volume Analysis by Region, 2017 to 2032

Figure 8: Global Market Value Share (%) and BPS Analysis by Region, 2022 to 2032

Figure 9: Global Market Y-o-Y Growth (%) Projections by Region, 2022 to 2032

Figure 10: Global Market Value (US$ Million) Analysis by End Use, 2017 to 2032

Figure 11: Global Market Volume Analysis by End Use, 2017 to 2032

Figure 12: Global Market Value Share (%) and BPS Analysis by End Use, 2022 to 2032

Figure 13: Global Market Y-o-Y Growth (%) Projections by End Use, 2022 to 2032

Figure 14: Global Market Value (US$ Million) Analysis by Price Range,2017 to 2032

Figure 15: Global Market Volume Analysis by Price Range,2017 to 2032

Figure 16: Global Market Value Share (%) and BPS Analysis by Price Range,2022 to 2032

Figure 17: Global Market Y-o-Y Growth (%) Projections by Price Range,2022 to 2032

Figure 18: Global Market Value (US$ Million) Analysis by Age Group, 2017 to 2032

Figure 19: Global Market Volume Analysis by Age Group, 2017 to 2032

Figure 20: Global Market Value Share (%) and BPS Analysis by Age Group, 2022 to 2032

Figure 21: Global Market Y-o-Y Growth (%) Projections by Age Group, 2022 to 2032

Figure 22: Global Market Value (US$ Million) Analysis by Sales Channels, 2017 to 2032

Figure 23: Global Market Volume Analysis by Sales Channels, 2017 to 2032

Figure 24: Global Market Value Share (%) and BPS Analysis by Sales Channels, 2022 to 2032

Figure 25: Global Market Y-o-Y Growth (%) Projections by Sales Channels, 2022 to 2032

Figure 26: Global Market Attractiveness by End Use, 2022 to 2032

Figure 27: Global Market Attractiveness by Price Range,2022 to 2032

Figure 28: Global Market Attractiveness by Age Group, 2022 to 2032

Figure 29: Global Market Attractiveness by Sales Channels, 2022 to 2032

Figure 30: Global Market Attractiveness by Region, 2022 to 2032

Figure 31: North America Market Value (US$ Million) by End Use, 2022 to 2032

Figure 32: North America Market Value (US$ Million) by Price Range,2022 to 2032

Figure 33: North America Market Value (US$ Million) by Age Group, 2022 to 2032

Figure 34: North America Market Value (US$ Million) by Sales Channels, 2022 to 2032

Figure 35: North America Market Value (US$ Million) by Country, 2022 to 2032

Figure 36: North America Market Value (US$ Million) Analysis by Country, 2017 to 2032

Figure 37: North America Market Volume Analysis by Country, 2017 to 2032

Figure 38: North America Market Value Share (%) and BPS Analysis by Country, 2022 to 2032

Figure 39: North America Market Y-o-Y Growth (%) Projections by Country, 2022 to 2032

Figure 40: North America Market Value (US$ Million) Analysis by End Use, 2017 to 2032

Figure 41: North America Market Volume Analysis by End Use, 2017 to 2032

Figure 42: North America Market Value Share (%) and BPS Analysis by End Use, 2022 to 2032

Figure 43: North America Market Y-o-Y Growth (%) Projections by End Use, 2022 to 2032

Figure 44: North America Market Value (US$ Million) Analysis by Price Range,2017 to 2032

Figure 45: North America Market Volume Analysis by Price Range,2017 to 2032

Figure 46: North America Market Value Share (%) and BPS Analysis by Price Range,2022 to 2032

Figure 47: North America Market Y-o-Y Growth (%) Projections by Price Range,2022 to 2032

Figure 48: North America Market Value (US$ Million) Analysis by Age Group, 2017 to 2032

Figure 49: North America Market Volume Analysis by Age Group, 2017 to 2032

Figure 50: North America Market Value Share (%) and BPS Analysis by Age Group, 2022 to 2032

Figure 51: North America Market Y-o-Y Growth (%) Projections by Age Group, 2022 to 2032

Figure 52: North America Market Value (US$ Million) Analysis by Sales Channels, 2017 to 2032

Figure 53: North America Market Volume Analysis by Sales Channels, 2017 to 2032

Figure 54: North America Market Value Share (%) and BPS Analysis by Sales Channels, 2022 to 2032

Figure 55: North America Market Y-o-Y Growth (%) Projections by Sales Channels, 2022 to 2032

Figure 56: North America Market Attractiveness by End Use, 2022 to 2032

Figure 57: North America Market Attractiveness by Price Range,2022 to 2032

Figure 58: North America Market Attractiveness by Age Group, 2022 to 2032

Figure 59: North America Market Attractiveness by Sales Channels, 2022 to 2032

Figure 60: North America Market Attractiveness by Country, 2022 to 2032

Figure 61: Latin America Market Value (US$ Million) by End Use, 2022 to 2032

Figure 62: Latin America Market Value (US$ Million) by Price Range,2022 to 2032

Figure 63: Latin America Market Value (US$ Million) by Age Group, 2022 to 2032

Figure 64: Latin America Market Value (US$ Million) by Sales Channels, 2022 to 2032

Figure 65: Latin America Market Value (US$ Million) by Country, 2022 to 2032

Figure 66: Latin America Market Value (US$ Million) Analysis by Country, 2017 to 2032

Figure 67: Latin America Market Volume Analysis by Country, 2017 to 2032

Figure 68: Latin America Market Value Share (%) and BPS Analysis by Country, 2022 to 2032

Figure 69: Latin America Market Y-o-Y Growth (%) Projections by Country, 2022 to 2032

Figure 70: Latin America Market Value (US$ Million) Analysis by End Use, 2017 to 2032

Figure 71: Latin America Market Volume Analysis by End Use, 2017 to 2032

Figure 72: Latin America Market Value Share (%) and BPS Analysis by End Use, 2022 to 2032

Figure 73: Latin America Market Y-o-Y Growth (%) Projections by End Use, 2022 to 2032

Figure 74: Latin America Market Value (US$ Million) Analysis by Price Range,2017 to 2032

Figure 75: Latin America Market Volume Analysis by Price Range,2017 to 2032

Figure 76: Latin America Market Value Share (%) and BPS Analysis by Price Range,2022 to 2032

Figure 77: Latin America Market Y-o-Y Growth (%) Projections by Price Range,2022 to 2032

Figure 78: Latin America Market Value (US$ Million) Analysis by Age Group, 2017 to 2032

Figure 79: Latin America Market Volume Analysis by Age Group, 2017 to 2032

Figure 80: Latin America Market Value Share (%) and BPS Analysis by Age Group, 2022 to 2032

Figure 81: Latin America Market Y-o-Y Growth (%) Projections by Age Group, 2022 to 2032

Figure 82: Latin America Market Value (US$ Million) Analysis by Sales Channels, 2017 to 2032

Figure 83: Latin America Market Volume Analysis by Sales Channels, 2017 to 2032

Figure 84: Latin America Market Value Share (%) and BPS Analysis by Sales Channels, 2022 to 2032

Figure 85: Latin America Market Y-o-Y Growth (%) Projections by Sales Channels, 2022 to 2032

Figure 86: Latin America Market Attractiveness by End Use, 2022 to 2032

Figure 87: Latin America Market Attractiveness by Price Range,2022 to 2032

Figure 88: Latin America Market Attractiveness by Age Group, 2022 to 2032

Figure 89: Latin America Market Attractiveness by Sales Channels, 2022 to 2032

Figure 90: Latin America Market Attractiveness by Country, 2022 to 2032

Figure 91: Europe Market Value (US$ Million) by End Use, 2022 to 2032

Figure 92: Europe Market Value (US$ Million) by Price Range,2022 to 2032

Figure 93: Europe Market Value (US$ Million) by Age Group, 2022 to 2032

Figure 94: Europe Market Value (US$ Million) by Sales Channels, 2022 to 2032

Figure 95: Europe Market Value (US$ Million) by Country, 2022 to 2032

Figure 96: Europe Market Value (US$ Million) Analysis by Country, 2017 to 2032

Figure 97: Europe Market Volume Analysis by Country, 2017 to 2032

Figure 98: Europe Market Value Share (%) and BPS Analysis by Country, 2022 to 2032

Figure 99: Europe Market Y-o-Y Growth (%) Projections by Country, 2022 to 2032

Figure 100: Europe Market Value (US$ Million) Analysis by End Use, 2017 to 2032

Figure 101: Europe Market Volume Analysis by End Use, 2017 to 2032

Figure 102: Europe Market Value Share (%) and BPS Analysis by End Use, 2022 to 2032

Figure 103: Europe Market Y-o-Y Growth (%) Projections by End Use, 2022 to 2032

Figure 104: Europe Market Value (US$ Million) Analysis by Price Range,2017 to 2032

Figure 105: Europe Market Volume Analysis by Price Range,2017 to 2032

Figure 106: Europe Market Value Share (%) and BPS Analysis by Price Range,2022 to 2032

Figure 107: Europe Market Y-o-Y Growth (%) Projections by Price Range,2022 to 2032

Figure 108: Europe Market Value (US$ Million) Analysis by Age Group, 2017 to 2032

Figure 109: Europe Market Volume Analysis by Age Group, 2017 to 2032

Figure 110: Europe Market Value Share (%) and BPS Analysis by Age Group, 2022 to 2032

Figure 111: Europe Market Y-o-Y Growth (%) Projections by Age Group, 2022 to 2032

Figure 112: Europe Market Value (US$ Million) Analysis by Sales Channels, 2017 to 2032

Figure 113: Europe Market Volume Analysis by Sales Channels, 2017 to 2032

Figure 114: Europe Market Value Share (%) and BPS Analysis by Sales Channels, 2022 to 2032

Figure 115: Europe Market Y-o-Y Growth (%) Projections by Sales Channels, 2022 to 2032

Figure 116: Europe Market Attractiveness by End Use, 2022 to 2032

Figure 117: Europe Market Attractiveness by Price Range,2022 to 2032

Figure 118: Europe Market Attractiveness by Age Group, 2022 to 2032

Figure 119: Europe Market Attractiveness by Sales Channels, 2022 to 2032

Figure 120: Europe Market Attractiveness by Country, 2022 to 2032

Figure 121: East Asia Market Value (US$ Million) by End Use, 2022 to 2032

Figure 122: East Asia Market Value (US$ Million) by Price Range,2022 to 2032

Figure 123: East Asia Market Value (US$ Million) by Age Group, 2022 to 2032

Figure 124: East Asia Market Value (US$ Million) by Sales Channels, 2022 to 2032

Figure 125: East Asia Market Value (US$ Million) by Country, 2022 to 2032

Figure 126: East Asia Market Value (US$ Million) Analysis by Country, 2017 to 2032

Figure 127: East Asia Market Volume Analysis by Country, 2017 to 2032

Figure 128: East Asia Market Value Share (%) and BPS Analysis by Country, 2022 to 2032

Figure 129: East Asia Market Y-o-Y Growth (%) Projections by Country, 2022 to 2032

Figure 130: East Asia Market Value (US$ Million) Analysis by End Use, 2017 to 2032

Figure 131: East Asia Market Volume Analysis by End Use, 2017 to 2032

Figure 132: East Asia Market Value Share (%) and BPS Analysis by End Use, 2022 to 2032

Figure 133: East Asia Market Y-o-Y Growth (%) Projections by End Use, 2022 to 2032

Figure 134: East Asia Market Value (US$ Million) Analysis by Price Range,2017 to 2032

Figure 135: East Asia Market Volume Analysis by Price Range,2017 to 2032

Figure 136: East Asia Market Value Share (%) and BPS Analysis by Price Range,2022 to 2032

Figure 137: East Asia Market Y-o-Y Growth (%) Projections by Price Range,2022 to 2032

Figure 138: East Asia Market Value (US$ Million) Analysis by Age Group, 2017 to 2032

Figure 139: East Asia Market Volume Analysis by Age Group, 2017 to 2032

Figure 140: East Asia Market Value Share (%) and BPS Analysis by Age Group, 2022 to 2032

Figure 141: East Asia Market Y-o-Y Growth (%) Projections by Age Group, 2022 to 2032

Figure 142: East Asia Market Value (US$ Million) Analysis by Sales Channels, 2017 to 2032

Figure 143: East Asia Market Volume Analysis by Sales Channels, 2017 to 2032

Figure 144: East Asia Market Value Share (%) and BPS Analysis by Sales Channels, 2022 to 2032

Figure 145: East Asia Market Y-o-Y Growth (%) Projections by Sales Channels, 2022 to 2032

Figure 146: East Asia Market Attractiveness by End Use, 2022 to 2032

Figure 147: East Asia Market Attractiveness by Price Range,2022 to 2032

Figure 148: East Asia Market Attractiveness by Age Group, 2022 to 2032

Figure 149: East Asia Market Attractiveness by Sales Channels, 2022 to 2032

Figure 150: East Asia Market Attractiveness by Country, 2022 to 2032

Figure 151: South Asia Market Value (US$ Million) by End Use, 2022 to 2032

Figure 152: South Asia Market Value (US$ Million) by Price Range,2022 to 2032

Figure 153: South Asia Market Value (US$ Million) by Age Group, 2022 to 2032

Figure 154: South Asia Market Value (US$ Million) by Sales Channels, 2022 to 2032

Figure 155: South Asia Market Value (US$ Million) by Country, 2022 to 2032

Figure 156: South Asia Market Value (US$ Million) Analysis by Country, 2017 to 2032

Figure 157: South Asia Market Volume Analysis by Country, 2017 to 2032

Figure 158: South Asia Market Value Share (%) and BPS Analysis by Country, 2022 to 2032

Figure 159: South Asia Market Y-o-Y Growth (%) Projections by Country, 2022 to 2032

Figure 160: South Asia Market Value (US$ Million) Analysis by End Use, 2017 to 2032

Figure 161: South Asia Market Volume Analysis by End Use, 2017 to 2032

Figure 162: South Asia Market Value Share (%) and BPS Analysis by End Use, 2022 to 2032

Figure 163: South Asia Market Y-o-Y Growth (%) Projections by End Use, 2022 to 2032

Figure 164: South Asia Market Value (US$ Million) Analysis by Price Range,2017 to 2032

Figure 165: South Asia Market Volume Analysis by Price Range,2017 to 2032

Figure 166: South Asia Market Value Share (%) and BPS Analysis by Price Range,2022 to 2032

Figure 167: South Asia Market Y-o-Y Growth (%) Projections by Price Range,2022 to 2032

Figure 168: South Asia Market Value (US$ Million) Analysis by Age Group, 2017 to 2032

Figure 169: South Asia Market Volume Analysis by Age Group, 2017 to 2032

Figure 170: South Asia Market Value Share (%) and BPS Analysis by Age Group, 2022 to 2032

Figure 171: South Asia Market Y-o-Y Growth (%) Projections by Age Group, 2022 to 2032

Figure 172: South Asia Market Value (US$ Million) Analysis by Sales Channels, 2017 to 2032

Figure 173: South Asia Market Volume Analysis by Sales Channels, 2017 to 2032

Figure 174: South Asia Market Value Share (%) and BPS Analysis by Sales Channels, 2022 to 2032

Figure 175: South Asia Market Y-o-Y Growth (%) Projections by Sales Channels, 2022 to 2032

Figure 176: South Asia Market Attractiveness by End Use, 2022 to 2032

Figure 177: South Asia Market Attractiveness by Price Range,2022 to 2032

Figure 178: South Asia Market Attractiveness by Age Group, 2022 to 2032

Figure 179: South Asia Market Attractiveness by Sales Channels, 2022 to 2032

Figure 180: South Asia Market Attractiveness by Country, 2022 to 2032

Figure 181: Oceania Market Value (US$ Million) by End Use, 2022 to 2032

Figure 182: Oceania Market Value (US$ Million) by Price Range,2022 to 2032

Figure 183: Oceania Market Value (US$ Million) by Age Group, 2022 to 2032

Figure 184: Oceania Market Value (US$ Million) by Sales Channels, 2022 to 2032

Figure 185: Oceania Market Value (US$ Million) by Country, 2022 to 2032

Figure 186: Oceania Market Value (US$ Million) Analysis by Country, 2017 to 2032

Figure 187: Oceania Market Volume Analysis by Country, 2017 to 2032

Figure 188: Oceania Market Value Share (%) and BPS Analysis by Country, 2022 to 2032

Figure 189: Oceania Market Y-o-Y Growth (%) Projections by Country, 2022 to 2032

Figure 190: Oceania Market Value (US$ Million) Analysis by End Use, 2017 to 2032

Figure 191: Oceania Market Volume Analysis by End Use, 2017 to 2032

Figure 192: Oceania Market Value Share (%) and BPS Analysis by End Use, 2022 to 2032

Figure 193: Oceania Market Y-o-Y Growth (%) Projections by End Use, 2022 to 2032

Figure 194: Oceania Market Value (US$ Million) Analysis by Price Range,2017 to 2032

Figure 195: Oceania Market Volume Analysis by Price Range,2017 to 2032

Figure 196: Oceania Market Value Share (%) and BPS Analysis by Price Range,2022 to 2032

Figure 197: Oceania Market Y-o-Y Growth (%) Projections by Price Range,2022 to 2032

Figure 198: Oceania Market Value (US$ Million) Analysis by Age Group, 2017 to 2032

Figure 199: Oceania Market Volume Analysis by Age Group, 2017 to 2032

Figure 200: Oceania Market Value Share (%) and BPS Analysis by Age Group, 2022 to 2032

Figure 201: Oceania Market Y-o-Y Growth (%) Projections by Age Group, 2022 to 2032

Figure 202: Oceania Market Value (US$ Million) Analysis by Sales Channels, 2017 to 2032

Figure 203: Oceania Market Volume Analysis by Sales Channels, 2017 to 2032

Figure 204: Oceania Market Value Share (%) and BPS Analysis by Sales Channels, 2022 to 2032

Figure 205: Oceania Market Y-o-Y Growth (%) Projections by Sales Channels, 2022 to 2032

Figure 206: Oceania Market Attractiveness by End Use, 2022 to 2032

Figure 207: Oceania Market Attractiveness by Price Range,2022 to 2032

Figure 208: Oceania Market Attractiveness by Age Group, 2022 to 2032

Figure 209: Oceania Market Attractiveness by Sales Channels, 2022 to 2032

Figure 210: Oceania Market Attractiveness by Country, 2022 to 2032

Figure 211: MEA Market Value (US$ Million) by End Use, 2022 to 2032

Figure 212: MEA Market Value (US$ Million) by Price Range,2022 to 2032

Figure 213: MEA Market Value (US$ Million) by Age Group, 2022 to 2032

Figure 214: MEA Market Value (US$ Million) by Sales Channels, 2022 to 2032

Figure 215: MEA Market Value (US$ Million) by Country, 2022 to 2032

Figure 216: MEA Market Value (US$ Million) Analysis by Country, 2017 to 2032

Figure 217: MEA Market Volume Analysis by Country, 2017 to 2032

Figure 218: MEA Market Value Share (%) and BPS Analysis by Country, 2022 to 2032

Figure 219: MEA Market Y-o-Y Growth (%) Projections by Country, 2022 to 2032

Figure 220: MEA Market Value (US$ Million) Analysis by End Use, 2017 to 2032

Figure 221: MEA Market Volume Analysis by End Use, 2017 to 2032

Figure 222: MEA Market Value Share (%) and BPS Analysis by End Use, 2022 to 2032

Figure 223: MEA Market Y-o-Y Growth (%) Projections by End Use, 2022 to 2032

Figure 224: MEA Market Value (US$ Million) Analysis by Price Range,2017 to 2032

Figure 225: MEA Market Volume Analysis by Price Range,2017 to 2032

Figure 226: MEA Market Value Share (%) and BPS Analysis by Price Range,2022 to 2032

Figure 227: MEA Market Y-o-Y Growth (%) Projections by Price Range,2022 to 2032

Figure 228: MEA Market Value (US$ Million) Analysis by Age Group, 2017 to 2032

Figure 229: MEA Market Volume Analysis by Age Group, 2017 to 2032

Figure 230: MEA Market Value Share (%) and BPS Analysis by Age Group, 2022 to 2032

Figure 231: MEA Market Y-o-Y Growth (%) Projections by Age Group, 2022 to 2032

Figure 232: MEA Market Value (US$ Million) Analysis by Sales Channels, 2017 to 2032

Figure 233: MEA Market Volume Analysis by Sales Channels, 2017 to 2032

Figure 234: MEA Market Value Share (%) and BPS Analysis by Sales Channels, 2022 to 2032

Figure 235: MEA Market Y-o-Y Growth (%) Projections by Sales Channels, 2022 to 2032

Figure 236: MEA Market Attractiveness by End Use, 2022 to 2032

Figure 237: MEA Market Attractiveness by Price Range,2022 to 2032

Figure 238: MEA Market Attractiveness by Age Group, 2022 to 2032

Figure 239: MEA Market Attractiveness by Sales Channels, 2022 to 2032

Figure 240: MEA Market Attractiveness by Country, 2022 to 2032

Frequently Asked Questions

What is the Growth Outlook for the Baby Ear Thermometer Market?

The baby ear thermometer market is likely to register a CAGR of 9.5% during the forecast period.

Who are the Key Players in the Baby Ear Thermometer Market?

Key players holding substantial baby ear thermometer market share include Braun GmbH, iProvèn, Mayborn (United Kingdom) Limited, First Years Inc., Safety 1st, SUMMER, Motorola, Kinsa, Inc., ANKOVO, Exergen Corporation, Cardinal Health, Bound Tree, Cherub Baby Australia.

What is the Future of the Baby Ear Thermometer Market?

As per the analysis, the baby ear thermometer market share is likely to be USD 1403.42 Million by 2032.

Which is the Key Driver in the Baby Ear Thermometer Market?

Demand for baby ear thermometers is anticipated to grow due to the smart features and convenience provided by baby ear thermometers.

Explore Similar Insights

Future Market Insights

Baby Ear Thermometer Market