Baby Milk Market Size and Share Forecast Outlook 2025 to 2035

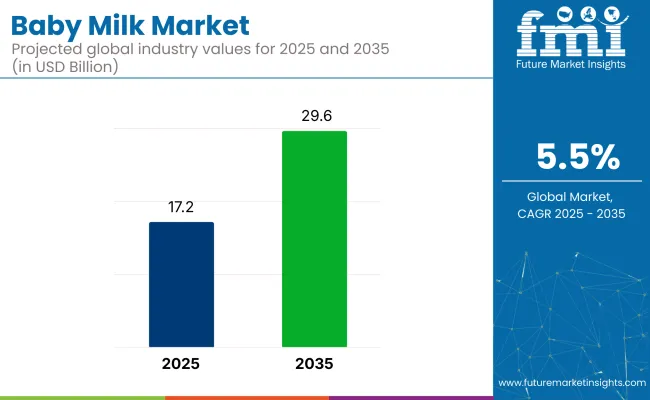
The global baby milk market is set to experience significant growth, expanding from USD 17.2 billion in 2025 to USD 29.6 billion by 2035, registering a CAGR of 5.5% during the forecast period. This expansion is fuelled by increasing awareness regarding infant nutrition, rising disposable incomes, and growing parental demand for high-quality, fortified infant milk products across both developing and developed economies.
Quick Stats of Baby Milk Market

  • Market Value (2025): USD 17.2 billion
  • Forecast Value (2035): USD 29.6 billion
  • Forecast CAGR: 5.5%
  • Leading Segment in 2025: Infant formula for babies aged 0-6 months (~32.5% share)
  • Key Growth Region: Asia Pacific (India)
  • Top Key Players: Arla Foods amba, Ausnutria Dairy Corporation Ltd., Abbott Laboratories, Bellamy's Organic, Nestlé S.A.

Baby Milk Market

Consumers are progressively opting for organic, non-GMO, and functional infant milk formulas that offer additional health benefits, such as probiotics, DHA, and nucleotides, aimed at boosting immunity, digestion, and cognitive development in infants.

A noteworthy development in this direction occurred in July and September 2023, when Danone Early Life Nutrition officially announced its plan to introduce an innovative infant formula in China. This product features milk phospholipid-coated lipid droplets that closely mimic the structure of human breast milk, under the trademark Nuturis™.

This innovation, disclosed during the Growth Asia Summit 2023 by Danone’s Vice President and reported by Food Business Africa and Nutra Ingredients Asia, highlights the company’s strategy to address the growing Chinese demand for scientifically advanced baby nutrition solutions.

Regionally, Asia Pacific is anticipated to be the fastest-growing market due to rising birth rates, rapid urbanization, and heightened awareness of infant health. Major economies such as China and India are leading this demand surge. Meanwhile, North America and Europe remain mature yet essential markets, characterized by consumer preference for organic and premium infant milk products. These regions continue to invest in research and product development to meet evolving parental expectations for safety, quality, and enhanced nutritional benefits.

Analysing Baby Milk Market by Top Investment Segment

The industry is led by infant formula (0 - 6 months), carbohydrates, powder form, cow milk-based sources, conventional products, and hypermarkets, driven by affordability, nutrition focus, and rising urban retail infrastructure.

Infant Formula (0-6 months) Leads Product Type Segment

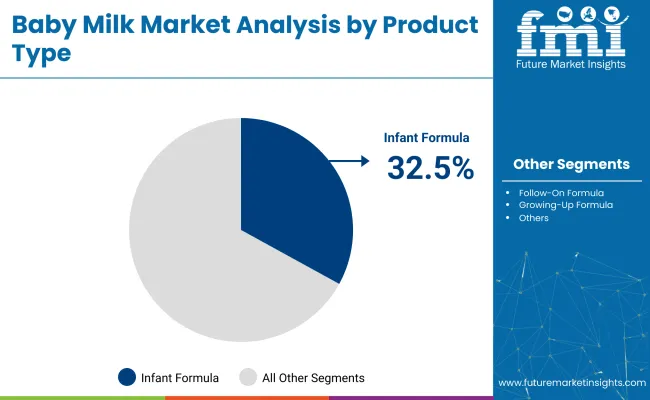
Infant formula for babies aged 0 - 6 months remains the leading product type, accounting for 32.5% of the market share in 2025.The rise in working mothers and demand for convenient feeding solutions have significantly fuelled the growth of this segment.
Baby Milk Market Analysis By Product Type

  • Manufacturers focus on enhancing nutritional profiles by adding fatty acids, probiotics, and vitamins that closely mimic breast milk’s composition. Growing health awareness among parents, especially in emerging economies, drives preference for fortified infant formulas.
  • Despite the growing interest in follow-on formulas, the 0 - 6 months segment is expected to sustain its lead due to rising birth rates and improvements in product formulation and safety standards.

Carbohydrates Dominate Ingredient Type

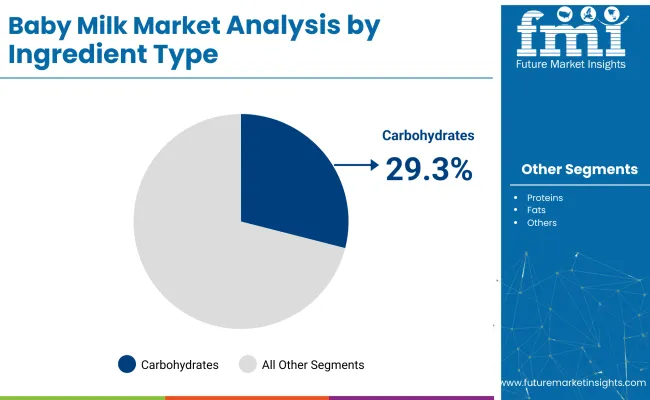
Carbohydrates dominate the ingredient type segment, holding a 29.3% market share in 2025. As the essential energy source for infants, carbohydrates play a critical role in supporting early development, including brain function and growth.
Baby Milk Market Analysis By Ingredient Type

  • Most infant formulas are formulated with lactose to mimic the carbohydrate content of breast milk, meeting infants' nutritional requirements effectively. Moreover, specialized carbohydrate blends are incorporated to cater to infants with lactose intolerance or unique dietary needs.
  • The increasing parental awareness of early nutrition, combined with demand for functional and easily digestible ingredients, ensures that carbohydrate inclusion in infant milk products will continue to lead ingredient preferences across global markets.

Powder Form Tops the Form Segment

Powder form continues to lead the form segment, contributing 68.4% of the global industry share in 2025. This preference stems from powder products’ affordability, longer shelf life, and ease of storage compared to liquid alternatives.

  • Caregivers appreciate the flexibility of powder formula preparation, allowing customized portioning to reduce wastage and meet infants' specific nutritional demands. Manufacturers benefit from lower transportation and production costs, further driving powder form’s dominance.
  • While ready-to-feed and liquid concentrate options gain attention in premium markets, the powder segment’s practicality and cost-effectiveness ensure its sustained leadership, especially in price-sensitive and developing regions where value-driven purchasing decisions prevail.

Cow Milk-Based Sources Lead the Source Segment

Cow milk-based baby formulas dominate the source segment, representing 80.1% of the market share in 2025. Cow milk remains a preferred base due to its rich protein, fat, and nutrient content essential for infant development.

  • Innovations in processing have lowered cow milk allergenicity, making such products safer and widely acceptable among infants. Although plant-based alternatives attract vegan and lactose-intolerant consumers, these still constitute a niche market due to higher costs and limited availability in certain regions.
  • Cow milk-based formulations continue their market leadership globally, favored for affordability, nutritional completeness, and established trust among parents across both developed and developing economies alike.

Hypermarkets & Supermarkets Lead Distribution Channel

Hypermarkets and supermarkets lead the distribution channel segment, accounting for 42.6% of the market share in 2025. These retail outlets attract consumers due to their extensive variety of baby milk brands, product types, and immediate availability.

  • Promotional offers, price discounts, and value packs drive consumer footfall, especially among cost-conscious buyers. The rise of modern retail infrastructure, particularly in urbanizing regions of Asia-Pacific and Latin America, further bolsters this segment’s growth.
  • Although online channels and specialty baby stores are expanding rapidly, hypermarkets and supermarkets remain the primary shopping destination for infant milk products, thanks to their convenience, accessibility, and broad consumer trust.

Top Baby Milk Market Dynamics

Premiumisation and plant-based innovation are reshaping the industry. Brands are launching high-end and specialty formulas with clean-label ingredients and functional nutrients to meet evolving parental demands.

Premiumisation Trend Fueled by Parents Choosing High-Quality Nutrition

Premium infant milk formulas are gaining traction as parents opt for high-quality and specialized nutrition. Nestlé has executed a premiumisation strategy amid declining birth rates, emphasizing higher-end SKUs like NAN and Illuma, while maintaining affordability in mass-market segments.

Bobbie, a USA-based brand, launched organic European-style formula to address labeling concerns and gained retail presence during the formula shortage. These shifts reflect consumer preference toward trusted, transparent brands. As fewer children are born per household, spending on premium infant nutrition continues to rise.

Innovation in Plant-Based and Specialty Formulations Driving Market Diversity

Demand for plant-based and allergen-free formulas has accelerated due to dietary sensitivities and sustainability concerns. Else Nutrition introduced a dairy- and soy-free plant-based infant formula made from almonds, buckwheat, and tapioca, targeting USA families seeking clean-label alternatives.

Danone’s Dairy & Plants Blend formula combined soy and dairy proteins to cater to vegetarian preferences and reduce carbon footprint. These innovations support growing interest in lactose-free and hypoallergenic options. The inclusion of probiotics, HMO, and omega-3 fatty acids is being pursued for immune and cognitive benefits.

Top Countries Manufacturing, Innovating, Distributing, and Regulating Baby Milk

The market study identifies key trends across more than 30 countries. Producers operating in top opportunist nations can align their strategies based on formulation innovation, nutritional enhancement, distribution improvements, and evolving consumer preferences.
Country Wise Analysis Of Baby Milk Market

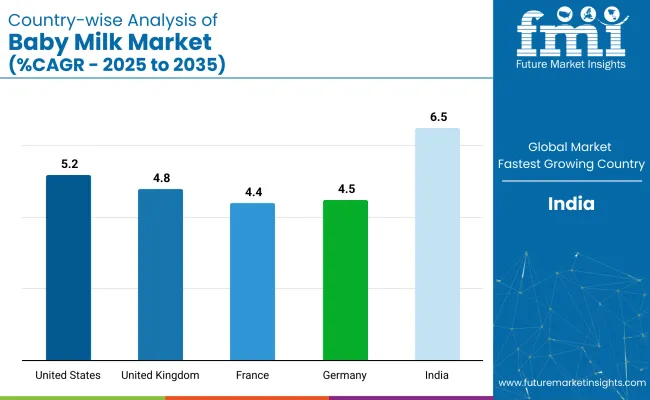
Countries CAGR (2025 to 2035)
United States 5.2%
United Kingdom 4.8%
France 4.4%
Germany 4.5%
India 6.5%

Baby Milk Market Analysis in United States

The United States industry is set to grow at a CAGR of 5.2% from 2025 to 2035. Rising awareness of infant nutrition and demand for organic, non-GMO, and additive-free formulas fuel this growth.

  • Leading companies such as Abbott Nutrition and Mead Johnson focus on enriching their offerings with DHA, ARA, and prebiotics to meet the health preferences of American parents.
  • Regulatory support from the FDA ensures product safety, while the growing popularity of e-commerce platforms expands consumer access.

United Kingdom Baby Milk Market Analysis and Growth

The United Kingdom industry is projected to register a CAGR of 4.8% from 2025 to 2035. Increasing preference for clean-label, hypoallergenic, and organic infant milk drives demand.

  • British parents seek lactose-free and plant-based options, pushing brands like Danone and Kendamil to innovate with fortified, allergen-friendly products. The government’s support for infant health and nutrition enhances consumer confidence.
  • Distribution channels such as supermarket chains and pharmacies make these products widely available, contributing to market expansion

In Depth Analysis of France Baby Milk Market

Baby milk market in france is estimated to grow at a CAGR of 4.4% between 2025 and 2035. The market benefits from French consumers' strong preference for high-quality, nutritious, and traceable food products.

  • Brands like Laboratoires Picot and Biostime are focusing on formulations rich in probiotics, essential fatty acids, and minerals to meet health-conscious parenting needs. Additionally, national campaigns promoting organic and fortified baby nutrition support market demand.
  • The French inclination towards natural and gourmet infant foods, combined with stringent food safety standards, ensures a steady market trajectory.

Germany Baby Milk Market Trends

German industry is set to expand at a 4.5% CAGR between 2025 and 2035. With a well-established organic culture and stringent quality standards, the demand for safe, nutrient-rich baby milk products remains high.

  • Brands like HiPP and Holle lead with organic-certified, minimally processed milk formulas, aligning with German parents' focus on sustainability and purity. Increasing demand for biodynamic and traceable ingredients reinforces brand loyalty and market expansion.
  • These trends, along with government policies supporting healthy infant nutrition, contribute to the steady growth trajectory of the infant milk market in Germany.

India Baby Milk Market Analysis and growth

Indian industry is expected to grow at the fastest rate globally, with a 6.5% CAGR from 2025 to 2035. This growth is driven by rising disposable incomes, urbanization, and increased awareness of infant nutrition, especially among the middle class.

  • Key players like Amul, Nestlé, Abbott Nutrition, Danone, Mead Johnson, Lactalis, Himalaya Drug Company, Parag Milk Foods, FrieslandCampina, and Amway India are offering affordable, fortified formulas tailored to local nutritional needs.
  • Government initiatives supporting maternal and child health further boost market growth, particularly in semi-urban and rural regions, ensuring continued expansion of India’s infant milk market.

Leading Baby Milk Market Players

The industry is moderately fragmented, with Leading players like Nestlé S.A., Danone S.A., and Reckitt Benckiser (Mead Johnson) holding significant shares through vast product lines, strong branding, and global distribution. These leaders prioritize advanced formulations, clinical trials, and nutritional science-backed innovations to sustain dominance.

Emerging companies such as Bubs Australia, Bobbie, and ByHeart cater to specialized demands like organic, goat milk-based, and clean-label formulas. Growing consumer interest in human milk oligosaccharides (HMOs), A2 protein, and probiotics is driving product innovation.
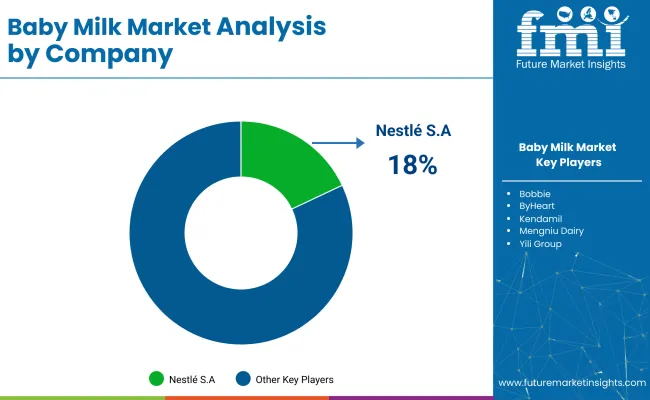
Baby Milk Market Analysis By Company

Recent Baby Milk Market News

  • In February 2025, the UK’s Competition and Markets Authority (CMA) proposed reforms in the infant milk market, including standardized hospital packaging, clearer nutritional labeling, and loyalty points to reduce costs, potentially saving UK parents up to £300 annually on baby formula.
  • In April 2025, Nestlé India announced an investment of ₹65 billion (USD 780 million) to enhance baby nutrition capabilities.
  • Parag Milk Foods reported a 16.22% increase in net sales for FY 2025, totaling ₹918.25 crore (USD 110 million). However, rising costs affected earnings, and in May 2025, the company announced the cessation of two independent directors.

Key Baby Milk Market Players

  • Arla Foods amba
  • Ausnutria Dairy Corporation Ltd.
  • Abbott Laboratories
  • Bellamy's Organic
  • Biostime (H&H Group)
  • Bobbie
  • Bubs Australia Limited
  • ByHeart
  • China Feihe Limited
  • Danone S.A.
  • FrieslandCampina N.V.
  • Hipp GmbH & Co. Vertrieb KG
  • Holle Baby Food AG
  • Kendamil
  • Mengniu Dairy
  • Morinaga Milk Industry Co., Ltd.
  • Nestlé S.A.
  • Perrigo Company plc
  • Reckitt Benckiser Group plc (Mead Johnson)
  • Yili Group

Research Coverage and Scope Summary

Report Attributes Details
Market Size (2025E) USD 17.2 billion
Projected Market Size (2035F) USD 29.6 billion
CAGR (2025 to 2035) 5.5%
Base Year for Estimation 2024
Historical Period 2020 to 2024
Projection Period 2025 to 2035
Quantitative Units USD billion for value & thousand units for volume
By Product Type (Segment 1) Infant Formula (0 - 6 months), Follow-on Formula (6 - 12 months), Growing-up Formula (12 - 36 months), Specialty Baby Formula, Hypoallergenic Formula, Lactose-free Formula, Premature Baby Formula, Other Specialty Formulas
By Ingredient Type (Segment 2) Carbohydrates, Fats, Proteins, Vitamins & Minerals, Prebiotics & Probiotics, Others
By Form (Segment 3) Powder, Liquid Concentrate, Ready-to-feed
By Source (Segment 4) Cow Milk Based, Soy Based, Goat Milk Based, Other Plant-based Alternatives
By Distribution Channel (Segment 5 ) Hypermarkets & Supermarkets, Pharmacies & Drug Stores, Convenience Stores, Online Retail, E-commerce Platforms, Direct-to-consumer Websites, Subscription Services, Specialty Stores, Others
Regions Covered North America, Europe, Asia Pacific, Latin America, Middle East & Africa
Countries Covered USA, Canada, Germany, UK, France, Italy, Spain, China, India, Japan, Australia, South Korea, Brazil, Mexico, Argentina, Saudi Arabia, South Africa, UAE
Key Players Influencing the Market Arla Foods amba , Ausnutria Dairy Corporation Ltd., Abbott Laboratories, Bellamy's Organic, Biostime (H&H Group), Bobbie, Bubs Australia Limited, ByHeart , China Feihe Limited, Danone S.A., FrieslandCampina N.V., Hipp GmbH & Co. Vertrieb KG, Holle Baby Food AG, Kendamil , Mengniu Dairy, Morinaga Milk Industry Co., Ltd., Nestlé S.A., Perrigo Company plc, Reckitt Benckiser Group plc (Mead Johnson), Yili Group
Additional Attributes Dollar sales, share, segment-wise growth of organic and plant-based formulas, online channel penetration trends, innovations in human milk oligosaccharides (HMOs), sustainability-driven packaging adoption

Key Segments

By Product Type:

The market is segmented into infant formula (0-6 months), follow-on formula (6-12 months), growing-up formula (12-36 months), specialty baby formula, hypoallergenic formula, lactose-free formula, premature baby formula, and other specialty formulas.

By Ingredient Type:

The market includes carbohydrates, fats, proteins, vitamins & minerals, prebiotics & probiotics, and others.

By Form:

The market is divided into powder, liquid concentrate, and ready-to-feed.

By Source:

The market comprises cow milk-based, soy-based, goat milk-based, and other plant-based alternatives.

By Distribution Channel:

The market includes hypermarkets & supermarkets, pharmacies & drug stores, convenience stores, online retail, e-commerce platforms, direct-to-consumer websites, subscription services, specialty stores, and others.

By Region:

The market is categorized into North America, Europe, Asia Pacific,Latin America (and Middle East & Africa.

Table of Content

  1. Executive Summary
  2. Market Overview
  3. Market Background
  4. Global Market Analysis 2020 to 2024 and Forecast, 2025 to 2035
  5. Global Market Pricing Analysis 2020 to 2024 and Forecast 2025 to 2035
  6. Global Market Analysis 2020 to 2024 and Forecast 2025 to 2035, By Product Type
    • Infant formula (0-6 months)
    • Follow-on formula (6-12 months)
    • Growing-up formula (12-36 months)
    • Specialty baby formula
    • Hypoallergenic formula
    • Lactose-free formula
    • Premature baby formula
    • Other specialty formulas
  7. Global Market Analysis 2020 to 2024 and Forecast 2025 to 2035, By Ingredient Type
    • Carbohydrates
    • Fats
    • Proteins
    • Vitamins & minerals
    • Prebiotics & probiotics
    • Others
  8. Global Market Analysis 2020 to 2024 and Forecast 2025 to 2035, By Form
    • Powder
    • Liquid concentrate
    • Ready-to-feed
  9. Global Market Analysis 2020 to 2024 and Forecast 2025 to 2035, By Source
    • Cow milk-based
    • Soy-based
    • Goat milk-based
    • Other plant-based alternatives
  10. Global Market Analysis 2020 to 2024 and Forecast 2025 to 2035, By Distribution Channel
    • Hypermarkets & supermarkets
    • Pharmacies & drug stores
    • Convenience stores
    • Online retail
    • E-commerce platforms
    • Direct-to-consumer websites
    • Subscription services
    • Specialty stores
    • Others
  11. Global Market Analysis 2020 to 2024 and Forecast 2025 to 2035, By Region
    • North America
    • Latin America
    • Western Europe
    • Eastern Europe
    • East Asia
    • South Asia & Pacific
    • Middle East and Africa
  12. North America Market Analysis 2020 to 2024 and Forecast 2025 to 2035, By Country
  13. Latin America Market Analysis 2020 to 2024 and Forecast 2025 to 2035, By Country
  14. Western Europe Market Analysis 2020 to 2024 and Forecast 2025 to 2035, By Country
  15. Eastern Europe Market Analysis 2020 to 2024 and Forecast 2025 to 2035, By Country
  16. East Asia Market Analysis 2020 to 2024 and Forecast 2025 to 2035, By Country
  17. South Asia & Pacific Market Analysis 2020 to 2024 and Forecast 2025 to 2035, By Country
  18. Middle East and Africa Market Analysis 2020 to 2024 and Forecast 2025 to 2035, By Country
  19. Key Countries Market Analysis
  20. Market Structure Analysis
  21. Competition Analysis
    • Arla Foods amba
    • Ausnutria Dairy Corporation Ltd.
    • Abbott Laboratories
    • Bellamy's Organic
    • Biostime (H&H Group)
    • Bobbie
    • Bubs Australia Limited
    • ByHeart
    • China Feihe Limited
    • Danone S.A.
    • FrieslandCampina N.V.
    • Hipp GmbH & Co. Vertrieb KG
    • Holle Baby Food AG
    • Kendamil
    • Mengniu Dairy
    • Morinaga Milk Industry Co., Ltd.
    • Nestlé S.A.
    • Perrigo Company plc
    • Reckitt Benckiser Group plc (Mead Johnson)
    • Yili Group
  22. Assumptions & Acronyms Used
  23. Research Methodology

List of Tables

  • Table 1: Global Market Value (USD Billion) Forecast by Region, 2020 to 2035
  • Table 2: Global Market Volume (Thousand Unit) Forecast by Region, 2020 to 2035
  • Table 3: Global Market Value (USD Billion) Forecast by Product Type, 2020 to 2035
  • Table 4: Global Market Volume (Thousand Unit) Forecast by Product Type, 2020 to 2035
  • Table 5: Global Market Value (USD Billion) Forecast by Ingredient Type, 2020 to 2035
  • Table 6: Global Market Volume (Thousand Unit) Forecast by Ingredient Type, 2020 to 2035
  • Table 7: Global Market Value (USD Billion) Forecast by Form, 2020 to 2035
  • Table 8: Global Market Volume (Thousand Unit) Forecast by Form, 2020 to 2035
  • Table 9: Global Market Value (USD Billion) Forecast by Source, 2020 to 2035
  • Table 10: Global Market Volume (Thousand Unit) Forecast by Source, 2020 to 2035
  • Table 11: Global Market Value (USD Billion) Forecast by Distribution Channel, 2020 to 2035
  • Table 12: Global Market Volume (Thousand Unit) Forecast by Distribution Channel, 2020 to 2035
  • Table 13: North America Market Value (USD Billion) Forecast by Country, 2020 to 2035
  • Table 14: North America Market Volume (Thousand Unit) Forecast by Country, 2020 to 2035
  • Table 15: North America Market Value (USD Billion) Forecast by Product Type, 2020 to 2035
  • Table 16: North America Market Volume (Thousand Unit) Forecast by Product Type, 2020 to 2035
  • Table 17: North America Market Value (USD Billion) Forecast by Ingredient Type, 2020 to 2035
  • Table 18: North America Market Volume (Thousand Unit) Forecast by Ingredient Type, 2020 to 2035
  • Table 19: North America Market Value (USD Billion) Forecast by Form, 2020 to 2035
  • Table 20: North America Market Volume (Thousand Unit) Forecast by Form, 2020 to 2035
  • Table 21: North America Market Value (USD Billion) Forecast by Source, 2020 to 2035
  • Table 22: North America Market Volume (Thousand Unit) Forecast by Source, 2020 to 2035
  • Table 23: North America Market Value (USD Billion) Forecast by Distribution Channel, 2020 to 2035
  • Table 24: North America Market Volume (Thousand Unit) Forecast by Distribution Channel, 2020 to 2035
  • Table 25: Latin America Market Value (USD Billion) Forecast by Country, 2020 to 2035
  • Table 26: Latin America Market Volume (Thousand Unit) Forecast by Country, 2020 to 2035
  • Table 27: Latin America Market Value (USD Billion) Forecast by Product Type, 2020 to 2035
  • Table 28: Latin America Market Volume (Thousand Unit) Forecast by Product Type, 2020 to 2035
  • Table 29: Latin America Market Value (USD Billion) Forecast by Ingredient Type, 2020 to 2035
  • Table 30: Latin America Market Volume (Thousand Unit) Forecast by Ingredient Type, 2020 to 2035
  • Table 31: Latin America Market Value (USD Billion) Forecast by Form, 2020 to 2035
  • Table 32: Latin America Market Volume (Thousand Unit) Forecast by Form, 2020 to 2035
  • Table 33: Latin America Market Value (USD Billion) Forecast by Source, 2020 to 2035
  • Table 34: Latin America Market Volume (Thousand Unit) Forecast by Source, 2020 to 2035
  • Table 35: Latin America Market Value (USD Billion) Forecast by Distribution Channel, 2020 to 2035
  • Table 36: Latin America Market Volume (Thousand Unit) Forecast by Distribution Channel, 2020 to 2035
  • Table 37: Western Europe Market Value (USD Billion) Forecast by Country, 2020 to 2035
  • Table 38: Western Europe Market Volume (Thousand Unit) Forecast by Country, 2020 to 2035
  • Table 39: Western Europe Market Value (USD Billion) Forecast by Product Type, 2020 to 2035
  • Table 40: Western Europe Market Volume (Thousand Unit) Forecast by Product Type, 2020 to 2035
  • Table 41: Western Europe Market Value (USD Billion) Forecast by Ingredient Type, 2020 to 2035
  • Table 42: Western Europe Market Volume (Thousand Unit) Forecast by Ingredient Type, 2020 to 2035
  • Table 43: Western Europe Market Value (USD Billion) Forecast by Form, 2020 to 2035
  • Table 44: Western Europe Market Volume (Thousand Unit) Forecast by Form, 2020 to 2035
  • Table 45: Western Europe Market Value (USD Billion) Forecast by Source, 2020 to 2035
  • Table 46: Western Europe Market Volume (Thousand Unit) Forecast by Source, 2020 to 2035
  • Table 47: Western Europe Market Value (USD Billion) Forecast by Distribution Channel, 2020 to 2035
  • Table 48: Western Europe Market Volume (Thousand Unit) Forecast by Distribution Channel, 2020 to 2035
  • Table 49: Eastern Europe Market Value (USD Billion) Forecast by Country, 2020 to 2035
  • Table 50: Eastern Europe Market Volume (Thousand Unit) Forecast by Country, 2020 to 2035
  • Table 51: Eastern Europe Market Value (USD Billion) Forecast by Product Type, 2020 to 2035
  • Table 52: Eastern Europe Market Volume (Thousand Unit) Forecast by Product Type, 2020 to 2035
  • Table 53: Eastern Europe Market Value (USD Billion) Forecast by Ingredient Type, 2020 to 2035
  • Table 54: Eastern Europe Market Volume (Thousand Unit) Forecast by Ingredient Type, 2020 to 2035
  • Table 55: Eastern Europe Market Value (USD Billion) Forecast by Form, 2020 to 2035
  • Table 56: Eastern Europe Market Volume (Thousand Unit) Forecast by Form, 2020 to 2035
  • Table 57: Eastern Europe Market Value (USD Billion) Forecast by Source, 2020 to 2035
  • Table 58: Eastern Europe Market Volume (Thousand Unit) Forecast by Source, 2020 to 2035
  • Table 59: Eastern Europe Market Value (USD Billion) Forecast by Distribution Channel, 2020 to 2035
  • Table 60: Eastern Europe Market Volume (Thousand Unit) Forecast by Distribution Channel, 2020 to 2035
  • Table 61: East Asia Market Value (USD Billion) Forecast by Country, 2020 to 2035
  • Table 62: East Asia Market Volume (Thousand Unit) Forecast by Country, 2020 to 2035
  • Table 63: East Asia Market Value (USD Billion) Forecast by Product Type, 2020 to 2035
  • Table 64: East Asia Market Volume (Thousand Unit) Forecast by Product Type, 2020 to 2035
  • Table 65: East Asia Market Value (USD Billion) Forecast by Ingredient Type, 2020 to 2035
  • Table 66: East Asia Market Volume (Thousand Unit) Forecast by Ingredient Type, 2020 to 2035
  • Table 67: East Asia Market Value (USD Billion) Forecast by Form, 2020 to 2035
  • Table 68: East Asia Market Volume (Thousand Unit) Forecast by Form, 2020 to 2035
  • Table 69: East Asia Market Value (USD Billion) Forecast by Source, 2020 to 2035
  • Table 70: East Asia Market Volume (Thousand Unit) Forecast by Source, 2020 to 2035
  • Table 71: East Asia Market Value (USD Billion) Forecast by Distribution Channel, 2020 to 2035
  • Table 72: East Asia Market Volume (Thousand Unit) Forecast by Distribution Channel, 2020 to 2035
  • Table 73: South Asia & Pacific Market Value (USD Billion) Forecast by Country, 2020 to 2035
  • Table 74: South Asia & Pacific Market Volume (Thousand Unit) Forecast by Country, 2020 to 2035
  • Table 75: South Asia & Pacific Market Value (USD Billion) Forecast by Product Type, 2020 to 2035
  • Table 76: South Asia & Pacific Market Volume (Thousand Unit) Forecast by Product Type, 2020 to 2035
  • Table 77: South Asia & Pacific Market Value (USD Billion) Forecast by Ingredient Type, 2020 to 2035
  • Table 78: South Asia & Pacific Market Volume (Thousand Unit) Forecast by Ingredient Type, 2020 to 2035
  • Table 79: South Asia & Pacific Market Value (USD Billion) Forecast by Form, 2020 to 2035
  • Table 80: South Asia & Pacific Market Volume (Thousand Unit) Forecast by Form, 2020 to 2035
  • Table 81: South Asia & Pacific Market Value (USD Billion) Forecast by Source, 2020 to 2035
  • Table 82: South Asia & Pacific Market Volume (Thousand Unit) Forecast by Source, 2020 to 2035
  • Table 83: South Asia & Pacific Market Value (USD Billion) Forecast by Distribution Channel, 2020 to 2035
  • Table 84: South Asia & Pacific Market Volume (Thousand Unit) Forecast by Distribution Channel, 2020 to 2035
  • Table 85: Middle East and Africa Market Value (USD Billion) Forecast by Country, 2020 to 2035
  • Table 86: Middle East and Africa Market Volume (Thousand Unit) Forecast by Country, 2020 to 2035
  • Table 87: Middle East and Africa Market Value (USD Billion) Forecast by Product Type, 2020 to 2035
  • Table 88: Middle East and Africa Market Volume (Thousand Unit) Forecast by Product Type, 2020 to 2035
  • Table 89: Middle East and Africa Market Value (USD Billion) Forecast by Ingredient Type, 2020 to 2035
  • Table 90: Middle East and Africa Market Volume (Thousand Unit) Forecast by Ingredient Type, 2020 to 2035
  • Table 91: Middle East and Africa Market Value (USD Billion) Forecast by Form, 2020 to 2035
  • Table 92: Middle East and Africa Market Volume (Thousand Unit) Forecast by Form, 2020 to 2035
  • Table 93: Middle East and Africa Market Value (USD Billion) Forecast by Source, 2020 to 2035
  • Table 94: Middle East and Africa Market Volume (Thousand Unit) Forecast by Source, 2020 to 2035
  • Table 95: Middle East and Africa Market Value (USD Billion) Forecast by Distribution Channel, 2020 to 2035
  • Table 96: Middle East and Africa Market Volume (Thousand Unit) Forecast by Distribution Channel, 2020 to 2035

List of Figures

  • Figure 1: Global Market Volume (Thousand Unit) Forecast 2020 to 2035
  • Figure 2: Global Market Pricing Analysis
  • Figure 3: Global Market Value (USD Billion) Forecast 2020 to 2035
  • Figure 4: Global Market Value Share and BPS Analysis by Product Type, 2025 and 2035
  • Figure 5: Global Market Y-o-Y Growth Comparison by Product Type, 2025 to 2035
  • Figure 6: Global Market Attractiveness Analysis by Product Type
  • Figure 7: Global Market Value Share and BPS Analysis by Ingredient Type, 2025 and 2035
  • Figure 8: Global Market Y-o-Y Growth Comparison by Ingredient Type, 2025 to 2035
  • Figure 9: Global Market Attractiveness Analysis by Ingredient Type
  • Figure 10: Global Market Value Share and BPS Analysis by Form, 2025 and 2035
  • Figure 11: Global Market Y-o-Y Growth Comparison by Form, 2025 to 2035
  • Figure 12: Global Market Attractiveness Analysis by Form
  • Figure 13: Global Market Value Share and BPS Analysis by Source, 2025 and 2035
  • Figure 14: Global Market Y-o-Y Growth Comparison by Source, 2025 to 2035
  • Figure 15: Global Market Attractiveness Analysis by Source
  • Figure 16: Global Market Value Share and BPS Analysis by Distribution Channel, 2025 and 2035
  • Figure 17: Global Market Y-o-Y Growth Comparison by Distribution Channel, 2025 to 2035
  • Figure 18: Global Market Attractiveness Analysis by Distribution Channel
  • Figure 19: Global Market Value (USD Billion) Share and BPS Analysis by Region, 2025 and 2035
  • Figure 20: Global Market Y-o-Y Growth Comparison by Region, 2025 to 2035
  • Figure 21: Global Market Attractiveness Analysis by Region
  • Figure 22: North America Market Incremental USD Opportunity, 2025 to 2035
  • Figure 23: Latin America Market Incremental USD Opportunity, 2025 to 2035
  • Figure 24: Western Europe Market Incremental USD Opportunity, 2025 to 2035
  • Figure 25: Eastern Europe Market Incremental USD Opportunity, 2025 to 2035
  • Figure 26: East Asia Market Incremental USD Opportunity, 2025 to 2035
  • Figure 27: South Asia & Pacific Market Incremental USD Opportunity, 2025 to 2035
  • Figure 28: Middle East and Africa Market Incremental USD Opportunity, 2025 to 2035
  • Figure 29: North America Market Value Share and BPS Analysis by Country, 2025 and 2035
  • Figure 30: North America Market Value Share and BPS Analysis by Product Type, 2025 and 2035
  • Figure 31: North America Market Y-o-Y Growth Comparison by Product Type, 2025 to 2035
  • Figure 32: North America Market Attractiveness Analysis by Product Type
  • Figure 33: North America Market Value Share and BPS Analysis by Ingredient Type, 2025 and 2035
  • Figure 34: North America Market Y-o-Y Growth Comparison by Ingredient Type, 2025 to 2035
  • Figure 35: North America Market Attractiveness Analysis by Ingredient Type
  • Figure 36: North America Market Value Share and BPS Analysis by Form, 2025 and 2035
  • Figure 37: North America Market Y-o-Y Growth Comparison by Form, 2025 to 2035
  • Figure 38: North America Market Attractiveness Analysis by Form
  • Figure 39: North America Market Value Share and BPS Analysis by Source, 2025 and 2035
  • Figure 40: North America Market Y-o-Y Growth Comparison by Source, 2025 to 2035
  • Figure 41: North America Market Attractiveness Analysis by Source
  • Figure 42: North America Market Value Share and BPS Analysis by Distribution Channel, 2025 and 2035
  • Figure 43: North America Market Y-o-Y Growth Comparison by Distribution Channel, 2025 to 2035
  • Figure 44: North America Market Attractiveness Analysis by Distribution Channel
  • Figure 45: Latin America Market Value Share and BPS Analysis by Country, 2025 and 2035
  • Figure 46: Latin America Market Value Share and BPS Analysis by Product Type, 2025 and 2035
  • Figure 47: Latin America Market Y-o-Y Growth Comparison by Product Type, 2025 to 2035
  • Figure 48: Latin America Market Attractiveness Analysis by Product Type
  • Figure 49: Latin America Market Value Share and BPS Analysis by Ingredient Type, 2025 and 2035
  • Figure 50: Latin America Market Y-o-Y Growth Comparison by Ingredient Type, 2025 to 2035
  • Figure 51: Latin America Market Attractiveness Analysis by Ingredient Type
  • Figure 52: Latin America Market Value Share and BPS Analysis by Form, 2025 and 2035
  • Figure 53: Latin America Market Y-o-Y Growth Comparison by Form, 2025 to 2035
  • Figure 54: Latin America Market Attractiveness Analysis by Form
  • Figure 55: Latin America Market Value Share and BPS Analysis by Source, 2025 and 2035
  • Figure 56: Latin America Market Y-o-Y Growth Comparison by Source, 2025 to 2035
  • Figure 57: Latin America Market Attractiveness Analysis by Source
  • Figure 58: Latin America Market Value Share and BPS Analysis by Distribution Channel, 2025 and 2035
  • Figure 59: Latin America Market Y-o-Y Growth Comparison by Distribution Channel, 2025 to 2035
  • Figure 60: Latin America Market Attractiveness Analysis by Distribution Channel
  • Figure 61: Western Europe Market Value Share and BPS Analysis by Country, 2025 and 2035
  • Figure 62: Western Europe Market Value Share and BPS Analysis by Product Type, 2025 and 2035
  • Figure 63: Western Europe Market Y-o-Y Growth Comparison by Product Type, 2025 to 2035
  • Figure 64: Western Europe Market Attractiveness Analysis by Product Type
  • Figure 65: Western Europe Market Value Share and BPS Analysis by Ingredient Type, 2025 and 2035
  • Figure 66: Western Europe Market Y-o-Y Growth Comparison by Ingredient Type, 2025 to 2035
  • Figure 67: Western Europe Market Attractiveness Analysis by Ingredient Type
  • Figure 68: Western Europe Market Value Share and BPS Analysis by Form, 2025 and 2035
  • Figure 69: Western Europe Market Y-o-Y Growth Comparison by Form, 2025 to 2035
  • Figure 70: Western Europe Market Attractiveness Analysis by Form
  • Figure 71: Western Europe Market Value Share and BPS Analysis by Source, 2025 and 2035
  • Figure 72: Western Europe Market Y-o-Y Growth Comparison by Source, 2025 to 2035
  • Figure 73: Western Europe Market Attractiveness Analysis by Source
  • Figure 74: Western Europe Market Value Share and BPS Analysis by Distribution Channel, 2025 and 2035
  • Figure 75: Western Europe Market Y-o-Y Growth Comparison by Distribution Channel, 2025 to 2035
  • Figure 76: Western Europe Market Attractiveness Analysis by Distribution Channel
  • Figure 77: Eastern Europe Market Value Share and BPS Analysis by Country, 2025 and 2035
  • Figure 78: Eastern Europe Market Value Share and BPS Analysis by Product Type, 2025 and 2035
  • Figure 79: Eastern Europe Market Y-o-Y Growth Comparison by Product Type, 2025 to 2035
  • Figure 80: Eastern Europe Market Attractiveness Analysis by Product Type
  • Figure 81: Eastern Europe Market Value Share and BPS Analysis by Ingredient Type, 2025 and 2035
  • Figure 82: Eastern Europe Market Y-o-Y Growth Comparison by Ingredient Type, 2025 to 2035
  • Figure 83: Eastern Europe Market Attractiveness Analysis by Ingredient Type
  • Figure 84: Eastern Europe Market Value Share and BPS Analysis by Form, 2025 and 2035
  • Figure 85: Eastern Europe Market Y-o-Y Growth Comparison by Form, 2025 to 2035
  • Figure 86: Eastern Europe Market Attractiveness Analysis by Form
  • Figure 87: Eastern Europe Market Value Share and BPS Analysis by Source, 2025 and 2035
  • Figure 88: Eastern Europe Market Y-o-Y Growth Comparison by Source, 2025 to 2035
  • Figure 89: Eastern Europe Market Attractiveness Analysis by Source
  • Figure 90: Eastern Europe Market Value Share and BPS Analysis by Distribution Channel, 2025 and 2035
  • Figure 91: Eastern Europe Market Y-o-Y Growth Comparison by Distribution Channel, 2025 to 2035
  • Figure 92: Eastern Europe Market Attractiveness Analysis by Distribution Channel
  • Figure 93: East Asia Market Value Share and BPS Analysis by Country, 2025 and 2035
  • Figure 94: East Asia Market Value Share and BPS Analysis by Product Type, 2025 and 2035
  • Figure 95: East Asia Market Y-o-Y Growth Comparison by Product Type, 2025 to 2035
  • Figure 96: East Asia Market Attractiveness Analysis by Product Type
  • Figure 97: East Asia Market Value Share and BPS Analysis by Ingredient Type, 2025 and 2035
  • Figure 98: East Asia Market Y-o-Y Growth Comparison by Ingredient Type, 2025 to 2035
  • Figure 99: East Asia Market Attractiveness Analysis by Ingredient Type
  • Figure 100: East Asia Market Value Share and BPS Analysis by Form, 2025 and 2035
  • Figure 101: East Asia Market Y-o-Y Growth Comparison by Form, 2025 to 2035
  • Figure 102: East Asia Market Attractiveness Analysis by Form
  • Figure 103: East Asia Market Value Share and BPS Analysis by Source, 2025 and 2035
  • Figure 104: East Asia Market Y-o-Y Growth Comparison by Source, 2025 to 2035
  • Figure 105: East Asia Market Attractiveness Analysis by Source
  • Figure 106: East Asia Market Value Share and BPS Analysis by Distribution Channel, 2025 and 2035
  • Figure 107: East Asia Market Y-o-Y Growth Comparison by Distribution Channel, 2025 to 2035
  • Figure 108: East Asia Market Attractiveness Analysis by Distribution Channel
  • Figure 109: South Asia & Pacific Market Value Share and BPS Analysis by Country, 2025 and 2035
  • Figure 110: South Asia & Pacific Market Value Share and BPS Analysis by Product Type, 2025 and 2035
  • Figure 111: South Asia & Pacific Market Y-o-Y Growth Comparison by Product Type, 2025 to 2035
  • Figure 112: South Asia & Pacific Market Attractiveness Analysis by Product Type
  • Figure 113: South Asia & Pacific Market Value Share and BPS Analysis by Ingredient Type, 2025 and 2035
  • Figure 114: South Asia & Pacific Market Y-o-Y Growth Comparison by Ingredient Type, 2025 to 2035
  • Figure 115: South Asia & Pacific Market Attractiveness Analysis by Ingredient Type
  • Figure 116: South Asia & Pacific Market Value Share and BPS Analysis by Form, 2025 and 2035
  • Figure 117: South Asia & Pacific Market Y-o-Y Growth Comparison by Form, 2025 to 2035
  • Figure 118: South Asia & Pacific Market Attractiveness Analysis by Form
  • Figure 119: South Asia & Pacific Market Value Share and BPS Analysis by Source, 2025 and 2035
  • Figure 120: South Asia & Pacific Market Y-o-Y Growth Comparison by Source, 2025 to 2035
  • Figure 121: South Asia & Pacific Market Attractiveness Analysis by Source
  • Figure 122: South Asia & Pacific Market Value Share and BPS Analysis by Distribution Channel, 2025 and 2035
  • Figure 123: South Asia & Pacific Market Y-o-Y Growth Comparison by Distribution Channel, 2025 to 2035
  • Figure 124: South Asia & Pacific Market Attractiveness Analysis by Distribution Channel
  • Figure 125: Middle East and Africa Market Value Share and BPS Analysis by Country, 2025 and 2035
  • Figure 126: Middle East and Africa Market Value Share and BPS Analysis by Product Type, 2025 and 2035
  • Figure 127: Middle East and Africa Market Y-o-Y Growth Comparison by Product Type, 2025 to 2035
  • Figure 128: Middle East and Africa Market Attractiveness Analysis by Product Type
  • Figure 129: Middle East and Africa Market Value Share and BPS Analysis by Ingredient Type, 2025 and 2035
  • Figure 130: Middle East and Africa Market Y-o-Y Growth Comparison by Ingredient Type, 2025 to 2035
  • Figure 131: Middle East and Africa Market Attractiveness Analysis by Ingredient Type
  • Figure 132: Middle East and Africa Market Value Share and BPS Analysis by Form, 2025 and 2035
  • Figure 133: Middle East and Africa Market Y-o-Y Growth Comparison by Form, 2025 to 2035
  • Figure 134: Middle East and Africa Market Attractiveness Analysis by Form
  • Figure 135: Middle East and Africa Market Value Share and BPS Analysis by Source, 2025 and 2035
  • Figure 136: Middle East and Africa Market Y-o-Y Growth Comparison by Source, 2025 to 2035
  • Figure 137: Middle East and Africa Market Attractiveness Analysis by Source
  • Figure 138: Middle East and Africa Market Value Share and BPS Analysis by Distribution Channel, 2025 and 2035
  • Figure 139: Middle East and Africa Market Y-o-Y Growth Comparison by Distribution Channel, 2025 to 2035
  • Figure 140: Middle East and Africa Market Attractiveness Analysis by Distribution Channel
  • Figure 141: Global Market - Tier Structure Analysis
  • Figure 142: Global Market - Company Share Analysis

Frequently Asked Questions

What is the projected market size of the baby milk market by 2035?

The market is forecasted to reach USD 29.6 billion by 2035.

What is the estimated CAGR of the baby milk market from 2025 to 2035?

The market is anticipated to grow at a CAGR of 5.5% during the period 2025 to 2035.

What is the expected market size of the baby milk market in 2025?

The Market is estimated to reach USD 18.9 billion in 2025.

Which product segment holds the largest share in the baby milk market by 2025?

Infant formula for babies aged 0-6 months is expected to hold a 32.5% share in 2025.

Which region shows the highest growth potential in the baby milk market?

Asia Pacific, led by India, is expected to be the key growth region with a 6.5% CAGR.

Explore Food Supplement and Nutrition Insights

Future Market Insights

Baby Milk Market