The Baby Bath and Shower Products Market is estimated to be valued at USD 3.4 billion in 2025 and is projected to reach USD 6.9 billion by 2035, registering a compound annual growth rate (CAGR) of 7.2% over the forecast period.
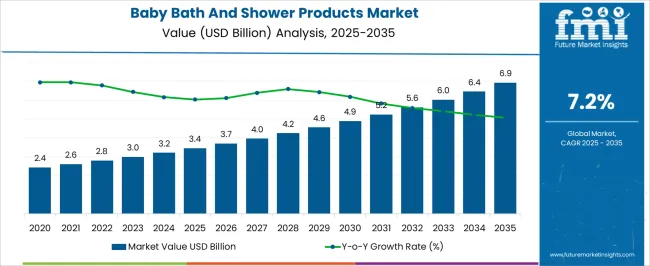
| Metric | Value |
|---|---|
| Baby Bath and Shower Products Market Estimated Value in (2025 E) | USD 3.4 billion |
| Baby Bath and Shower Products Market Forecast Value in (2035 F) | USD 6.9 billion |
| Forecast CAGR (2025 to 2035) | 7.2% |
The baby bath and shower products market is experiencing consistent growth as parents increasingly prioritize safety, skin friendliness, and premium formulations for infant care. Rising awareness about the impact of synthetic chemicals has encouraged demand for natural and dermatologically tested solutions, while manufacturers are focusing on gentle cleansing agents, plant based extracts, and allergen free ingredients.
Premiumization is becoming a defining trend as caregivers demonstrate willingness to invest in high quality products that ensure both efficacy and safety. E commerce platforms and organized retail chains are also expanding accessibility to diverse product ranges, creating greater brand visibility and consumer choice.
Regulatory standards related to baby care safety and labeling practices are shaping product innovation, while ongoing marketing efforts highlight trust, purity, and health benefits. With urbanization and increasing disposable incomes, the outlook remains positive as this category continues to expand across both developed and emerging markets.
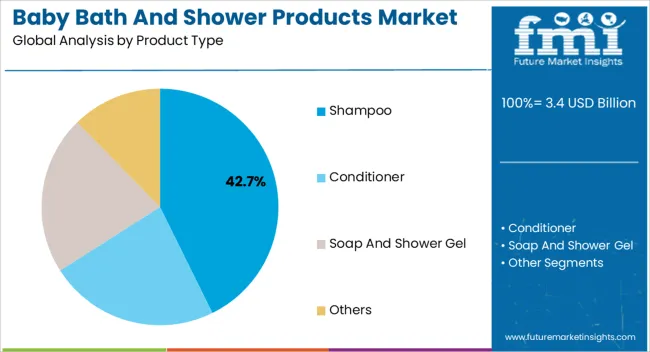
The shampoo segment is expected to account for 42.70% of total market revenue by 2025 within the product type category, making it the leading segment. Growth is being driven by the necessity of regular scalp and hair hygiene in infants, combined with the availability of mild, tear free, and pH balanced formulations.
Product innovation emphasizing natural and organic ingredients has further strengthened consumer trust and adoption. Additionally, the increasing trend of multi functional baby shampoos that combine cleansing and conditioning benefits has reinforced market penetration.
This focus on safety, quality, and gentle care has made shampoo the dominant product type segment in baby bath and shower products..
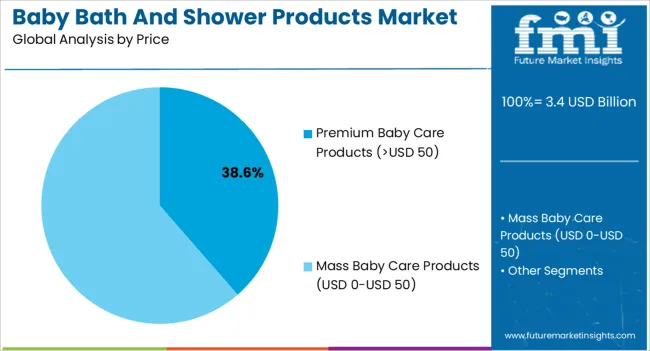
The premium baby care products category, priced above USD 50, is projected to hold 38.60% of overall revenue by 2025 within the price category, establishing it as the dominant segment. This leadership is supported by parents’ willingness to pay more for superior safety standards, natural formulations, and enhanced sensory appeal.
Premium offerings often include dermatologist tested, hypoallergenic, and sustainably sourced ingredients that resonate strongly with health conscious and eco aware consumers. Marketing strategies emphasizing exclusivity and trust have also reinforced premium positioning.
As disposable incomes rise and parents place greater emphasis on holistic infant well being, premium baby care products continue to represent the fastest growing and most influential price segment.
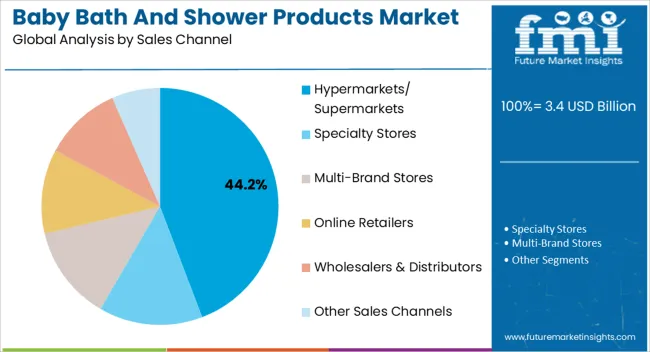
The hypermarkets and supermarkets sales channel is anticipated to capture 44.20% of total revenue by 2025 within the sales channel category, making it the dominant distribution route. This dominance is attributed to the extensive product availability, attractive promotions, and consumer preference for in store product comparisons.
The convenience of one stop shopping combined with the trust associated with organized retail formats has supported greater penetration of baby bath and shower products. Furthermore, retailers’ focus on expanding dedicated baby care sections and offering premium as well as affordable options has enhanced sales volumes.
With their ability to influence consumer choices through visibility and promotions, hypermarkets and supermarkets remain the primary distribution channel for baby bath and shower products.
Spurred by increasing focus of parents on baby’s care activities, the global baby bath and shower products market will rise at 7.2% CAGR between 2025 and 2035.
Parents’ concern about their newborn child's development as well as hygienic issues is not unknown to anybody. Owing to this, baby personal care products manufacturers are taking precautions about the ingredients used in their products.
An increasing number of customers consider trusted brand names to be the most important factor influencing their purchase decision. As a consequence, in the global baby care industry, the popularity of a brand name is still a guarantee of quality for customers. Given this, there has been an increase in demand for baby bath and shower product items, especially from these concerned parents.
As compared to period of 2000 to 2020, the infant population during 2020 to 2035 is likely to grow at higher rate. According to, UN Department of Economic and Social Affairs, Africa is expected to witness 24% growth in births during the same period. Asia Pacific might experience birth rate of 10%. Against this backdrop, the demand for baby care products is expected to remarkably surge in the coming years.
The baby’s raggedness while playing games and their implications are not new to parents. To counter such realities and provide hygienic surroundings, consumers are wisely opting for reliable brand products with different fragrances and types. This factor will deliver a steady growth opportunity to the baby bath and shower products manufacturers in the long run.
The launch of new-from-normal products and the power of social media are expected to create several opportunities for the leading players. The rapid development of in-shower versions, as well as an increase in penetration of baby spas across many regions that have attracted high number of customers, are expected to drive the expansion during the forecast period.
| Period | Market Size (in USD billion) |
|---|---|
| 2020 | 1.7 |
| 2025 | 2.5 |
| 2025 | 3 |
| 2035 | 6 |
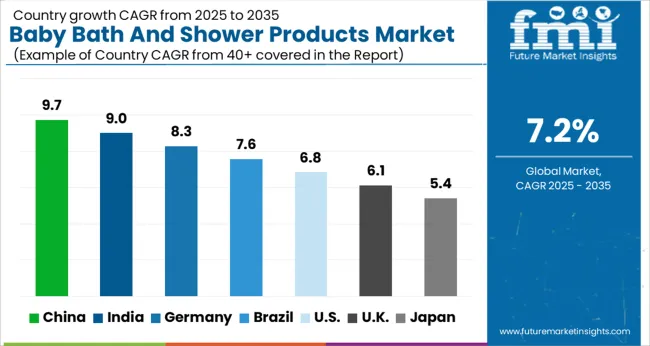
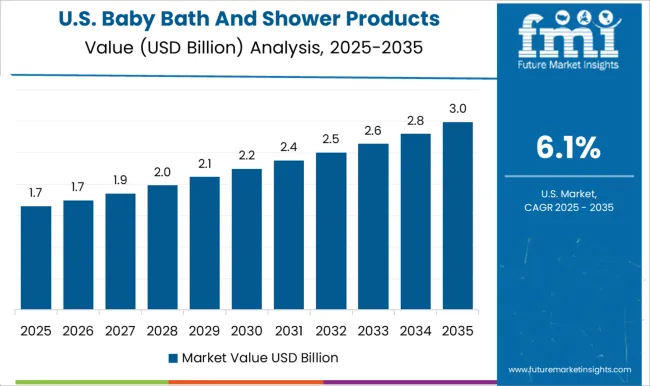
According to Future Market Insights, North America will continue to be one of the most lucrative markets throughout the forecast period. According to the study, the USA is expected to account for over 74.4% of the North America’s share through 2035.
Consumers in the United States showcase high spending on baby care, which is one of the key factors supporting the industry growth. The USA being one of the largest markets for baby care products has a high level of penetration of some of the global leading manufacturers, who offer premium baby shampoos and soaps.
Apart from this, rising disposable income, high spending power, and high baby care awareness consumers in the USA will bode well for the market.
Demand in the United Kingdom is projected to rise at nearly 4.1% CAGR over the forecast period. Hand washing has become more popular, mostly in children causing worries about hand health and creating opportunities for brands that make moisturizing and microbiome-friendly baby care products.
As per the report, baby hygiene has become more essential as a result of the pandemic. The quick solution and reliability with multi-use liquid soaps that can be easily used as soap for bathing and as a shampoo is highly adopted by the consumers.
The need for frequently sanitizing in times of pandemic has led parents to care for more than one bath and a shower of their baby leading to the boost in demand.
China is a leading manufacturer of baby bath and shower products in East Asia. By 2035, it is expected to account for over 44.4% of overall sales within the region.
The increasing demand for handmade baby soap is due to the fact that handmade soaps contains glycerin that help in moisturizing the skin, whereas, in mass produced soaps glycerin is not included.
Besides ingredients used, moisturizing qualities and mildness of handcrafted baby soaps that come in a variety of fascinating patterns, scents, shapes, and colors have attracted the regional population. Manufacturers in the country have a competitive advantage as they have access to methods for manufacturing handmade soaps with demandable ingredients such as bath salts and natural herbs. They are constantly evolving their products for different fragrances that are derived from natural sources rather than artificial ones which are resulting in a more promising opportunity for the regional players.
In 2035, India will account for over 31.3% sales in South Asia. Government policies and programs are undertaken to give affordable and quality baby healthcare products. Such initiatives are anticipated to drive India's baby bath and shower product industry. For instance, National Commission for Protection of Child Rights (NCPCR) is one such commission that is playing a significant role in ensuring baby safety from harmful products.
Rising public consciousness about the use of chemical substances in bath and shower gels, such as sodium lauryl sulfate, dioxane, and parabens, is expected to stifle the demand growth. For instance, in 2020, the Food Safety and Drug Administration Department (FSDA) banned the use of baby shower shampoo manufactured by Johnson & Johnson’s Company which had used formaldehyde as an ingredient, hampering the company’s growth in the region. Implementation of such stringent regulations will have considerable impact on the market.
Based on product types, soap and shower gel has emerged as the leading category, accounting for nearly 37.8% of the market in 2035. The use of baby soap and shower gel will continue increasing, thanks to increasing availability of various options in terms of ingredients used.
Soap and shower gel is expected to remain a top choice as parents willingly spend to ensure care towards baby skin. Use of traditional soaps can cause irritation and bacterial infection on baby’s skin. This has resulted in the increasing demand for shower gel and good quality soaps.
Premium baby care products sales are increasing globally due to the increasing spending on high-quality baby care items. Premium baby care products are estimated to account for over 38.5% of the market by 2035.
The manufacturers have set their focus towards premium baby care products owing to the growing demand from developing countries such as China, India, Brazil, and others. The increasing spending power and image of the premium products as genuine and most effective, is leading customers to greater adoption of these products.
Online retailing channel is expected to contribute revenue share of more than 13.7% by 2035 in the global baby bath and shower product market. This is due to the presence of various brands and a wide range of products that are not available at other retailing channels. The biggest benefit of online shopping is that it is more convenient for the customer. Most people lead busy lives and to buy something they mostly prefer online rather than visiting a physical store. It helps them save money, effort, and time. Doing so from the comfort of their own homes is much more convenient than doing so in a store.
Besides this, the outbreak of the pandemic has restricted consumers to their homes. In such time, players opted to set their shops online by offering various discounts and services such as no-contact delivery and this has caught the attention of many customers.
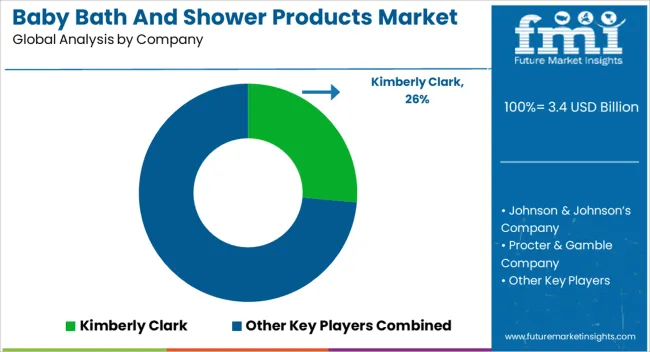
The baby bath and shower products market is highly competitive, with several players vying for a larger share of the market. The major players in this industry are Johnson & Johnson, Procter & Gamble, Unilever, Kimberly-Clark, and Beiersdorf. These companies are actively involved in the development, production, and marketing of baby bath and shower products, including soaps, shampoos, and baby wash.
The companies are focusing on product innovation, branding, and marketing activities to stay ahead in the competition. For instance, Johnson & Johnson introduced its hypoallergenic and clinically-proven baby bath products, such as Head-to-Toe Wash and Bedtime Bath. Procter & Gamble also launched its Pampers Pure collection, which includes eco-friendly and fragrance-free baby products.
The partnerships and collaborations have also become a popular strategy among key players to strengthen their position in the market. For example, Goodnites partnered with the Autism Society of America to provide bedwetting solutions for children with autism.
With the growing demand for natural and organic products, several small and medium-sized players are also entering the market, offering a diverse range of organic and eco-friendly baby bath and shower products. Overall, the market is expected to remain highly competitive in the foreseeable future.
| Company Name | Johnson & Johnson’s Company |
|---|---|
| Key Focus Areas | Innovation, safety, and sustainability |
| Key Offerings | Soaps, Shampoos, Baby Wash |
| Company Name | Himalaya |
|---|---|
| Key Focus Areas | Natural ingredients, Sustainability |
| Key Offerings | Baby Soaps, Shampoos, Oils, Creams, Powders. |
Strategies for Baby Bath and Shower Products Manufacturers to Expand in the Market
Recent Developments in the Baby Bath and Shower Products Industry:
| Report Attribute | Details |
|---|---|
| Market Value in 2025 | USD 3.4 billion |
| Market Value in 2035 | USD 6.9 billion |
| Growth Rate | CAGR of 7.2% from 2025 to 2035 |
| Base Year for Estimation | 2025 |
| Historical Data | 2020 to 2025 |
| Forecast Period | 2025 to 2035 |
| Quantitative Units | Revenue in US Billion and CAGR from 2025 to 2035 |
| Report Coverage | Revenue Forecast, Company Ranking, Competitive Landscape, Growth Factors, Trends and Pricing Analysis |
| Segments Covered | Product Type, Price, Sales Channel, Region |
| Regions Covered | North America; Latin America; Europe; Asia Pacific; Middle East and Africa |
| Key Countries Profiled | USA,Canada,Brazil,Mexico,Germany, United Kingdom, France, Spain, Italy, China, Japan, South Korea, Singapore, Thailand, Indonesia, Australia, New Zealand, GCC, South Africa, Israel |
| Key Companies Profiled | Kimberly Clark; Johnson & Johnson’s Company; Procter & Gamble Company; Unilever; Wipro; Burt's Bees; Avon Products, Inc.; Beiersdorf AG; Loreal SA; Chicco; Babyganics; Himalaya; Sebapharma; Weleda; Green People |
| Customization | Available Upon Request |
The global baby bath and shower products market is estimated to be valued at USD 3.4 billion in 2025.
The market size for the baby bath and shower products market is projected to reach USD 6.9 billion by 2035.
The baby bath and shower products market is expected to grow at a 7.2% CAGR between 2025 and 2035.
The key product types in baby bath and shower products market are shampoo, conditioner, soap and shower gel and others.
In terms of price, premium baby care products (>usd 50) segment to command 38.6% share in the baby bath and shower products market in 2025.


Our Research Products

The "Full Research Suite" delivers actionable market intel, deep dives on markets or technologies, so clients act faster, cut risk, and unlock growth.

The Leaderboard benchmarks and ranks top vendors, classifying them as Established Leaders, Leading Challengers, or Disruptors & Challengers.

Locates where complements amplify value and substitutes erode it, forecasting net impact by horizon

We deliver granular, decision-grade intel: market sizing, 5-year forecasts, pricing, adoption, usage, revenue, and operational KPIs—plus competitor tracking, regulation, and value chains—across 60 countries broadly.

Spot the shifts before they hit your P&L. We track inflection points, adoption curves, pricing moves, and ecosystem plays to show where demand is heading, why it is changing, and what to do next across high-growth markets and disruptive tech

Real-time reads of user behavior. We track shifting priorities, perceptions of today’s and next-gen services, and provider experience, then pace how fast tech moves from trial to adoption, blending buyer, consumer, and channel inputs with social signals (#WhySwitch, #UX).

Partner with our analyst team to build a custom report designed around your business priorities. From analysing market trends to assessing competitors or crafting bespoke datasets, we tailor insights to your needs.
Supplier Intelligence
Discovery & Profiling
Capacity & Footprint
Performance & Risk
Compliance & Governance
Commercial Readiness
Who Supplies Whom
Scorecards & Shortlists
Playbooks & Docs
Category Intelligence
Definition & Scope
Demand & Use Cases
Cost Drivers
Market Structure
Supply Chain Map
Trade & Policy
Operating Norms
Deliverables
Buyer Intelligence
Account Basics
Spend & Scope
Procurement Model
Vendor Requirements
Terms & Policies
Entry Strategy
Pain Points & Triggers
Outputs
Pricing Analysis
Benchmarks
Trends
Should-Cost
Indexation
Landed Cost
Commercial Terms
Deliverables
Brand Analysis
Positioning & Value Prop
Share & Presence
Customer Evidence
Go-to-Market
Digital & Reputation
Compliance & Trust
KPIs & Gaps
Outputs
Full Research Suite comprises of:
Market outlook & trends analysis
Interviews & case studies
Strategic recommendations
Vendor profiles & capabilities analysis
5-year forecasts
8 regions and 60+ country-level data splits
Market segment data splits
12 months of continuous data updates
DELIVERED AS:
PDF EXCEL ONLINE
Baby Safety Products Market Analysis - Size, Share & Trends 2025 to 2035
Baby Teeth Care Products Market Size and Share Forecast Outlook 2025 to 2035
Baby Personal Care Products Market Analysis - Size & Growth 2025 to 2035
Baby Changing Station Market Size and Share Forecast Outlook 2025 to 2035
Baby Car Safety Seat Market Forecast and Outlook 2025 to 2035
Bath Toy Market Size and Share Forecast Outlook 2025 to 2035
Bathroom Furniture Market Size and Share Forecast Outlook 2025 to 2035
Baby Doll Market Size and Share Forecast Outlook 2025 to 2035
Baby & Toddler Carriers & Accessories Market Size and Share Forecast Outlook 2025 to 2035
Bath Linen and Accessories Market Size and Share Forecast Outlook 2025 to 2035
Baby Shoes Market Size and Share Forecast Outlook 2025 to 2035
Products from Food Waste Industry Analysis in Korea Size, Share and Forecast Outlook 2025 to 2035
Baby Oral Care Market Size and Share Forecast Outlook 2025 to 2035
Baby Ear Thermometer Market Size and Share Forecast Outlook 2025 to 2035
Baby Food Dispensing Spoon Market Size and Share Forecast Outlook 2025 to 2035
Baby Pacifier Thermometer Market Size and Share Forecast Outlook 2025 to 2035
Baby Crib Sheet Market Size and Share Forecast Outlook 2025 to 2035
Products from Food Waste in Japan - Size, Share, and Forecast Outlook 2025 to 2035
Bathroom Cabinets Market Size and Share Forecast Outlook 2025 to 2035
Baby Food Market Analysis - Size, Share, and Forecast Outlook 2025 to 2035

Thank you!
You will receive an email from our Business Development Manager. Please be sure to check your SPAM/JUNK folder too.
Chat With
MaRIA