Baby Car Safety Seat Market Size and Share Forecast Outlook From 2024 to 2034

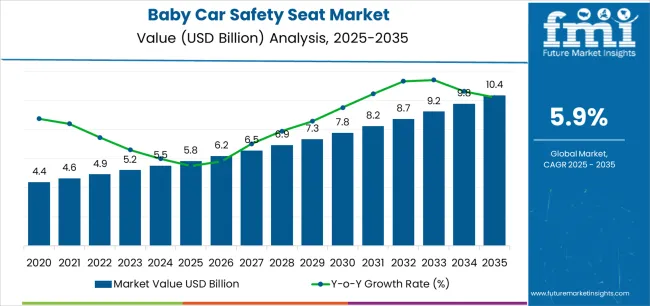
The baby car safety seat market is projected to be valued at USD 5.5 billion in 2024 and rise to USD 10.0 billion by 2034. It is expected to grow at a CAGR of 6.2% during the forecast period.

Key Market Drivers

  • The demand for baby car safety seats has increased due to higher awareness about child safety during transportation.
  • Governments and regulatory bodies have imposed stringent safety regulations, driving the market growth.
  • Growing road accidents have boosted the demand for baby car safety seats.
  • Technological advancements in design and materials have enhanced safety and comfort, attracting more consumers.
  • Rising disposable income levels have enabled more parents to afford premium baby car safety seats.
  • Urbanization has increased the market demand as more families rely on cars for transportation.
  • E-commerce platforms have improved accessibility and convenience, driving sales of baby car safety seats.
  • Increasing emphasis on child welfare and safety has propelled market expansion.
  • Manufacturers offering customizable and personalized options have contributed to market growth.
Attributes Key Statistics
Baby Car Safety Seat Market Value (2024) USD 5.5 Billion
Anticipated Market Value (2034) USD 10.0 Billion
Estimated Growth (2024 to 2034) 6.2% CAGR

Consumption Analysis of the Baby Car Safety Seat Market

  • Parental awareness of child safety has led to a surge in demand for baby car safety seats.
  • Safety-conscious parents prefer high-quality safety seats with advanced features.
  • More parents are adopting safety regulations, increasing the adoption rate of baby car safety seats.
  • Manufacturers have introduced innovative designs and customizable options for diverse consumer preferences.
  • Popularity of convertible car seats and booster seats has also contributed to the market’s growth.
  • The market for baby car safety seats has expanded rapidly in recent years as it has witnessed steady growth, with a growing focus on child passenger safety.
  • The introduction of innovative products aimed at enhancing safety and comfort for infants and toddlers is supporting the growth trajectory of the baby car safety seat market.

Factors Restraining Growth in the Baby Car Safety Seat Market

  • Affordability concerns limit baby car safety seat penetration in emerging markets.
  • Low awareness levels hinder market growth in some regions and demographics.
  • Varying regulations across regions create compliance challenges for manufacturers.
  • Limited compatibility with certain vehicle models affects market demand.
  • Advancements in car seat technology may deter consumers due to frequent replacements.
  • Product recalls erode consumer trust; manufacturers must prioritize safety and transparency.
  • Developed regions may experience market saturation; manufacturers must explore untapped markets.
  • Eco-friendly materials could drive demand for sustainable baby car safety seats.
  • Manufacturers must invest in research and development to innovate and remain competitive.

Analysis of Top Countries Producing, Distributing, and Using Baby Car Safety Seats

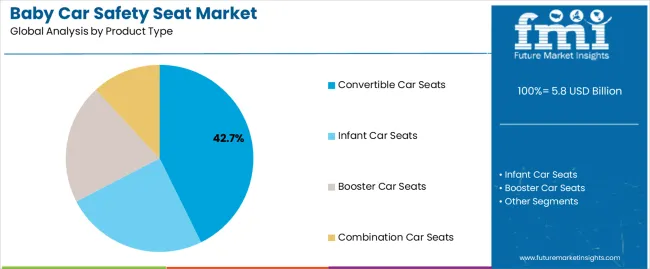
Higher Sales of Infant Car Seats Due to their Suitability for Newborn Safety

Infant car seats upsurge the global market with a 6.0% CAGR through 2034.

Attributes Details
Top Product Type Infant Car Seats
CAGR ( 2024 to 2034) 6.0%

This rising popularity is attributed to:

  • Infant car seats are the most popular type due to the focus on safety during transportation.
  • Infant car seats are meticulously engineered for optimal protection and support.
  • Regulations mandating their use for infants have bolstered the market.
  • Infant car seats are highly sought after for versatility and convenience.
  • Infant car seats are often designed to be compatible with strollers and easily installed.
  • The ability to easily transition from the car to a stroller appeals to parents. Infant car seats have become the preferred choice for many parents.

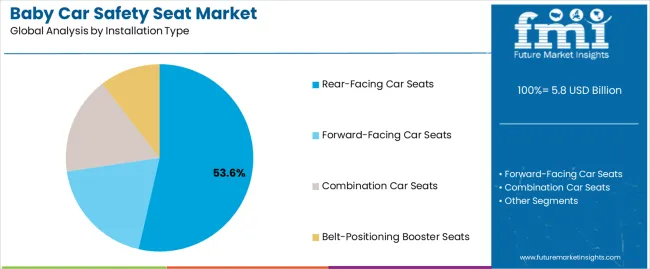
Rear-Facing Car Seats Dominate Due to Superior Safety and Regulations

Based on the installation type, the rear-facing car seats segment is expected to rise at a 5.8% CAGR from 2024 to 2034.

Attributes Details
Top Installation Type Rear-facing Car Seats
CAGR ( 2024 to 2034) 5.8%
  • Rear-facing car seats are preferred for infants and young toddlers due to their superior protection.
  • Rear-facing car seats distribute crash forces evenly across the back, neck, and head, reducing the risk of injury.
  • Regulatory bodies and pediatric experts strongly recommend using rear-facing car seats.
  • Increasing consumer awareness and education initiatives have been pivotal in their domination.
  • Safety guidelines are widely disseminated through various channels, such as social media and parenting forums.
  • Manufacturers and retailers actively promote rear-facing car seats as the gold standard for infant safety.

Baby Car Safety Seat Industry Analysis by Top Investment Segments

The section analyzes the global baby car safety seat market by country, including the United Kingdom, the United States, China, South Korea, and Japan. The table presents the CAGR for each country, indicating the expected market growth through 2034.

Countries CAGR (2024 to 2034)
South Korea 8.0%
United Kingdom 7.4%
Japan 7.2%
China 6.9%
United States 6.5%

Market Expansion in South Korea Due to Stringent Safety Regulations and Increasing Consumer Awareness

South Korea is swiftly emerging as a pivotal player in the global baby car safety seat market. It is expected to expand at a CAGR of 8.0% from 2024 to 2034. This remarkable growth trajectory underscores South Korea's burgeoning influence and potential to reshape the landscape of child safety solutions worldwide.

South Korea's baby car safety seat market is increasing due to the country's strong automotive industry and a growing emphasis on child safety. The government's initiatives to promote the use of safety seats for children and boost consumer awareness about the importance of child passenger safety have fueled the growth in the market. Collaborations between automotive and baby car safety seat manufacturers to integrate safety features into vehicles have further contributed to market expansion.

Rising Demand for Convertible and Booster Seats Propels Market Expansion in the United Kingdom

The United Kingdom market is expected to rise at a CAGR of 7.4% through 2034. Stringent safety regulations and increasing awareness among parents regarding child passenger safety have significantly contributed to market growth. The United Kingdom government's initiatives to promote car safety seats for infants and toddlers have also played a vital role in boosting market demand. A wide range of innovative safety products and technological advancements have driven market expansion in the United Kingdom.

Technological Innovations Prioritizing Child Safety is Expanding Japan's Baby Car Safety Seat Market

Japan remains a significant contributor to the global baby car safety seat market, forecasting a consistent growth trajectory of 7.2% CAGR until 2034.

Japan's baby car safety seat market is growing steadily due to strict safety regulations, technological advancements, and increasing consumer awareness about child safety. The Japanese government's efforts to promote road safety and enforce rules mandating safety seats for infants and toddlers have significantly driven the market’s growth. Introducing innovative products with enhanced safety features and ergonomic designs has fueled consumer demand, leading to market expansion in Japan.

Urbanization and Rising Disposable Incomes in China are Propelling Market Expansion

China is rapidly emerging as a dominant force in the global baby car safety seat market, showcasing an impressive CAGR of 6.9%, expected to endure from 2024 to 2034. This robust growth trajectory solidifies China's position as a key player in the industry, underlining its potential to influence market dynamics on a global scale significantly.

China's baby car safety seat market is experiencing explosive growth due to several factors. Urbanization, rising birth rates, and increasing awareness among parents about child safety during car travel have fueled market growth. Government initiatives to promote road safety and enforce regulations mandating safety seats for children have also stimulated market expansion.

The expanding middle-class population and growing consumer preference for premium safety products have driven China's demand for baby car safety seats.

Increase in Road Accidents Propelling Demand for Baby Car Safety Seats in the United States

The United States is steadily emerging as a significant contender in the worldwide baby car safety seat market, with a projected CAGR of 6.5% through 2034.

The baby car safety seat market is witnessing significant growth in the United States due to rising disposable income levels and an increasing emphasis on child welfare. A strong regulatory framework mandating the use of safety seats for children has further propelled market growth in the United States.

Key market players investing in research and development to introduce advanced safety features and ergonomic designs have also contributed to market expansion. Also, the rising popularity of convertible car seats and booster seats catering to varying age groups has boosted market demand and adoption rates.
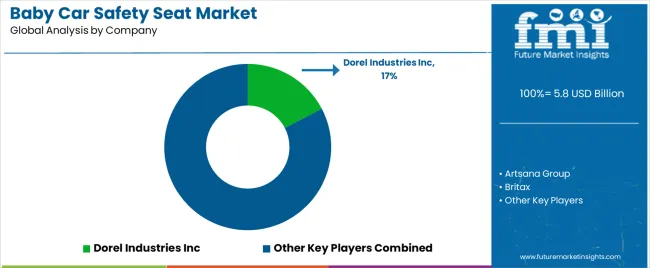
Competitive Landscape of the Baby Car Safety Seat Market

Major global baby car safety seat players are implementing various strategies to drive growth and enhance their market presence. In Europe, where the baby car seat market is significant, companies focus on complying with strict safety regulations and product innovation to gain a competitive edge.

These players are investing in research and development to introduce advanced features such as impact-absorbing materials, adjustable harness systems, and ergonomic designs that cater to changing consumer needs.

Manufacturers are forging strategic partnerships and collaborations with automotive manufacturers and retailers to expand distribution channels and increase market penetration across European regions. By leveraging their product development expertise and meeting the high demand for safety seats, these companies intend to solidify their market share and drive growth in the European baby car seat market.

On a global level, major companies in the baby car safety seat industry are targeting emerging markets like Asia-Pacific, where the demand for safety seats is rapidly increasing. These companies are establishing manufacturing facilities and distribution networks in key countries such as China and India to capitalize on the growing market size and capture a more significant market share.

Key players are pursuing strategic acquisitions and mergers to strengthen their market position and gain access to new technologies and resources.

Recent Developments

  • On March 20, 2023, USA-based child safety technology company Frank Stephenson Design unveiled a digitally smart baby car seat hailed as the world's safest.
  • On March 14, 2023, Britax and Nuna convertible car seats were reviewed for safety and comfort. After consulting with a baby safety expert and testing the seats on two- and one-year-old nieces, we assessed honestly.
  • On February 6, 2020, it was revealed that Evenflo, maker of the "Big Kid" booster seat, prioritized profits over child safety. Internal tests showed potential risks, contradicting the company's marketing claims.
  • On May 3, 2023, a UK law change regarding baby car seats came into effect, prohibiting the use of backless booster seats. This regulation aimed to enhance child safety during car travel.

Leading Companies in the Baby Car Safety Seat Market

  • Artsana Group
  • Britax
  • Clek In
  • Diono LLC
  • Dorel Industries Inc
  • Goodbaby International Holdings
  • UPPAbaby
  • RENOLUX FRANCE INDUSTRY
  • RECARO Holding GmbH
  • Newell Brands
  • Mothercare plc
  • InfaSecure
  • Kiwi Baby
  • Graco childerens products Inc.
  • RECARO GmbH & Co. KG and combi.
  • Orbit Baby
  • Bebe Confort
  • Nuna
  • Recaro
  • Chicco

Key Coverage in the Baby Car Safety Seat Market Report

  • Demand Analysis for Different Car Seat Weight Groups and Height Groups
  • How To Choose The Best Car Safety Seat For Your Child
  • Baby Car Seat Manufacturers, Suppliers, Dealers & Prices
  • Market Analysis of Europe Baby Car Seat Market Size
  • Comparative Analysis of Car Seats and Car Accessories Market
  • Assessment of Best Design and Innovation Features in Baby Car Seats

Top Segments Studied in the Baby Car Safety Seat Market

By Product Type:

  • Infant Car Seats
  • Convertible Car Seats
  • Booster Car Seats
  • Combination Car Seats

By Installation Type:

  • Rear-Facing Car Seats
  • Forward-Facing Car Seats
  • Combination Car Seats
  • Belt-Positioning Booster Seats

By Distribution Channel:

  • Online Retailers
  • Specialty Stores
  • Departmental Stores
  • Baby Boutiques
  • Individual Consumers
  • Car Rental Companies
  • Others (Supermarkets, Hypermarkets, Authorized Dealerships)

By Region:

  • North America
  • Latin America
  • Asia Pacific
  • Middle East and Africa (MEA)
  • Europe

Table of Content

  • 1. Executive Summary
  • 2. Market Overview
  • 3. Market Background
  • 4. Global Market Analysis 2019 to 2023 and Forecast, 2024 to 2034
  • 5. Global Market Analysis 2019 to 2023 and Forecast 2024 to 2034, By Product Type
    • 5.1. Infant Car Seats
    • 5.2. Convertible Car Seats
    • 5.3. Booster Car Seats
    • 5.4. Combination Car Seats
  • 6. Global Market Analysis 2019 to 2023 and Forecast 2024 to 2034, By Installation Type
    • 6.1. Rear-Facing Car Seats
    • 6.2. Forward-Facing Car Seats
    • 6.3. Combination Car Seats
    • 6.4. Belt-Positioning Booster Seats
  • 7. Global Market Analysis 2019 to 2023 and Forecast 2024 to 2034, By Distribution Channel
    • 7.1. Online Retailers
    • 7.2. Specialty Stores
    • 7.3. Departmental Stores
    • 7.4. Baby Boutiques
    • 7.5. Individual Consumers
    • 7.6. Car Rental Companies
    • 7.7. Others (Supermarkets, Hypermarkets, Authorized Dealerships)
  • 8. Global Market Analysis 2019 to 2023 and Forecast 2024 to 2034, By Region
    • 8.1. North America
    • 8.2. Latin America
    • 8.3. Western Europe
    • 8.4. Eastern Europe
    • 8.5. South Asia and Pacific
    • 8.6. East Asia
    • 8.7. Middle East and Africa
  • 9. North America Market Analysis 2019 to 2023 and Forecast 2024 to 2034, By Country
  • 10. Latin America Market Analysis 2019 to 2023 and Forecast 2024 to 2034, By Country
  • 11. Western Europe Market Analysis 2019 to 2023 and Forecast 2024 to 2034, By Country
  • 12. Eastern Europe Market Analysis 2019 to 2023 and Forecast 2024 to 2034, By Country
  • 13. South Asia and Pacific Market Analysis 2019 to 2023 and Forecast 2024 to 2034, By Country
  • 14. East Asia Market Analysis 2019 to 2023 and Forecast 2024 to 2034, By Country
  • 15. Middle East and Africa Market Analysis 2019 to 2023 and Forecast 2024 to 2034, By Country
  • 16. Key Countries Market Analysis
  • 17. Market Structure Analysis
  • 18. Competition Analysis
    • 18.1. Artsana Group
    • 18.2. Britax
    • 18.3. Clek Inc
    • 18.4. Diono LLC
    • 18.5. Dorel Industries
    • 18.6. Goodbaby International Holdings Ltd
    • 18.7. Indiana Mills
    • 18.8. RECARO GmbH & Co. KG
    • 18.9. Graco Childrens Products Inc
    • 18.10. Kiwi Baby Howick
  • 19. Assumptions & Acronyms Used
  • 20. Research Methodology

List of Tables

Table 1: Global Market Value (US$ Million) Forecast by Region, 2019 to 2034

Table 2: Global Market Volume (Units) Forecast by Region, 2019 to 2034

Table 3: Global Market Value (US$ Million) Forecast by Product Type, 2019 to 2034

Table 4: Global Market Volume (Units) Forecast by Product Type, 2019 to 2034

Table 5: Global Market Value (US$ Million) Forecast by Installation Type, 2019 to 2034

Table 6: Global Market Volume (Units) Forecast by Installation Type, 2019 to 2034

Table 7: Global Market Value (US$ Million) Forecast by Distribution Channel, 2019 to 2034

Table 8: Global Market Volume (Units) Forecast by Distribution Channel, 2019 to 2034

Table 9: North America Market Value (US$ Million) Forecast by Country, 2019 to 2034

Table 10: North America Market Volume (Units) Forecast by Country, 2019 to 2034

Table 11: North America Market Value (US$ Million) Forecast by Product Type, 2019 to 2034

Table 12: North America Market Volume (Units) Forecast by Product Type, 2019 to 2034

Table 13: North America Market Value (US$ Million) Forecast by Installation Type, 2019 to 2034

Table 14: North America Market Volume (Units) Forecast by Installation Type, 2019 to 2034

Table 15: North America Market Value (US$ Million) Forecast by Distribution Channel, 2019 to 2034

Table 16: North America Market Volume (Units) Forecast by Distribution Channel, 2019 to 2034

Table 17: Latin America Market Value (US$ Million) Forecast by Country, 2019 to 2034

Table 18: Latin America Market Volume (Units) Forecast by Country, 2019 to 2034

Table 19: Latin America Market Value (US$ Million) Forecast by Product Type, 2019 to 2034

Table 20: Latin America Market Volume (Units) Forecast by Product Type, 2019 to 2034

Table 21: Latin America Market Value (US$ Million) Forecast by Installation Type, 2019 to 2034

Table 22: Latin America Market Volume (Units) Forecast by Installation Type, 2019 to 2034

Table 23: Latin America Market Value (US$ Million) Forecast by Distribution Channel, 2019 to 2034

Table 24: Latin America Market Volume (Units) Forecast by Distribution Channel, 2019 to 2034

Table 25: Western Europe Market Value (US$ Million) Forecast by Country, 2019 to 2034

Table 26: Western Europe Market Volume (Units) Forecast by Country, 2019 to 2034

Table 27: Western Europe Market Value (US$ Million) Forecast by Product Type, 2019 to 2034

Table 28: Western Europe Market Volume (Units) Forecast by Product Type, 2019 to 2034

Table 29: Western Europe Market Value (US$ Million) Forecast by Installation Type, 2019 to 2034

Table 30: Western Europe Market Volume (Units) Forecast by Installation Type, 2019 to 2034

Table 31: Western Europe Market Value (US$ Million) Forecast by Distribution Channel, 2019 to 2034

Table 32: Western Europe Market Volume (Units) Forecast by Distribution Channel, 2019 to 2034

Table 33: Eastern Europe Market Value (US$ Million) Forecast by Country, 2019 to 2034

Table 34: Eastern Europe Market Volume (Units) Forecast by Country, 2019 to 2034

Table 35: Eastern Europe Market Value (US$ Million) Forecast by Product Type, 2019 to 2034

Table 36: Eastern Europe Market Volume (Units) Forecast by Product Type, 2019 to 2034

Table 37: Eastern Europe Market Value (US$ Million) Forecast by Installation Type, 2019 to 2034

Table 38: Eastern Europe Market Volume (Units) Forecast by Installation Type, 2019 to 2034

Table 39: Eastern Europe Market Value (US$ Million) Forecast by Distribution Channel, 2019 to 2034

Table 40: Eastern Europe Market Volume (Units) Forecast by Distribution Channel, 2019 to 2034

Table 41: South Asia and Pacific Market Value (US$ Million) Forecast by Country, 2019 to 2034

Table 42: South Asia and Pacific Market Volume (Units) Forecast by Country, 2019 to 2034

Table 43: South Asia and Pacific Market Value (US$ Million) Forecast by Product Type, 2019 to 2034

Table 44: South Asia and Pacific Market Volume (Units) Forecast by Product Type, 2019 to 2034

Table 45: South Asia and Pacific Market Value (US$ Million) Forecast by Installation Type, 2019 to 2034

Table 46: South Asia and Pacific Market Volume (Units) Forecast by Installation Type, 2019 to 2034

Table 47: South Asia and Pacific Market Value (US$ Million) Forecast by Distribution Channel, 2019 to 2034

Table 48: South Asia and Pacific Market Volume (Units) Forecast by Distribution Channel, 2019 to 2034

Table 49: East Asia Market Value (US$ Million) Forecast by Country, 2019 to 2034

Table 50: East Asia Market Volume (Units) Forecast by Country, 2019 to 2034

Table 51: East Asia Market Value (US$ Million) Forecast by Product Type, 2019 to 2034

Table 52: East Asia Market Volume (Units) Forecast by Product Type, 2019 to 2034

Table 53: East Asia Market Value (US$ Million) Forecast by Installation Type, 2019 to 2034

Table 54: East Asia Market Volume (Units) Forecast by Installation Type, 2019 to 2034

Table 55: East Asia Market Value (US$ Million) Forecast by Distribution Channel, 2019 to 2034

Table 56: East Asia Market Volume (Units) Forecast by Distribution Channel, 2019 to 2034

Table 57: Middle East and Africa Market Value (US$ Million) Forecast by Country, 2019 to 2034

Table 58: Middle East and Africa Market Volume (Units) Forecast by Country, 2019 to 2034

Table 59: Middle East and Africa Market Value (US$ Million) Forecast by Product Type, 2019 to 2034

Table 60: Middle East and Africa Market Volume (Units) Forecast by Product Type, 2019 to 2034

Table 61: Middle East and Africa Market Value (US$ Million) Forecast by Installation Type, 2019 to 2034

Table 62: Middle East and Africa Market Volume (Units) Forecast by Installation Type, 2019 to 2034

Table 63: Middle East and Africa Market Value (US$ Million) Forecast by Distribution Channel, 2019 to 2034

Table 64: Middle East and Africa Market Volume (Units) Forecast by Distribution Channel, 2019 to 2034

List of Figures

Figure 1: Global Market Value (US$ Million) by Product Type, 2024 to 2034

Figure 2: Global Market Value (US$ Million) by Installation Type, 2024 to 2034

Figure 3: Global Market Value (US$ Million) by Distribution Channel, 2024 to 2034

Figure 4: Global Market Value (US$ Million) by Region, 2024 to 2034

Figure 5: Global Market Value (US$ Million) Analysis by Region, 2019 to 2034

Figure 6: Global Market Volume (Units) Analysis by Region, 2019 to 2034

Figure 7: Global Market Value Share (%) and BPS Analysis by Region, 2024 to 2034

Figure 8: Global Market Y-o-Y Growth (%) Projections by Region, 2024 to 2034

Figure 9: Global Market Value (US$ Million) Analysis by Product Type, 2019 to 2034

Figure 10: Global Market Volume (Units) Analysis by Product Type, 2019 to 2034

Figure 11: Global Market Value Share (%) and BPS Analysis by Product Type, 2024 to 2034

Figure 12: Global Market Y-o-Y Growth (%) Projections by Product Type, 2024 to 2034

Figure 13: Global Market Value (US$ Million) Analysis by Installation Type, 2019 to 2034

Figure 14: Global Market Volume (Units) Analysis by Installation Type, 2019 to 2034

Figure 15: Global Market Value Share (%) and BPS Analysis by Installation Type, 2024 to 2034

Figure 16: Global Market Y-o-Y Growth (%) Projections by Installation Type, 2024 to 2034

Figure 17: Global Market Value (US$ Million) Analysis by Distribution Channel, 2019 to 2034

Figure 18: Global Market Volume (Units) Analysis by Distribution Channel, 2019 to 2034

Figure 19: Global Market Value Share (%) and BPS Analysis by Distribution Channel, 2024 to 2034

Figure 20: Global Market Y-o-Y Growth (%) Projections by Distribution Channel, 2024 to 2034

Figure 21: Global Market Attractiveness by Product Type, 2024 to 2034

Figure 22: Global Market Attractiveness by Installation Type, 2024 to 2034

Figure 23: Global Market Attractiveness by Distribution Channel, 2024 to 2034

Figure 24: Global Market Attractiveness by Region, 2024 to 2034

Figure 25: North America Market Value (US$ Million) by Product Type, 2024 to 2034

Figure 26: North America Market Value (US$ Million) by Installation Type, 2024 to 2034

Figure 27: North America Market Value (US$ Million) by Distribution Channel, 2024 to 2034

Figure 28: North America Market Value (US$ Million) by Country, 2024 to 2034

Figure 29: North America Market Value (US$ Million) Analysis by Country, 2019 to 2034

Figure 30: North America Market Volume (Units) Analysis by Country, 2019 to 2034

Figure 31: North America Market Value Share (%) and BPS Analysis by Country, 2024 to 2034

Figure 32: North America Market Y-o-Y Growth (%) Projections by Country, 2024 to 2034

Figure 33: North America Market Value (US$ Million) Analysis by Product Type, 2019 to 2034

Figure 34: North America Market Volume (Units) Analysis by Product Type, 2019 to 2034

Figure 35: North America Market Value Share (%) and BPS Analysis by Product Type, 2024 to 2034

Figure 36: North America Market Y-o-Y Growth (%) Projections by Product Type, 2024 to 2034

Figure 37: North America Market Value (US$ Million) Analysis by Installation Type, 2019 to 2034

Figure 38: North America Market Volume (Units) Analysis by Installation Type, 2019 to 2034

Figure 39: North America Market Value Share (%) and BPS Analysis by Installation Type, 2024 to 2034

Figure 40: North America Market Y-o-Y Growth (%) Projections by Installation Type, 2024 to 2034

Figure 41: North America Market Value (US$ Million) Analysis by Distribution Channel, 2019 to 2034

Figure 42: North America Market Volume (Units) Analysis by Distribution Channel, 2019 to 2034

Figure 43: North America Market Value Share (%) and BPS Analysis by Distribution Channel, 2024 to 2034

Figure 44: North America Market Y-o-Y Growth (%) Projections by Distribution Channel, 2024 to 2034

Figure 45: North America Market Attractiveness by Product Type, 2024 to 2034

Figure 46: North America Market Attractiveness by Installation Type, 2024 to 2034

Figure 47: North America Market Attractiveness by Distribution Channel, 2024 to 2034

Figure 48: North America Market Attractiveness by Country, 2024 to 2034

Figure 49: Latin America Market Value (US$ Million) by Product Type, 2024 to 2034

Figure 50: Latin America Market Value (US$ Million) by Installation Type, 2024 to 2034

Figure 51: Latin America Market Value (US$ Million) by Distribution Channel, 2024 to 2034

Figure 52: Latin America Market Value (US$ Million) by Country, 2024 to 2034

Figure 53: Latin America Market Value (US$ Million) Analysis by Country, 2019 to 2034

Figure 54: Latin America Market Volume (Units) Analysis by Country, 2019 to 2034

Figure 55: Latin America Market Value Share (%) and BPS Analysis by Country, 2024 to 2034

Figure 56: Latin America Market Y-o-Y Growth (%) Projections by Country, 2024 to 2034

Figure 57: Latin America Market Value (US$ Million) Analysis by Product Type, 2019 to 2034

Figure 58: Latin America Market Volume (Units) Analysis by Product Type, 2019 to 2034

Figure 59: Latin America Market Value Share (%) and BPS Analysis by Product Type, 2024 to 2034

Figure 60: Latin America Market Y-o-Y Growth (%) Projections by Product Type, 2024 to 2034

Figure 61: Latin America Market Value (US$ Million) Analysis by Installation Type, 2019 to 2034

Figure 62: Latin America Market Volume (Units) Analysis by Installation Type, 2019 to 2034

Figure 63: Latin America Market Value Share (%) and BPS Analysis by Installation Type, 2024 to 2034

Figure 64: Latin America Market Y-o-Y Growth (%) Projections by Installation Type, 2024 to 2034

Figure 65: Latin America Market Value (US$ Million) Analysis by Distribution Channel, 2019 to 2034

Figure 66: Latin America Market Volume (Units) Analysis by Distribution Channel, 2019 to 2034

Figure 67: Latin America Market Value Share (%) and BPS Analysis by Distribution Channel, 2024 to 2034

Figure 68: Latin America Market Y-o-Y Growth (%) Projections by Distribution Channel, 2024 to 2034

Figure 69: Latin America Market Attractiveness by Product Type, 2024 to 2034

Figure 70: Latin America Market Attractiveness by Installation Type, 2024 to 2034

Figure 71: Latin America Market Attractiveness by Distribution Channel, 2024 to 2034

Figure 72: Latin America Market Attractiveness by Country, 2024 to 2034

Figure 73: Western Europe Market Value (US$ Million) by Product Type, 2024 to 2034

Figure 74: Western Europe Market Value (US$ Million) by Installation Type, 2024 to 2034

Figure 75: Western Europe Market Value (US$ Million) by Distribution Channel, 2024 to 2034

Figure 76: Western Europe Market Value (US$ Million) by Country, 2024 to 2034

Figure 77: Western Europe Market Value (US$ Million) Analysis by Country, 2019 to 2034

Figure 78: Western Europe Market Volume (Units) Analysis by Country, 2019 to 2034

Figure 79: Western Europe Market Value Share (%) and BPS Analysis by Country, 2024 to 2034

Figure 80: Western Europe Market Y-o-Y Growth (%) Projections by Country, 2024 to 2034

Figure 81: Western Europe Market Value (US$ Million) Analysis by Product Type, 2019 to 2034

Figure 82: Western Europe Market Volume (Units) Analysis by Product Type, 2019 to 2034

Figure 83: Western Europe Market Value Share (%) and BPS Analysis by Product Type, 2024 to 2034

Figure 84: Western Europe Market Y-o-Y Growth (%) Projections by Product Type, 2024 to 2034

Figure 85: Western Europe Market Value (US$ Million) Analysis by Installation Type, 2019 to 2034

Figure 86: Western Europe Market Volume (Units) Analysis by Installation Type, 2019 to 2034

Figure 87: Western Europe Market Value Share (%) and BPS Analysis by Installation Type, 2024 to 2034

Figure 88: Western Europe Market Y-o-Y Growth (%) Projections by Installation Type, 2024 to 2034

Figure 89: Western Europe Market Value (US$ Million) Analysis by Distribution Channel, 2019 to 2034

Figure 90: Western Europe Market Volume (Units) Analysis by Distribution Channel, 2019 to 2034

Figure 91: Western Europe Market Value Share (%) and BPS Analysis by Distribution Channel, 2024 to 2034

Figure 92: Western Europe Market Y-o-Y Growth (%) Projections by Distribution Channel, 2024 to 2034

Figure 93: Western Europe Market Attractiveness by Product Type, 2024 to 2034

Figure 94: Western Europe Market Attractiveness by Installation Type, 2024 to 2034

Figure 95: Western Europe Market Attractiveness by Distribution Channel, 2024 to 2034

Figure 96: Western Europe Market Attractiveness by Country, 2024 to 2034

Figure 97: Eastern Europe Market Value (US$ Million) by Product Type, 2024 to 2034

Figure 98: Eastern Europe Market Value (US$ Million) by Installation Type, 2024 to 2034

Figure 99: Eastern Europe Market Value (US$ Million) by Distribution Channel, 2024 to 2034

Figure 100: Eastern Europe Market Value (US$ Million) by Country, 2024 to 2034

Figure 101: Eastern Europe Market Value (US$ Million) Analysis by Country, 2019 to 2034

Figure 102: Eastern Europe Market Volume (Units) Analysis by Country, 2019 to 2034

Figure 103: Eastern Europe Market Value Share (%) and BPS Analysis by Country, 2024 to 2034

Figure 104: Eastern Europe Market Y-o-Y Growth (%) Projections by Country, 2024 to 2034

Figure 105: Eastern Europe Market Value (US$ Million) Analysis by Product Type, 2019 to 2034

Figure 106: Eastern Europe Market Volume (Units) Analysis by Product Type, 2019 to 2034

Figure 107: Eastern Europe Market Value Share (%) and BPS Analysis by Product Type, 2024 to 2034

Figure 108: Eastern Europe Market Y-o-Y Growth (%) Projections by Product Type, 2024 to 2034

Figure 109: Eastern Europe Market Value (US$ Million) Analysis by Installation Type, 2019 to 2034

Figure 110: Eastern Europe Market Volume (Units) Analysis by Installation Type, 2019 to 2034

Figure 111: Eastern Europe Market Value Share (%) and BPS Analysis by Installation Type, 2024 to 2034

Figure 112: Eastern Europe Market Y-o-Y Growth (%) Projections by Installation Type, 2024 to 2034

Figure 113: Eastern Europe Market Value (US$ Million) Analysis by Distribution Channel, 2019 to 2034

Figure 114: Eastern Europe Market Volume (Units) Analysis by Distribution Channel, 2019 to 2034

Figure 115: Eastern Europe Market Value Share (%) and BPS Analysis by Distribution Channel, 2024 to 2034

Figure 116: Eastern Europe Market Y-o-Y Growth (%) Projections by Distribution Channel, 2024 to 2034

Figure 117: Eastern Europe Market Attractiveness by Product Type, 2024 to 2034

Figure 118: Eastern Europe Market Attractiveness by Installation Type, 2024 to 2034

Figure 119: Eastern Europe Market Attractiveness by Distribution Channel, 2024 to 2034

Figure 120: Eastern Europe Market Attractiveness by Country, 2024 to 2034

Figure 121: South Asia and Pacific Market Value (US$ Million) by Product Type, 2024 to 2034

Figure 122: South Asia and Pacific Market Value (US$ Million) by Installation Type, 2024 to 2034

Figure 123: South Asia and Pacific Market Value (US$ Million) by Distribution Channel, 2024 to 2034

Figure 124: South Asia and Pacific Market Value (US$ Million) by Country, 2024 to 2034

Figure 125: South Asia and Pacific Market Value (US$ Million) Analysis by Country, 2019 to 2034

Figure 126: South Asia and Pacific Market Volume (Units) Analysis by Country, 2019 to 2034

Figure 127: South Asia and Pacific Market Value Share (%) and BPS Analysis by Country, 2024 to 2034

Figure 128: South Asia and Pacific Market Y-o-Y Growth (%) Projections by Country, 2024 to 2034

Figure 129: South Asia and Pacific Market Value (US$ Million) Analysis by Product Type, 2019 to 2034

Figure 130: South Asia and Pacific Market Volume (Units) Analysis by Product Type, 2019 to 2034

Figure 131: South Asia and Pacific Market Value Share (%) and BPS Analysis by Product Type, 2024 to 2034

Figure 132: South Asia and Pacific Market Y-o-Y Growth (%) Projections by Product Type, 2024 to 2034

Figure 133: South Asia and Pacific Market Value (US$ Million) Analysis by Installation Type, 2019 to 2034

Figure 134: South Asia and Pacific Market Volume (Units) Analysis by Installation Type, 2019 to 2034

Figure 135: South Asia and Pacific Market Value Share (%) and BPS Analysis by Installation Type, 2024 to 2034

Figure 136: South Asia and Pacific Market Y-o-Y Growth (%) Projections by Installation Type, 2024 to 2034

Figure 137: South Asia and Pacific Market Value (US$ Million) Analysis by Distribution Channel, 2019 to 2034

Figure 138: South Asia and Pacific Market Volume (Units) Analysis by Distribution Channel, 2019 to 2034

Figure 139: South Asia and Pacific Market Value Share (%) and BPS Analysis by Distribution Channel, 2024 to 2034

Figure 140: South Asia and Pacific Market Y-o-Y Growth (%) Projections by Distribution Channel, 2024 to 2034

Figure 141: South Asia and Pacific Market Attractiveness by Product Type, 2024 to 2034

Figure 142: South Asia and Pacific Market Attractiveness by Installation Type, 2024 to 2034

Figure 143: South Asia and Pacific Market Attractiveness by Distribution Channel, 2024 to 2034

Figure 144: South Asia and Pacific Market Attractiveness by Country, 2024 to 2034

Figure 145: East Asia Market Value (US$ Million) by Product Type, 2024 to 2034

Figure 146: East Asia Market Value (US$ Million) by Installation Type, 2024 to 2034

Figure 147: East Asia Market Value (US$ Million) by Distribution Channel, 2024 to 2034

Figure 148: East Asia Market Value (US$ Million) by Country, 2024 to 2034

Figure 149: East Asia Market Value (US$ Million) Analysis by Country, 2019 to 2034

Figure 150: East Asia Market Volume (Units) Analysis by Country, 2019 to 2034

Figure 151: East Asia Market Value Share (%) and BPS Analysis by Country, 2024 to 2034

Figure 152: East Asia Market Y-o-Y Growth (%) Projections by Country, 2024 to 2034

Figure 153: East Asia Market Value (US$ Million) Analysis by Product Type, 2019 to 2034

Figure 154: East Asia Market Volume (Units) Analysis by Product Type, 2019 to 2034

Figure 155: East Asia Market Value Share (%) and BPS Analysis by Product Type, 2024 to 2034

Figure 156: East Asia Market Y-o-Y Growth (%) Projections by Product Type, 2024 to 2034

Figure 157: East Asia Market Value (US$ Million) Analysis by Installation Type, 2019 to 2034

Figure 158: East Asia Market Volume (Units) Analysis by Installation Type, 2019 to 2034

Figure 159: East Asia Market Value Share (%) and BPS Analysis by Installation Type, 2024 to 2034

Figure 160: East Asia Market Y-o-Y Growth (%) Projections by Installation Type, 2024 to 2034

Figure 161: East Asia Market Value (US$ Million) Analysis by Distribution Channel, 2019 to 2034

Figure 162: East Asia Market Volume (Units) Analysis by Distribution Channel, 2019 to 2034

Figure 163: East Asia Market Value Share (%) and BPS Analysis by Distribution Channel, 2024 to 2034

Figure 164: East Asia Market Y-o-Y Growth (%) Projections by Distribution Channel, 2024 to 2034

Figure 165: East Asia Market Attractiveness by Product Type, 2024 to 2034

Figure 166: East Asia Market Attractiveness by Installation Type, 2024 to 2034

Figure 167: East Asia Market Attractiveness by Distribution Channel, 2024 to 2034

Figure 168: East Asia Market Attractiveness by Country, 2024 to 2034

Figure 169: Middle East and Africa Market Value (US$ Million) by Product Type, 2024 to 2034

Figure 170: Middle East and Africa Market Value (US$ Million) by Installation Type, 2024 to 2034

Figure 171: Middle East and Africa Market Value (US$ Million) by Distribution Channel, 2024 to 2034

Figure 172: Middle East and Africa Market Value (US$ Million) by Country, 2024 to 2034

Figure 173: Middle East and Africa Market Value (US$ Million) Analysis by Country, 2019 to 2034

Figure 174: Middle East and Africa Market Volume (Units) Analysis by Country, 2019 to 2034

Figure 175: Middle East and Africa Market Value Share (%) and BPS Analysis by Country, 2024 to 2034

Figure 176: Middle East and Africa Market Y-o-Y Growth (%) Projections by Country, 2024 to 2034

Figure 177: Middle East and Africa Market Value (US$ Million) Analysis by Product Type, 2019 to 2034

Figure 178: Middle East and Africa Market Volume (Units) Analysis by Product Type, 2019 to 2034

Figure 179: Middle East and Africa Market Value Share (%) and BPS Analysis by Product Type, 2024 to 2034

Figure 180: Middle East and Africa Market Y-o-Y Growth (%) Projections by Product Type, 2024 to 2034

Figure 181: Middle East and Africa Market Value (US$ Million) Analysis by Installation Type, 2019 to 2034

Figure 182: Middle East and Africa Market Volume (Units) Analysis by Installation Type, 2019 to 2034

Figure 183: Middle East and Africa Market Value Share (%) and BPS Analysis by Installation Type, 2024 to 2034

Figure 184: Middle East and Africa Market Y-o-Y Growth (%) Projections by Installation Type, 2024 to 2034

Figure 185: Middle East and Africa Market Value (US$ Million) Analysis by Distribution Channel, 2019 to 2034

Figure 186: Middle East and Africa Market Volume (Units) Analysis by Distribution Channel, 2019 to 2034

Figure 187: Middle East and Africa Market Value Share (%) and BPS Analysis by Distribution Channel, 2024 to 2034

Figure 188: Middle East and Africa Market Y-o-Y Growth (%) Projections by Distribution Channel, 2024 to 2034

Figure 189: Middle East and Africa Market Attractiveness by Product Type, 2024 to 2034

Figure 190: Middle East and Africa Market Attractiveness by Installation Type, 2024 to 2034

Figure 191: Middle East and Africa Market Attractiveness by Distribution Channel, 2024 to 2034

Figure 192: Middle East and Africa Market Attractiveness by Country, 2024 to 2034

Frequently Asked Questions

What is the Estimated Valuation of the Baby Car Safety Seat Market in 2024?

The baby car safety seat market is predicted to be worth USD 5.5 billion in 2024.

What is the Sales Forecast for Baby Car Safety Seats through 2034?

The baby car safety seat market is expected to reach a valuation of USD 10.0 billion by 2034.

At What Rate is the Baby Car Safety Seat Market Expected to Grow?

The baby car safety seat market is expected to rise at a CAGR of 6.2% from 2024 to 2034.

Who are the Key Manufacturers of the Baby Car Safety Seat Market?

Artsana Group, Britax, Clek Inc., and Diono LLC are among the major companies actively contributing to the growth of the global Baby Car Safety Seat market.

Which Country Holds The Top Position In Global Baby Car Safety Seat Market?

The market in South Korea is expected to register a CAGR of 8.0% through 2034.

Explore Baby Products Insights

Future Market Insights

Baby Car Safety Seat Market