The Powder Packing Machine Market is estimated to be valued at USD 4.8 billion in 2025 and is projected to reach USD 6.3 billion by 2035, registering a compound annual growth rate (CAGR) of 2.8% over the forecast period.
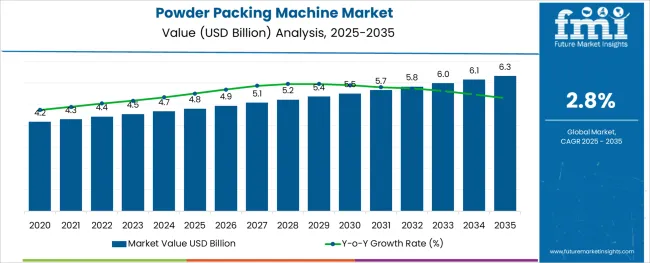
The powder packing machine market is witnessing sustained growth as manufacturers across diverse industries seek efficient, precise, and scalable packaging solutions. Automation and digital controls have transformed traditional packaging lines into intelligent systems capable of reducing waste, minimizing downtime, and supporting multi-format operations.
The increasing demand for hygienic and contamination-free packaging, particularly in food and pharmaceutical sectors, is prompting the adoption of machines equipped with clean in place capabilities, servo-driven technology, and integrated inspection systems. Advancements in modular design and plug and play architectures are further enabling faster changeovers and reduced operational complexity.
The rapid expansion of e-commerce and nutraceutical distribution channels has created additional pressure for mid-capacity machines that can balance speed, accuracy, and cost. Additionally, investments in sustainable packaging materials and energy-efficient machinery are aligning with global environmental targets. As industry standards evolve, the market is expected to expand through solutions that combine regulatory compliance with automation and real-time data intelligence.
The market is segmented by Automation Solution, Product Capacity, and End Use and region. By Automation Solution, the market is divided into Automatic, Semi-automatic, and Manual. In terms of Product Capacity, the market is classified into 1,500 - 2,000 pouches/hour, 2,000 - 2,500 pouches/hour, Above 2,500 pouches/hour, Up to 500 pouches/ hour, 500 - 1,000 pouches/ hour, and 1,000 - 1,500 pouches/ hour.
Based on End Use, the market is segmented into Food, Pharmaceutical, and FMCG products. Regionally, the market is classified into North America, Latin America, Western Europe, Eastern Europe, Balkan & Baltic Countries, Russia & Belarus, Central Asia, East Asia, South Asia & Pacific, and the Middle East & Africa.
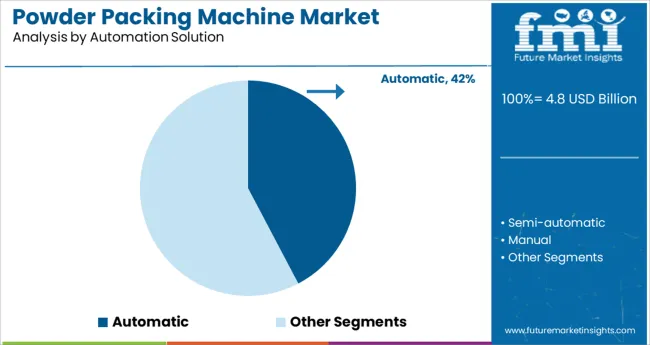
The automatic category under automation solution is projected to account for 42.3% of the total market revenue in 2025, placing it as the leading segment. This prominence is being driven by the widespread need to improve operational efficiency, reduce manual intervention, and meet the quality and consistency demands of mass production.
Automatic powder packing machines have gained favor due to their capacity to deliver higher output with consistent seal integrity, integrated sensors for error detection, and user-friendly interfaces. These systems are being adopted across industries for their minimal downtime and ability to support real-time monitoring through programmable logic controllers and IoT integration.
Additionally, the shift toward smart factories and Industry 4.0 adoption has further fueled the transition from semi-automatic to fully automatic solutions. Their contribution to labor cost reduction and regulatory compliance has reinforced their stronghold in both emerging and mature packaging environments.
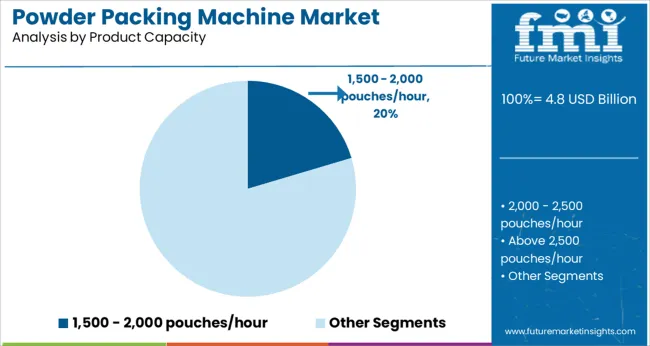
The 1500 to 2000 pouches per hour capacity range is expected to hold 20.4% of the total market share in 2025, emerging as a prominent segment for medium-scale operations. This range offers an optimal balance between production speed and equipment cost, making it suitable for mid-sized manufacturers with growing volume requirements.
Machines in this capacity band are often chosen for their flexibility in handling multiple product types and formats, without the complexity associated with high-speed industrial lines. Their adaptability, compact design, and lower maintenance needs make them ideal for both stand-alone and integrated systems.
Furthermore, the ease of validation and shorter training curves for operators have enhanced their acceptance across food and nutraceutical sectors. As demand for diversified product SKUs increases, this segment is expected to maintain its relevance by supporting flexible and cost-effective batch production.
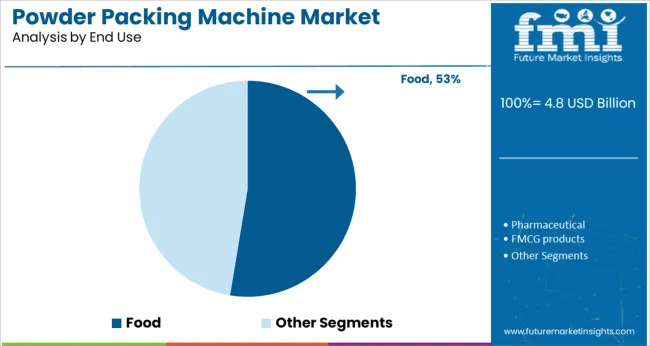
The food industry segment is projected to account for 52.6% of the total powder packing machine market revenue in 2025, establishing it as the most dominant end use category. This leadership is driven by the extensive need for packaging dry food powders including spices, flour, milk powder, coffee, and protein blends.
The sector’s stringent requirements for hygiene, shelf stability, and tamper-proof packaging have prompted the widespread adoption of automated machines with contamination control and nitrogen flushing systems. Additionally, changing consumer preferences toward convenience packaging and portion-controlled formats are accelerating machine upgrades in food processing facilities.
Regulatory compliance with food safety standards such as HACCP and FSSC has further influenced equipment specification and procurement strategies. As private label brands, functional foods, and health-oriented products proliferate, the food industry continues to lead in investing in precision-driven powder packing technologies tailored for diverse product types and packaging configurations.
The Powder Packing Machine Market is expected to be driven by the increasing growth of the food industry, escalating the sales of powder packing machines during the forecast period. A growing number of populations is anticipated to positively influence the development of powder packing machines because powder packing machines are used widely during packaging baby food.
An increasing number of coffee shops and restaurants are expected to increase the sales of powder packing machines because powder packing machine aids in increasing production. As a result, the product can be delivered to the distributors in a short period.
Apart from this, many spices are available in the market in powder form, which further intensifies the growth of the Powder Packing Machine Market. An increasing number of nuclear families positively influences the sales of powder packing machines during the forecast period because it increases the sales of small pouches of different products such as tea, coffee, and different spices. Automatic and modern powder packing machines offer a wide range of durable and flexible pouch designs along with different sizes. The pouches can be customized according to the needs and requirements of clients, fueling the sales of powder packing machines.
Powder packing machines are extensively used in fast-fast-moving consumer goods, especially for detergents which are expected to stimulate the sales of powder packing machines during the forecast period. Increasing competition between food manufacturing companies is expected to boost the demand for powder packing machines because the product aids in reducing wastage. In addition, some medicines are also available in the market in powder form and can make a massive impact on the global powder packing machine.
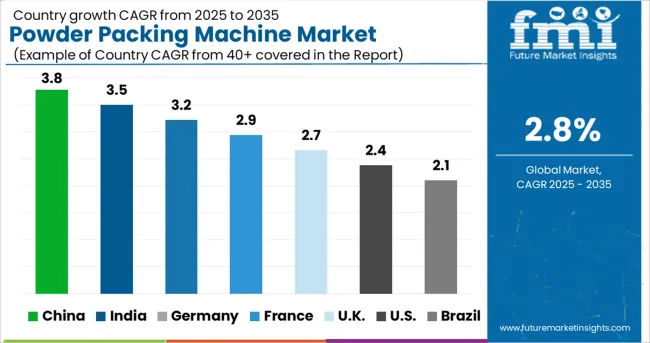
The Asia-pacific market dominates the market with e-commerce expanding its space and packaging production rising in the region.
A new market research report on Asia Pacific's power packing machine market explains that the government has helped the companies to go through the phase of a pandemic. The major companies expanding their businesses along with the new market spaces settle down.
The growing E-commerce spaces and how these spaces add up new components to them are fueling the sales of powder packing machines. The countries like India and China are setting up manufacturing units for packaging production along with new SMEs and Large enterprises recovering through the course of the pandemic and moving upwards.
North America is expected to witness healthy growth during the forecast period. Europe is also anticipated to grow fast for the early adopter. But Latin America and Middle East & Africa regions are expected to be sluggish in the upcoming decade, pushing the overall sales of powder packing machines.
The start-up ecosystem has grown with the new manufacturing units set up while there are multiple e-commerce startups that are adding their own powder packing machines and production units. These companies focus on creating more and more varieties of pouches with new designs and sizes, fueling the overall demand for powder packing machines.
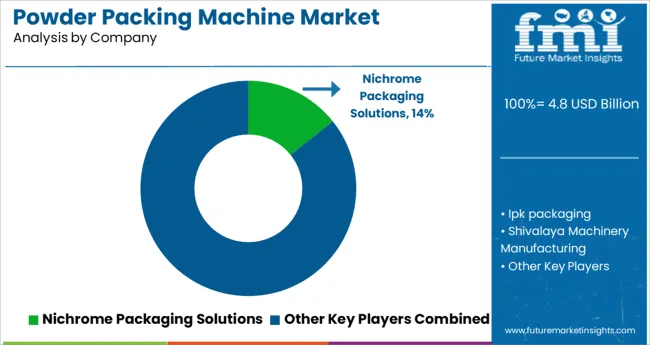
Key players are increasing their production capacity and launching new products to attract new customers. The powder packaging machine industry players brace themselves to garner a significant market share by resorting to innovation and strong Research and Development capabilities.
| Report Attribute | Details |
|---|---|
| Growth Rate | CAGR of 2.8% from 2025 to 2035 |
| Base Year for Estimation | 2025 |
| Historical Data | 2020 to 2024 |
| Forecast Period | 2025 to 2035 |
| Quantitative Units | Revenue in USD Million and CAGR from 2025 to 2035 |
| Report Coverage | Revenue Forecast, Volume Forecast, Company Ranking, Competitive Landscape, Growth Factors, Trends, and Pricing Analysis |
| Segments Covered | Automation Solution, End Use, Product Capacity, Region |
| Regions Covered | North America; Latin America; Western Europe; Eastern Europe; The Asia Pacific excluding Japan; Japan; The Middle East and Africa |
| Key Countries Profiled | The USA, Canada, Brazil, Argentina, Germany, The UK, France, Spain, Italy, Nordics, BENELUX, Australia & New Zealand, China, India, GCC Countries, South Africa |
| Key Companies Profiled | Nichrome Packaging Solutions; Ipk packaging; Shivalaya Machinery Manufacturing Company; Viking Masek Global Packaging Technologies |
| Customization | Available Upon Request |
The global powder packing machine market is estimated to be valued at USD 4.8 USD billion in 2025.
It is projected to reach USD 6.3 USD billion by 2035.
The market is expected to grow at a 2.8% CAGR between 2025 and 2035.
The key product types are automatic, semi-automatic and manual.
1,500 - 2,000 pouches/hour segment is expected to dominate with a 20.4% industry share in 2025.


Our Research Products

The "Full Research Suite" delivers actionable market intel, deep dives on markets or technologies, so clients act faster, cut risk, and unlock growth.

The Leaderboard benchmarks and ranks top vendors, classifying them as Established Leaders, Leading Challengers, or Disruptors & Challengers.

Locates where complements amplify value and substitutes erode it, forecasting net impact by horizon

We deliver granular, decision-grade intel: market sizing, 5-year forecasts, pricing, adoption, usage, revenue, and operational KPIs—plus competitor tracking, regulation, and value chains—across 60 countries broadly.

Spot the shifts before they hit your P&L. We track inflection points, adoption curves, pricing moves, and ecosystem plays to show where demand is heading, why it is changing, and what to do next across high-growth markets and disruptive tech

Real-time reads of user behavior. We track shifting priorities, perceptions of today’s and next-gen services, and provider experience, then pace how fast tech moves from trial to adoption, blending buyer, consumer, and channel inputs with social signals (#WhySwitch, #UX).

Partner with our analyst team to build a custom report designed around your business priorities. From analysing market trends to assessing competitors or crafting bespoke datasets, we tailor insights to your needs.
Supplier Intelligence
Discovery & Profiling
Capacity & Footprint
Performance & Risk
Compliance & Governance
Commercial Readiness
Who Supplies Whom
Scorecards & Shortlists
Playbooks & Docs
Category Intelligence
Definition & Scope
Demand & Use Cases
Cost Drivers
Market Structure
Supply Chain Map
Trade & Policy
Operating Norms
Deliverables
Buyer Intelligence
Account Basics
Spend & Scope
Procurement Model
Vendor Requirements
Terms & Policies
Entry Strategy
Pain Points & Triggers
Outputs
Pricing Analysis
Benchmarks
Trends
Should-Cost
Indexation
Landed Cost
Commercial Terms
Deliverables
Brand Analysis
Positioning & Value Prop
Share & Presence
Customer Evidence
Go-to-Market
Digital & Reputation
Compliance & Trust
KPIs & Gaps
Outputs
Full Research Suite comprises of:
Market outlook & trends analysis
Interviews & case studies
Strategic recommendations
Vendor profiles & capabilities analysis
5-year forecasts
8 regions and 60+ country-level data splits
Market segment data splits
12 months of continuous data updates
DELIVERED AS:
PDF EXCEL ONLINE
Leading Providers & Market Share in Powder Packing Machines
Powdered Cellulose Market Analysis - Size, Share, and Forecast Outlook 2025 to 2035
Powdered Soft Drinks Market Size and Share Forecast Outlook 2025 to 2035
Powder Dispenser Market Analysis by Product Type, Size, Dispensing Mode, End-use Industry, and Region through 2025 to 2035
Analysis and Growth Projections for Powder Induction and Dispersion Systems Business
Key Players & Market Share in Powder Dispenser Manufacturing
Powder Injection Molding Market Growth – Trends & Forecast 2025 to 2035
Powdered Fats Market – Growth, Demand & Industrial Applications
Powdered Beverage Market Outlook – Growth, Demand & Forecast 2024-2034
Powder Feed Center Market
Powder Funnels Market
Powdered Hand Soap Market
Powder Coating Guns Market
Dry Powder Inhaler Market Size and Share Forecast Outlook 2025 to 2035
Egg Powder Market - Size, Share, and Forecast Outlook 2025 to 2035
Lip Powder Market Analysis by Form, End-User, Sales Channel and Region from 2025 to 2035
Dry Powder Refilling Machine Market
Baby Powder Market - Size, Share, and Forecast 2025 to 2035
Milk Powder Packaging Market Size and Share Forecast Outlook 2025 to 2035
Iron Powder Market - Trends & Forecast 2025 to 2035

Thank you!
You will receive an email from our Business Development Manager. Please be sure to check your SPAM/JUNK folder too.
Chat With
MaRIA