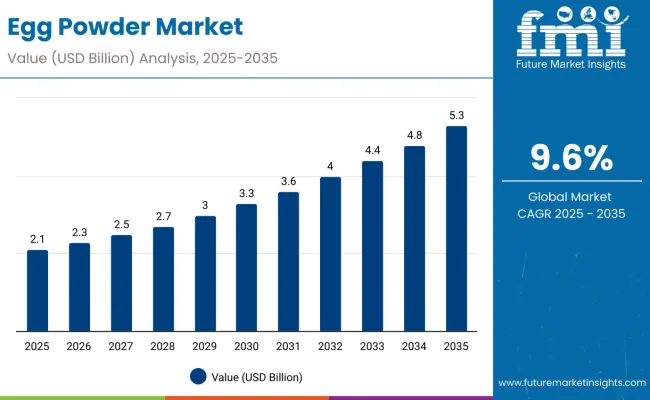
The egg powder market is estimated to be valued at USD 2.1 billion in 2025 and is projected to reach USD 5.3 billion by 2035, registering a compound annual growth rate (CAGR) of 9.6% over the forecast period. The market is expected to add an absolute dollar opportunity of USD 3.2 billion during this period.
Quick Stats for Egg Powder Market
| Metric | Value |
|---|---|
| Market Size (2025) | USD 2.1 Billion |
| Market Size (2035) | USD 5.3 Billion |
| Global Market CAGR (2025 to 2035) | 9.6% |
This reflects a 2.5 times growth over the decade. The market evolution is expected to be shaped by increasing demand for convenient, high-protein ingredients, expanding bakery and confectionery industries, and growing applications in processed and functional foods across both developed and emerging regions.
By 2030, the market is likely to reach USD 3.3 billion, accounting for USD 1.2 billion in incremental value over the first half of the decade. The remaining USD 2.0 billion is expected during the second half, suggesting a back-loaded growth pattern driven by technological advances in spray-drying processes, expansion into emerging markets, and rising demand for protein-rich food ingredients globally.
The market holds a strong position across its parent industries, reflecting its rising adoption in bakery, confectionery, and processed food applications. Within the protein ingredients segment, egg powder contributes notably as a high-quality, versatile protein source, with its share estimated at about 18%. In the bakery and confectionery market, its share is estimated at 12%, supported by its functional properties such as foaming, emulsification, and binding. Within the nutritional supplements segment, egg powder accounts for nearly 20%, being a preferred ingredient in protein-rich formulations. In processed food products, it holds around 10%, driven by demand for convenience and longer shelf life. Across these parent markets, its contribution underscores both nutritional importance and industrial utility.
The market is being driven by increasing demand for convenient, protein-rich food ingredients and rising consumption of bakery and confectionery products globally. Innovations are being observed in spray-drying processes and enhanced functional properties, enabling incorporation in diverse formulations. Developments include capacity expansions in Asia-Pacific, North America, and Europe to meet rising regional demand. Trends show a shift toward clean-label and fortified protein ingredients; however, egg powder remains dominant due to nutritional value, cost-effectiveness, and versatility in food manufacturing.
Egg powder’s unique ability to provide high-quality, protein-rich nutrition, long shelf life, and versatility across multiple food applications is driving its adoption. Its functional properties make it indispensable in bakery, confectionery, processed foods, and nutritional supplement formulations, where protein content, texture, and convenience are critical.
Rising demand for convenient, protein-enriched ingredients is further propelling market growth, supported by increasing health consciousness, the expansion of bakery and processed food industries, and growing consumer preference for fortified foods. Technological advancements in spray-drying processes and improved handling techniques are enhancing product quality, solubility, and functional properties, making egg powder an attractive ingredient for diverse formulations.
Government initiatives promoting food security, along with rising investments in food manufacturing infrastructure and expanding global supply chains, are strengthening the market outlook. As food industries increasingly prioritize nutrition, convenience, and cost efficiency, egg powder continues to gain traction. With manufacturers focusing on innovation, clean-label formulations, and mass production scalability, the market is expected to witness steady expansion across bakery, confectionery, processed foods, and supplement applications.
The market is segmented by type, end user, and region. By type, the market is categorized into egg white powder, whole egg powder, and egg yolk powder. By end user, the market is segmented into food & beverages (bakery, confectionery, sauces & dressing, and others), personal care & cosmetics, pharmaceutical applications, dietary supplements, animal feed & pet food, HoReCa (hotels, restaurants, cafes), and others across. Regionally, the market spans North America, Western Europe, Eastern Europe, South Asia and Pacific, East Asia, Latin America, and the Middle East & Africa.
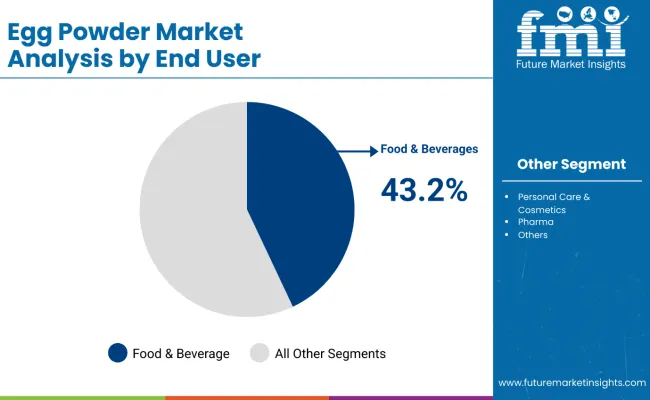
Food & beverage applications are poised to dominate the egg powder market, accounting for an estimated 43.2% of total consumption in 2025. Egg powder plays a critical role in commercial food production, particularly in bakery products, where it is used for binding, leavening, and enhancing texture in bread, cakes, cookies, and pastries. Its consistent protein content and emulsification properties also make it indispensable in processed foods such as sauces, dressings, mayonnaise, and ready-to-eat meals.
The growth of this segment is driven by the expansion of global food processing industries and rising consumer demand for convenient, shelf-stable products. Egg powder allows manufacturers to maintain consistent product quality, reduce production costs, and eliminate reliance on cold chain logistics. Its ability to standardize protein content ensures uniformity in large-scale production, making it an efficient alternative to fresh eggs.
Beyond bakery and processed foods, egg powder is increasingly used in pasta and confectionery applications. Pasta manufacturers leverage egg powder to enhance nutritional value and replicate traditional egg pasta characteristics without the handling challenges of fresh eggs. In confectionery, it provides stable foams and structural integrity for nougats, caramels, and chocolate products. Its versatility across sweet and savory applications, combined with long shelf life and reliable nutrition, establishes food & beverages as the leading driver of egg powder demand.
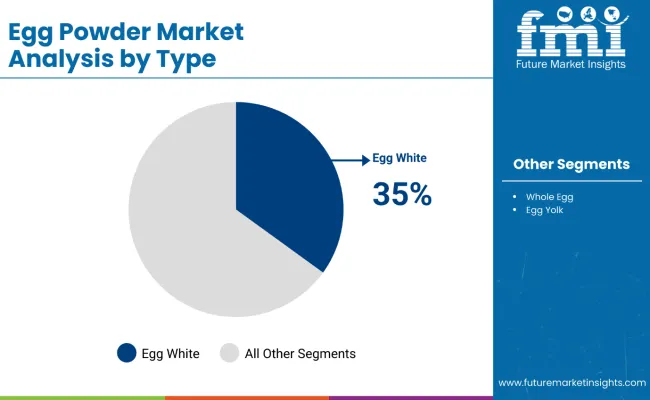
Egg white powder is projected to capture a commanding 35% share of the egg powder market by 2025, driven by its exceptional protein content and broad application versatility. Unlike whole egg or yolk powders, egg white powder provides pure protein without fat content, making it particularly valuable for health-conscious consumers and specialized applications. Its superior foaming and binding properties make it indispensable in bakery products, protein supplements, and functional food formulations where texture and nutritional profile are critical.
The dominance of egg white powder is further supported by growing demand from the sports nutrition and dietary supplement industries, where high-quality protein sources command premium pricing. Food manufacturers prefer egg white powder for its neutral flavor profile, excellent solubility, and ability to enhance product texture without adding unwanted fats or cholesterol.
Advanced processing technologies have improved the functional properties of egg white powder, enabling applications in everything from meringues and marshmallows to protein bars and meal replacement products. Its clean label appeal and natural origin position egg white powder as a preferred alternative to synthetic protein sources in premium food applications.
The egg powder market is gaining traction because of convenience, long shelf life, and broad applicability across food processing, bakery, nutraceutical, and even cosmetics. It offers a stable, protein-rich ingredient that does not require refrigeration, which makes it highly attractive for industrial users and consumers seeking easy-to-use products. Demand is also supported by rising health consciousness, protein-rich diets, and the preference for ingredients that can fit into multiple formulations. Growth in emerging markets with expanding middle classes is further fueling adoption.
Restraints on the market come from volatility in raw egg supply, frequent disease outbreaks in poultry, and the resulting price swings. Food safety remains a heavy responsibility, as producers must invest in pasteurization and quality control to minimize risks such as salmonella contamination. Competition from plant-based egg substitutes is another challenge, as vegan and clean-label alternatives continue to gain traction among younger and urban consumers. Ethical concerns around animal welfare and sustainability also create reputational risks for the industry.
Key trends include innovation in spray-drying and solubility technologies, which are expanding egg powder’s role in high-performance applications like sports nutrition, infant formula, and medical foods. Clean-label demand is shaping the market, with organic, cage-free, and non-GMO variants becoming more important. Regional dynamics are shifting, with Asia Pacific driving growth due to rising processed food consumption, while North America is witnessing strong demand in supplements and protein-rich convenience products. Sustainability and transparency are no longer optional but critical levers for competitive advantage.
Convenience, Shelf Stability, and Nutritional Value Driving Adoption
Food manufacturers increasingly adopt egg powder to eliminate cold chain requirements and achieve consistent product quality across global operations. The ingredient's extended shelf life and standardized nutritional profile enable efficient inventory management and reduced food waste. Growing consumer demand for high-protein foods supports adoption in both traditional and innovative applications. Industrial bakers benefit from improved handling convenience and reduced labor costs compared to fresh egg processing. The technology's ability to maintain nutritional integrity while eliminating food safety risks associated with fresh eggs strengthens its value proposition for large-scale food production.
Raw Material Price Volatility and Processing Costs Restrain Growth
Fluctuating egg prices due to disease outbreaks, seasonal variations, and supply chain disruptions impact egg powder production costs and market predictability. Avian influenza and other poultry diseases periodically reduce egg availability, creating supply shortages and price spikes. High energy costs for spray-drying and freeze-drying processes increase manufacturing expenses. Competition from alternative protein sources, including plant-based options and synthetic proteins, challenges market share in some applications. Consumer preference for fresh ingredients in premium food products limits adoption in certain market segments.
| Countries | CAGR (2025 to 2035) |
|---|---|
| India | 13.8% |
| Germany | 13.2% |
| China | 8.5% |
| United States | 7.2% |
| South Korea | 6.9% |
| Japan | 6.8% |
| Canada | 6.2% |
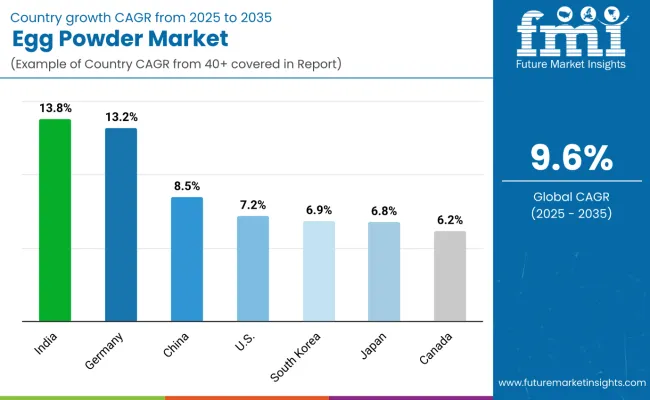
The egg powder market is experiencing varied growth across top seven countries. India leads with a CAGR of 13.8% through 2035, supported by growing protein awareness, and rising disposable incomes make it the most dynamic market. Germany follows closely with a 13.2% CAGR, driven by advanced food technologies, strong organic demand, and clean-label trends. China records steady growth at 8.5%, leveraging large-scale egg production and increasing Western-style food adoption. The USA market grows at 7.2%, supported by sports nutrition and organic food demand. South Korea (6.9%) and Japan (6.8%) show moderate growth, emphasizing premium applications, elderly nutrition, and functional foods. Canada grows at 6.2%, benefiting from agricultural infrastructure and export potential.
The report covers an in-depth analysis of 40+ countries; seven top-performing OECD countries are highlighted below.
The egg powder market in India is projected to grow at a CAGR of 13.8% from 2025 to 2035, driven by rapid expansion of the food processing industry and growing protein awareness among urban consumers. The country's large vegetarian population increasingly embraces egg-based products as a complete protein source, while expanding bakery and confectionery sectors drive commercial demand. Government initiatives supporting food processing infrastructure and protein security create favorable conditions for market development. Rising disposable incomes and changing dietary preferences support premium protein product adoption.
Revenue from egg powder in Germany is forecast to grow at a CAGR of 13.2%from 2025 to 2035, supported by advanced food processing technologies and strong demand for organic and clean label ingredients. The country's leadership in bakery innovation and processed food manufacturing drives adoption of specialized egg powder formulations. Stringent food safety regulations favor standardized ingredients with consistent quality profiles. Consumer preference for natural protein sources over synthetic alternatives supports market expansion in both industrial and retail segments.
Sales for egg powder in China are projected to grow at a CAGR of 8.5% from 2025 to 2035, driven by expanding food processing industries and growing Western-style food consumption patterns. The country's large-scale egg production capabilities support domestic processing development and export opportunities. Rising health consciousness and protein consumption among urban populations drive demand across food and supplement applications. Government support for agricultural processing and food security initiatives creates favorable conditions for industry expansion.
Demand for egg powder in the USA is expected to grow at a CAGR of 7.2% from 2025 to 2035, supported by mature food processing industries and growing health and wellness trends. Advanced protein supplementation markets and sports nutrition segments drive premium egg powder demand. Industrial food manufacturers adopt egg powder to achieve consistent quality and reduce supply chain complexity. Organic and free-range egg powder formulations address consumer preferences for sustainable and ethical food production.
Sales of egg powder in the South Korea are expected to grow at a CAGR of 6.9% from 2025 to 2035, driven by advanced food technology adoption and growing health consciousness among aging populations. The country's sophisticated food processing industry demands high-quality egg powder for confectionery, bakery, and processed food applications. Rising protein supplementation trends and expanding fitness culture support dietary supplement applications. Premium positioning and functional food development create opportunities for specialized formulations.
Revenue from egg powder in Japan is projected to grow at a CAGR of 6.8% from 2025 to 2035, led by precision food manufacturing and growing elderly nutrition requirements. The country's advanced food technology sector develops innovative applications combining traditional and modern processing techniques. Aging population trends increase demand for easily digestible protein sources. Premium positioning strategies favor high-quality egg powder in specialized nutrition and functional food applications.
The egg powder market in Canada is expected to grow at a CAGR of 6.2% from 2025 to 2035, supported by strong agricultural infrastructure and expanding food processing capabilities. The country's cold climate advantages in egg production and storage support year-round processing operations. Export-oriented food manufacturers adopt egg powder to access international markets while maintaining quality standards. Growing health consciousness and protein supplementation trends drive domestic consumption growth.
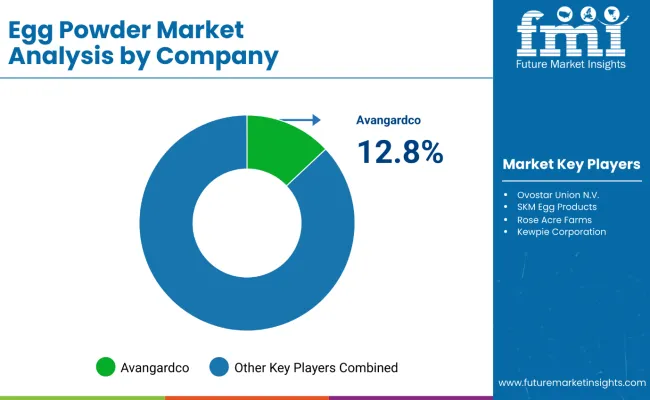
The market is moderately consolidated, featuring a mix of established agricultural processors, specialized ingredient manufacturers, and integrated poultry companies competing across production capacity, product quality, and application development. Market leader Avangardco holds a significant 12.8% share through vertically integrated operations combining poultry farming with advanced processing capabilities. Their strategy emphasizes consistent supply, standardized quality, and competitive pricing across diverse geographic markets.
Established players including Ovostar Union N.V., SKM Egg Products, and Rose Acre Farms focus on specialized formulations, organic options, and customized solutions for specific applications. These companies leverage advanced processing technologies, quality certifications, and direct customer relationships to differentiate their offerings. Their emphasis on functional performance, nutritional optimization, and supply chain reliability strengthens competitive positioning in the evolving market.
Emerging companies such as Kewpie Corporation concentrate on innovative processing technologies, premium formulations, and niche market applications. Their strengths include rapid product development capabilities, flexible manufacturing systems, and specialized expertise in functional food applications. Investment in advanced dehydration technologies and quality enhancement capabilities enables customization for diverse industry requirements and regional preferences.
| Item | Value |
|---|---|
| Quantitative Units | USD 2.1 Billion |
| By Type | Egg White Powder, Whole Egg Powder, and Egg Yolk Powder |
| By End User | Food & Beverages, Personal Care & Cosmetics, Pharmaceutical, Dietary Supplements, Animal Feed & Pet Food, HoReCa, and Others |
| Key Companies Profiled | Avangardco, Ovostar Union N.V., IGRECA, Bouwhuis Enthoven, Eurovo Group, Venkys, A.G. Foods, Jiangsu Kangde Egg Industry Co., Ltd., Farm Pride, Kewpie, Pulviver, and Interovo Egg Group BV |
| Regions Covered | North America, Latin America, Western Europe, Eastern Europe, South Asia and Pacific, East Asia, and Middle East & Africa |
| Country Covered | United States, Canada, United Kingdom, Germany, France, China, Japan, South Korea, Brazil, Australia and 40+ countries |
| Key Companies Profiled | Avangardco; Ovostar Union N.V.; SKM Egg Products; Rose Acre Farms; IGRECA; Bouwhuis Enthoven; Eurovo Group; Venky’s (India) Ltd.; A.G. Foods; Jiangsu Kangde Egg Industry Co., Ltd.; Farm Pride; Kewpie; Pulviver; Interovo Egg Group BV. |
| Additional Attributes | Dollar sales by product type and distribution channel, regional consumption trends, competitive landscape, consumer preferences for organic versus conventional ingredients, integration with sustainable sourcing practices, innovations in processing and drying technology, and standardization of functional and nutritional quality for diverse food, bakery, and supplement applications |
The global egg powder market is estimated to be valued at USD 2.1 billion in 2025.
The market size for the egg powder market is projected to reach USD 5.3 billion by 2035.
The egg powder market is expected to grow at a CAGR of 9.6% between 2025 and 2035.
The egg white powder segment is projected to lead in the egg powder market with 35% share in 2025.
In terms of application, the food & beverages segment is expected to command 43.2% of share in the egg powder market in 2035.


Full Research Suite comprises of:
Market outlook & trends analysis
Interviews & case studies
Strategic recommendations
Vendor profiles & capabilities analysis
5-year forecasts
8 regions and 60+ country-level data splits
Market segment data splits
12 months of continuous data updates
DELIVERED AS:
PDF EXCEL ONLINE
Egg White Powder Market Size and Share Forecast Outlook 2025 to 2035
Egg Membrane Powder Market
Eggshell Membrane Powder Market Size and Share Forecast Outlook 2025 to 2035
Egg Carton Market Size and Share Forecast Outlook 2025 to 2035
Egg Free Premix Market Size and Share Forecast Outlook 2025 to 2035
Egg Stabilizer Market Size and Share Forecast Outlook 2025 to 2035
Egg Protein Market Analysis - Size, Share, and Forecast Outlook 2025 to 2035
Egg-free Mayonnaise Market Size and Share Forecast Outlook 2025 to 2035
Egg Boiler Market Size and Share Forecast Outlook 2025 to 2035
Egg Processing Machine Market Size and Share Forecast Outlook 2025 to 2035
Egg Grading Machines Market Size and Share Forecast Outlook 2025 to 2035
Egg Breaking Machine Market Size and Share Forecast Outlook 2025 to 2035
Egg Replacement Ingredient Market Analysis - Size, Share & Forecast 2025 to 2035
Egg White Cubes Market Size and Share Forecast Outlook 2025 to 2035
Egg Yolk Oil Market Analysis - Size, Growth and Forecast 2025 to 2035
Egg Emulsifier Market Analysis - Size, Share, & Forecast Outlook 2025 to 2035
Egg and Egg Products Market Analysis - Size, Share, & Forecast Outlook 2025 to 2035
Egg Replacer Market Analysis - Size, Share, and Forecast 2025 to 2035
Egg Albumin Protein Market Analysis - Size, Share, & Forecast Outlook 2025 to 2035
Egg White Substitute Market Analysis – Size, Share, & Forecast Outlook 2025 to 2035

Thank you!
You will receive an email from our Business Development Manager. Please be sure to check your SPAM/JUNK folder too.
Chat With
MaRIA