Egg Replacer Market Size and Share Forecast Outlook 2025 to 2035

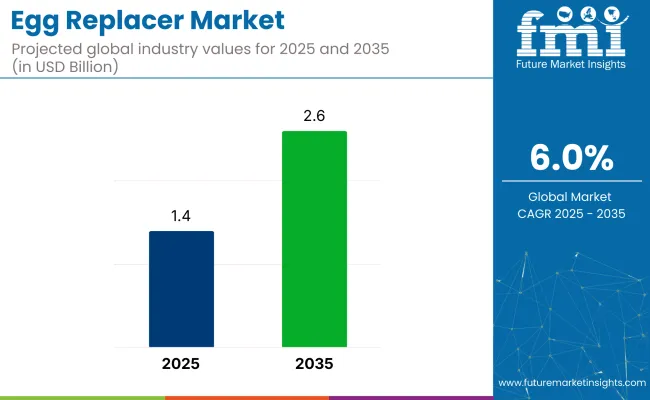
The global egg replacer market is valued at USD 1.4 billion in 2025 and is expected to reach USD 2.6 billion by 2035, reflecting a CAGR of 6.0%. Factors driving this growth include rising consumer demand for plant-based diets, increased incidence of egg allergies, and evolving food preferences.
Quick Stats for Egg Replacer Market

  • Market Value (2025): USD 1.4 billion
  • Forecast Value (2035): USD 2.6 billion
  • Forecast CAGR (2025-2035): 6.0%
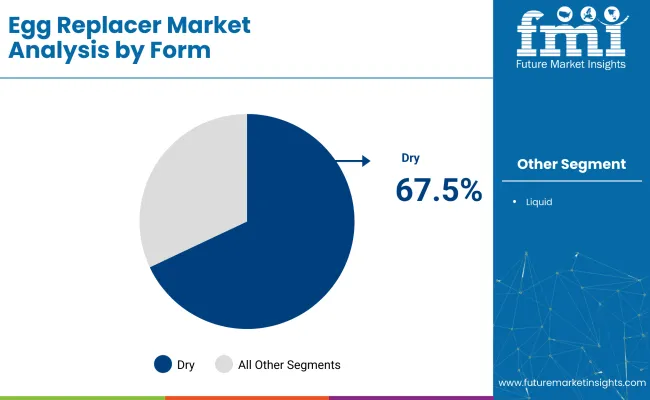
  • Form Leader in 2025: Dry Egg Replacer (67.5% Market Share)
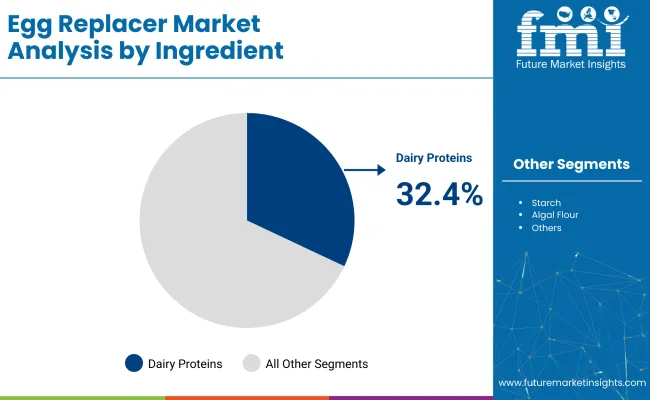
  • Top Ingredient Type: Dairy Proteins (32.4% Market Share)
  • Key Growth Region: AsiaPacific (fastest-growing market in Japan with 7.1% CAGR)

Egg Replacer Market

Metric Value
Estimated Size (2025) USD 1.4 billion
Projected value (2035) USD 2.6 billion
CAGR (2025 to 2035) 6.0%

Health-conscious consumers and flexitarian lifestyles are promoting the shift toward cholesterol-free, allergen-free alternatives, particularly in bakery, confectionery, and processed food applications. Additionally, the growing popularity of vegan baking and fortified food products has accelerated the need for functional egg substitutes in both commercial and household kitchens.

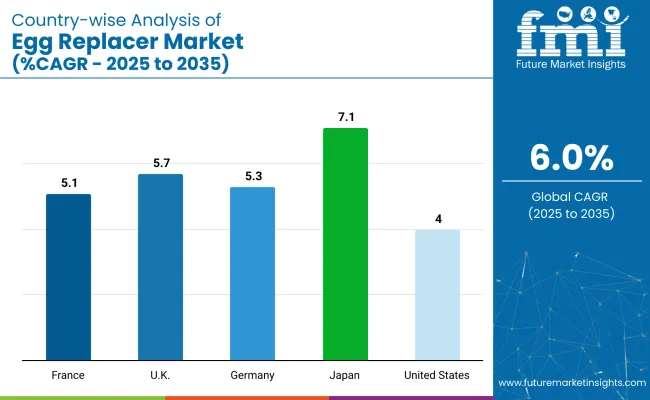
By 2025, dry egg replacers are expected to dominate the global market due to their practicality, long shelf life, and cost-effectiveness. Japan is anticipated to grow at a significant CAGR of 7.1%.Meanwhile, the UK and Germany closely follow this rapid growth with CAGRs of 5.7% and 5.3% respectively. Dairy proteins by ingredient type account for 32.4% of the market share, while dry egg replacer form holds a prominent share of 67.5% in 2025.

The market holds a relatively small percentage within the broader markets it belongs to, though its share is growing steadily. Within the plant-based food market, it has approximately 5-7% as egg replacers are a key component in plant-based diets. In the vegan food market, its share is around 8-10%, driven by the increasing preference for vegan baking and cooking.

In the food and beverage ingredients market, the share of egg replacers is estimated at 2-3%. The functional foods market and dairy alternatives market have smaller shares, around 1-2%, as egg replacers complement these larger categories.

Egg Replacer Market Analysis by Top Investment Segments

The market is segmented into form, ingredient, application, and region. By form, the market is divided into dry and liquid variants. In terms of ingredients, the segmentation includes dairy proteins, starch, algal flour, and soy-based products.

The application spectrum covers a wide array of food products, including biscuits, chocolates, cakes, mayonnaise, pasta, noodles, and bread. Regionally, the market is evaluated across North America, Latin America, Europe, East Asia, South Asia, Oceania, and the Middle East & Africa.

By Form, Dry Egg Replacers Account for 67.5% of the Market Share

Dry egg replacers are projected to remain the most dominant form through 2035, owing to their extended shelf life, cost-efficiency, and ease of transport. In 2025, dry variants are estimated to account for 67.5% of the global market share.
  • Dry form ensures minimal spoilage during storage and transit
  • Highly suitable for bakery and processed food industries
  • Economical compared to liquid forms
  • Rising adoption in countries with limited cold chain infrastructure

Egg Replacer Market By Form

By Ingredient, Dairy Proteins Account for 32.4% Market Share in 2025

Dairy proteins are expected to lead the ingredient segment due to their close nutritional profile to eggs and superior binding properties. In 2025, dairy proteins are projected to hold a 32.4% market share.
  • Superior protein quality and digestibility
  • Aligns with demand for clean-label, high-nutrient substitutes
  • Frequently used in high-protein snacks and baked goods
  • Easier to source compared to algae-based ingredients

Egg Replacer Market By Ingredient

By Application, the Cakes Segment Accounts for 27.2% of the Market Share

Within applications, cakes are set to dominate the market owing to the rapid global shift toward egg-free baking. In 2025, cakes are forecast to hold a 27.2% share of the application segment. Vital for structure and aeration in eggless cakes

  • Popular in vegan and allergen-free bakery chains
  • Increasing use in pre-mix cake formulations
  • Expanding penetration in North America and Europe

Top Egg Replacer Market Dynamics

Recent Trends in the Egg Replacer Market

  • Rising popularity of vegan baking and plant-based confectionery products is accelerating demand.
  • Increased R&D focus on algal and dairy protein-based egg alternatives is driving innovation.
  • Expansion of e-commerce and D2C food brands is boosting the availability of egg replacers.
  • Surge in product launches tailored to allergen-free and cholesterol-conscious consumers is being observed.

Key Challenges in the Egg Replacer Market
  • Limited sensory and textural replication of eggs in complex recipes hampers consumer acceptance.
  • Regulatory hurdles and inconsistent labeling standards across regions create entry barriers.
  • The high cost of specialized ingredients like algal flour raises final product prices.
  • Consumer perception issues in traditional markets still favor real eggs over substitutes.

Analyzing Top Countries Manufacturing and Supplying Egg Replacers

Country Wise Analysis Of Egg Replacer Market

The growth rates of the egg replacer market in the top five countries show notable variation. The USA is projected to grow at a CAGR of 4.0% from 2025 to 2035, driven by increasing plant-based and allergen-free consumption. The UK follows closely with a CAGR of 5.7%, fueled by the rise in veganism and stricter food labeling regulations.

Germany is expected to see a 5.3% CAGR, supported by the demand for clean-label, organic ingredients. France is projected to grow at 5.1%, with a focus on flexitarian preferences and premium products. Japan is the fastest-growing market at 7.1% CAGR, driven by health concerns and an aging population.

The report covers an in-depth analysis of 40+ countries; five top-performing OECD countries are highlighted below.

United States Egg Replacer Market Analysis

The egg replacer revenue in the USA is projected to expand at a CAGR of 4.0% from 2025 to 2035, supported by heightened consumer interest in plant-based and allergen-free diets. With approximately 39% of Americans incorporating plant-based alternatives into their meals, the demand for functional egg substitutes in baking and processed foods has surged.

  • Growing awareness of health and fitness among the population.
  • Robust food innovation pipeline driven by major FMCG brands.
  • Expansion of retail and e-commerce channels for egg replacer sales.

Egg Replacer Demand Analysis in the UK

The sales of the egg replacersin the UK are expected to grow at a CAGR of 5.7% from 2025 to 2035, driven by increasing demand for vegan alternatives and stricter food safety norms. British consumers are becoming more label-conscious and are actively seeking alternatives to common allergens such as eggs.

With veganism on the rise and supermarkets expanding their free-from food aisles, egg replacers are gaining popularity in baked goods and ready-to-eat meals. Additionally, the country’s sustainability efforts have influenced the food industry to reformulate with eco-friendly, plant-based ingredients.

  • Strong consumer shift toward ethical and vegan consumption.
  • Government support for allergen transparency in food labeling.
  • Increased penetration of egg-free bakery products in retail chains.

Germany Egg Replacer Sales Analysis

The revenue from egg replacersin Germany is anticipated to rise at a CAGR of 5.3% from 2025 to 2035, supported by the country’s deep-rooted organic food culture and demand for sustainable consumption. German consumers prefer high-protein, clean-label alternatives, making dairy protein-based egg replacers particularly attractive.

  • Increasing demand for organic and clean-label bakery ingredients.
  • Expansion of health-focused retail chains promoting egg alternatives.
  • Supportive government policies encouraging sustainable sourcing.

Egg Replacer MarketAnalysis in France

The egg replacer market in France is estimated to flourish at a CAGR of 5.1% from 2025 to 2035, influenced by the dual trends of culinary innovation and health consciousness. French food manufacturers are increasingly investing in reformulated products to reduce allergen exposure and accommodate plant-based preferences.

  • A growing flexitarian population demands plant-based alternatives.
  • Increasing investments in R&D for clean-label bakery solutions.
  • Premiumization of egg replacers in gourmet and artisanal foods.

Japan Egg Replacer Demand Analysis

Thesales of egg replacers in Japan are forecasted to register a CAGR of 7.1% from 2025 to 2035, making it one of the fastest-growing markets globally. Rising food safety concerns, coupled with an aging population seeking low-cholesterol diets, are propelling demand.

  • Increasing focus on cholesterol-free and allergy-safe ingredients.
  • Rising elderly population with dietary restrictions.
  • Expansion of plant-based snacks and ready-to-eat offerings.

Leading Egg Replacer Suppliers

The market is moderately consolidated, with a mix of global leaders and regional players shaping the competitive landscape. Prominent companies such as Corbion NV, Tate & Lyle Plc., Glanbia plc., Ingredion Incorporated, and BASF SE are at the forefront, leveraging their extensive R&D capabilities, robust distribution networks, and strategic partnerships to maintain and enhance their market positions.

Leading companies in the egg replacer market are strategically focusing on innovation and sustainability to align with evolving consumer preferences. Investments are being made in product development to enhance taste, texture, and nutritional value, particularly for vegan and allergen-free formulations. Strategic collaborations with food manufacturers and research institutions are enabling the creation of customized solutions and faster market penetration.

Recent Egg Replacer Industry News

In July 2025, BASF finalized the purchase of DOMO Chemicals’ 49% share in the Alsachimie joint venture, making BASF the sole owner of a key production entity for polyamide 6.6 precursors in France. This move strengthens BASF’s operational footprint and supply reliability in Europe, supporting its broader strategy in specialty ingredients and food solutions.

In April 2024, Glanbia completed the acquisition of Flavor Producers for USD 300 million to bolster its flavor portfolio.

Egg Replacer Market Report Scope

Report Attributes Details
Current Total Market Size (2025) USD 1.4 billion
Projected Market Size (2035) USD 2.6 billion
CAGR (2025 to 2035) 6.0%
Base Year for Estimation 2024
Historical Period 2020 to 2024
Projections Period 2025 to 2035
Market Analysis Parameters Revenue in USD billions/Volume in kilotons
By Form Dry, Liquid
By Ingredient Dairy Proteins, Starch, Algal Flour, Soy-based Products
By Application Biscuits, Chocolates, Cakes, Mayonnaise, Pasta, Noodles, Breads
Regions Covered North America, Latin America, Europe, Middle East and Africa, East Asia, South Asia, Oceania
Countries Covered United States, Canada, United Kingdom, Germany, France, China, Japan, South Korea, Brazil, Australia
Key Players BASF SE, Corbion NV, Tate & Lyle Plc., Glanbia plc, Ingredion Incorporated, MGP Ingredients, Enter-G Foods Inc., Dupont De Nemours and Company, Fiberstar, Puratos, and Danone Nutricia
Additional Attributes Dollar sales by value, market share analysis by region, and country-wise analysis

Key Segments

By Form:

As per form the industry has been categorized into Dry, Liquid

By Ingredient:

This segment is further categorized into Dairy Proteins, Starch, Algal Flour and Soy-based Products

By Application:

Application further Includes Biscuits, Chocolates, Cakes, Mayonnaise, Pasta, Noodles and Breads Swine

By Region:

Industry analysis has been carried out in key countries of North America, Latin America, Europe, East Asia, South Asia, Oceania and Middle East & Africa

Table of Content

  1. Executive Summary
    • Global Market Outlook
    • Demand-side Trends
    • Supply-side Trends
    • Technology Roadmap Analysis
    • Analysis and Recommendations
  2. Market Overview
    • Market Coverage / Taxonomy
    • Market Definition / Scope / Limitations
  3. Market Background
    • Market Dynamics
      • Drivers
      • Restraints
      • Opportunity
      • Trends
    • Scenario Forecast
      • Demand in Optimistic Scenario
      • Demand in Likely Scenario
      • Demand in Conservative Scenario
    • Opportunity Map Analysis
    • Product Life Cycle Analysis
    • Supply Chain Analysis
      • Supply Side Participants and their Roles
        • Producers
        • Mid-Level Participants (Traders/ Agents/ Brokers)
        • Wholesalers and Distributors
      • Value Added and Value Created at Node in the Supply Chain
      • List of Raw Material Suppliers
      • List of Existing and Potential Buyer’s
    • Investment Feasibility Matrix
    • Value Chain Analysis
      • Profit Margin Analysis
      • Wholesalers and Distributors
      • Retailers
    • PESTLE and Porter’s Analysis
    • Regulatory Landscape
      • By Key Regions
      • By Key Countries
    • Regional Parent Market Outlook
    • Production and Consumption Statistics
    • Import and Export Statistics
  4. Global Market Analysis 2020 to 2024 and Forecast, 2025 to 2035
    • Historical Market Size Value (USD Billion) & Volume (Kilotons) Analysis, 2020 to 2024
    • Current and Future Market Size Value (USD Billion) & Volume (Kilotons) Projections, 2025 to 2035
      • Y-o-Y Growth Trend Analysis
      • Absolute $ Opportunity Analysis
  5. Global Market Pricing Analysis 2020 to 2024 and Forecast 2025 to 2035
  6. Global Market Analysis 2020 to 2024 and Forecast 2025 to 2035, By Form
    • Introduction / Key Findings
    • Historical Market Size Value (USD Billion) & Volume (Kilotons) Analysis By Form, 2020 to 2024
    • Current and Future Market Size Value (USD Billion) & Volume (Kilotons) Analysis and Forecast By Form, 2025 to 2035
      • Dry
      • Liquid
    • Y-o-Y Growth Trend Analysis By Form, 2020 to 2024
    • Absolute $ Opportunity Analysis By Form, 2025 to 2035
  7. Global Market Analysis 2020 to 2024 and Forecast 2025 to 2035, By Ingredients
    • Introduction / Key Findings
    • Historical Market Size Value (USD Billion) & Volume (Kilotons) Analysis By Ingredients, 2020 to 2024
    • Current and Future Market Size Value (USD Billion) & Volume (Kilotons) Analysis and Forecast By Ingredients, 2025 to 2035
      • Dairy Proteins
      • Starch
      • Algal Flour
      • Soy-based Products
    • Y-o-Y Growth Trend Analysis By Ingredients, 2020 to 2024
    • Absolute $ Opportunity Analysis By Ingredients, 2025 to 2035
  8. Global Market Analysis 2020 to 2024 and Forecast 2025 to 2035, By Application
    • Introduction / Key Findings
    • Historical Market Size Value (USD Billion) & Volume (Kilotons) Analysis By Application, 2020 to 2024
    • Current and Future Market Size Value (USD Billion) & Volume (Kilotons) Analysis and Forecast By Application, 2025 to 2035
      • Biscuits
      • Chocolates
      • Chocolates
      • Cakes
      • Mayonnaise
      • Pasta
      • Noodles
      • Breads
    • Y-o-Y Growth Trend Analysis By Application, 2020 to 2024
    • Absolute $ Opportunity Analysis By Application, 2025 to 2035
  9. Global Market Analysis 2020 to 2024 and Forecast 2025 to 2035, By Region
    • Introduction
    • Historical Market Size Value (USD Billion) & Volume (Kilotons) Analysis By Region, 2020 to 2024
    • Current Market Size Value (USD Billion) & Volume (Kilotons) Analysis and Forecast By Region, 2025 to 2035
      • North America
      • Latin America
      • Western Europe
      • Eastern Europe
      • East Asia
      • South Asia & Pacific
      • Middle East and Africa
    • Market Attractiveness Analysis By Region
  10. North America Market Analysis 2020 to 2024 and Forecast 2025 to 2035, By Country
    • Historical Market Size Value (USD Billion) & Volume (Kilotons) Trend Analysis By Market Taxonomy, 2020 to 2024
    • Market Size Value (USD Billion) & Volume (Kilotons) Forecast By Market Taxonomy, 2025 to 2035
      • By Country
        • USA
        • Canada
        • Mexico
      • By Form
      • By Ingredients
      • By Application
    • Market Attractiveness Analysis
      • By Country
      • By Form
      • By Ingredients
      • By Application
    • Key Takeaways
  11. Latin America Market Analysis 2020 to 2024 and Forecast 2025 to 2035, By Country
    • Historical Market Size Value (USD Billion) & Volume (Kilotons) Trend Analysis By Market Taxonomy, 2020 to 2024
    • Market Size Value (USD Billion) & Volume (Kilotons) Forecast By Market Taxonomy, 2025 to 2035
      • By Country
        • Brazil
        • Argentina
        • Rest of LATAM
      • By Form
      • By Ingredients
      • By Application
    • Market Attractiveness Analysis
      • By Country
      • By Form
      • By Ingredients
      • By Application
    • Key Takeaways
  12. Western Europe Market Analysis 2020 to 2024 and Forecast 2025 to 2035, By Country
    • Historical Market Size Value (USD Billion) & Volume (Kilotons) Trend Analysis By Market Taxonomy, 2020 to 2024
    • Market Size Value (USD Billion) & Volume (Kilotons) Forecast By Market Taxonomy, 2025 to 2035
      • By Country
        • Germany
        • Italy
        • France
        • UK
        • Spain
        • BENELUX
        • Nordic
        • Rest of W.Europe
      • By Form
      • By Ingredients
      • By Application
    • Market Attractiveness Analysis
      • By Country
      • By Form
      • By Ingredients
      • By Application
    • Key Takeaways
  13. Eastern Europe Market Analysis 2020 to 2024 and Forecast 2025 to 2035, By Country
    • Historical Market Size Value (USD Billion) & Volume (Kilotons) Trend Analysis By Market Taxonomy, 2020 to 2024
    • Market Size Value (USD Billion) & Volume (Kilotons) Forecast By Market Taxonomy, 2025 to 2035
      • By Country
        • Russia
        • Hungary
        • Poland
        • Balkan & Baltics
        • Rest of E. Europe
      • By Form
      • By Ingredients
      • By Application
    • Market Attractiveness Analysis
      • By Country
      • By Form
      • By Ingredients
      • By Application
    • Key Takeaways
  14. East Asia Market Analysis 2020 to 2024 and Forecast 2025 to 2035, By Country
    • Historical Market Size Value (USD Billion) & Volume (Kilotons) Trend Analysis By Market Taxonomy, 2020 to 2024
    • Market Size Value (USD Billion) & Volume (Kilotons) Forecast By Market Taxonomy, 2025 to 2035
      • By Country
        • China
        • Japan
        • South Korea
      • By Form
      • By Ingredients
      • By Application
    • Market Attractiveness Analysis
      • By Country
      • By Form
      • By Ingredients
      • By Application
    • Key Takeaways
  15. South Asia & Pacific Market Analysis 2020 to 2024 and Forecast 2025 to 2035, By Country
    • Historical Market Size Value (USD Billion) & Volume (Kilotons) Trend Analysis By Market Taxonomy, 2020 to 2024
    • Market Size Value (USD Billion) & Volume (Kilotons) Forecast By Market Taxonomy, 2025 to 2035
      • By Country
        • India
        • Australia & New Zealand
        • ASEAN
        • Rest of SAP
      • By Form
      • By Ingredients
      • By Application
    • Market Attractiveness Analysis
      • By Country
      • By Form
      • By Ingredients
      • By Application
    • Key Takeaways
  16. Middle East and Africa Market Analysis 2020 to 2024 and Forecast 2025 to 2035, By Country
    • Historical Market Size Value (USD Billion) & Volume (Kilotons) Trend Analysis By Market Taxonomy, 2020 to 2024
    • Market Size Value (USD Billion) & Volume (Kilotons) Forecast By Market Taxonomy, 2025 to 2035
      • By Country
        • GCC Countries
        • Northern Africa
        • South Africa
        • Turkiye
        • Rest of MEA
      • By Form
      • By Ingredients
      • By Application
    • Market Attractiveness Analysis
      • By Country
      • By Form
      • By Ingredients
      • By Application
    • Key Takeaways
  17. Key Countries Market Analysis
    • USA
      • Pricing Analysis
      • Market Share Analysis, 2024
        • By Form
        • By Ingredients
        • By Application
    • Canada
      • Pricing Analysis
      • Market Share Analysis, 2024
        • By Form
        • By Ingredients
        • By Application
    • Brazil
      • Pricing Analysis
      • Market Share Analysis, 2024
        • By Form
        • By Ingredients
        • By Application
    • Mexico
      • Pricing Analysis
      • Market Share Analysis, 2024
        • By Form
        • By Ingredients
        • By Application
    • Argentina
      • Pricing Analysis
      • Market Share Analysis, 2024
        • By Form
        • By Ingredients
        • By Application
  18. Market Structure Analysis
    • Competition Dashboard
    • Competition Benchmarking
    • Market Share Analysis of Top Players
      • By Regional
      • By Form
      • By Ingredients
      • By Application
  19. Competition Analysis
    • Competition Deep Dive
      • BASF SE
        • Overview
        • Product Portfolio
        • Profitability by Market Segments (Product/Age /Sales Channel/Region)
        • Sales Footprint
        • Strategy Overview
          • Marketing Strategy
          • Product Strategy
          • Channel Strategy
      • Corbion NV
        • Overview
        • Product Portfolio
        • Profitability by Market Segments (Product/Age /Sales Channel/Region)
        • Sales Footprint
        • Strategy Overview
          • Marketing Strategy
          • Product Strategy
          • Channel Strategy
      • Tate & Lyle Plc.
        • Overview
        • Product Portfolio
        • Profitability by Market Segments (Product/Age /Sales Channel/Region)
        • Sales Footprint
        • Strategy Overview
          • Marketing Strategy
          • Product Strategy
          • Channel Strategy
      • Glanbia plc.
        • Overview
        • Product Portfolio
        • Profitability by Market Segments (Product/Age /Sales Channel/Region)
        • Sales Footprint
        • Strategy Overview
          • Marketing Strategy
          • Product Strategy
          • Channel Strategy
      • Ingredion Incorporated
        • Overview
        • Product Portfolio
        • Profitability by Market Segments (Product/Age /Sales Channel/Region)
        • Sales Footprint
        • Strategy Overview
          • Marketing Strategy
          • Product Strategy
          • Channel Strategy
      • MGP Ingredients
        • Overview
        • Product Portfolio
        • Profitability by Market Segments (Product/Age /Sales Channel/Region)
        • Sales Footprint
        • Strategy Overview
          • Marketing Strategy
          • Product Strategy
          • Channel Strategy
      • Enter-G Foods, Inc.
        • Overview
        • Product Portfolio
        • Profitability by Market Segments (Product/Age /Sales Channel/Region)
        • Sales Footprint
        • Strategy Overview
          • Marketing Strategy
          • Product Strategy
          • Channel Strategy
      • Dupont De Nemours and Company
        • Overview
        • Product Portfolio
        • Profitability by Market Segments (Product/Age /Sales Channel/Region)
        • Sales Footprint
        • Strategy Overview
          • Marketing Strategy
          • Product Strategy
          • Channel Strategy
      • Fiberstar
        • Overview
        • Product Portfolio
        • Profitability by Market Segments (Product/Age /Sales Channel/Region)
        • Sales Footprint
        • Strategy Overview
          • Marketing Strategy
          • Product Strategy
          • Channel Strategy
      • Puratos
        • Overview
        • Product Portfolio
        • Profitability by Market Segments (Product/Age /Sales Channel/Region)
        • Sales Footprint
        • Strategy Overview
          • Marketing Strategy
          • Product Strategy
          • Channel Strategy
      • Danone Nutricia
        • Overview
        • Product Portfolio
        • Profitability by Market Segments (Product/Age /Sales Channel/Region)
        • Sales Footprint
        • Strategy Overview
          • Marketing Strategy
          • Product Strategy
          • Channel Strategy
  20. Assumptions & Acronyms Used
  21. Research Methodology

List of Tables

  • Table 1: Global Market Value (USD Billion) Forecast by Region, 2020-2035
  • Table 2: Global Market Volume (Kilotons) Forecast by Region, 2020-2035
  • Table 3: Global Market Value (USD Billion) Forecast by Form, 2020-2035
  • Table 4: Global Market Volume (Kilotons) Forecast by Form, 2020-2035
  • Table 5: Global Market Value (USD Billion) Forecast by Ingredients, 2020-2035
  • Table 6: Global Market Volume (Kilotons) Forecast by Ingredients, 2020-2035
  • Table 7: Global Market Value (USD Billion) Forecast by Application, 2020-2035
  • Table 8: Global Market Volume (Kilotons) Forecast by Application, 2020-2035
  • Table 9: North America Market Value (USD Billion) Forecast by Country, 2020-2035
  • Table 10: North America Market Volume (Kilotons) Forecast by Country, 2020-2035
  • Table 11: North America Market Value (USD Billion) Forecast by Form, 2020-2035
  • Table 12: North America Market Volume (Kilotons) Forecast by Form, 2020-2035
  • Table 13: North America Market Value (USD Billion) Forecast by Ingredients, 2020-2035
  • Table 14: North America Market Volume (Kilotons) Forecast by Ingredients, 2020-2035
  • Table 15: North America Market Value (USD Billion) Forecast by Application, 2020-2035
  • Table 16: North America Market Volume (Kilotons) Forecast by Application, 2020-2035
  • Table 17: Latin America Market Value (USD Billion) Forecast by Country, 2020-2035
  • Table 18: Latin America Market Volume (Kilotons) Forecast by Country, 2020-2035
  • Table 19: Latin America Market Value (USD Billion) Forecast by Form, 2020-2035
  • Table 20: Latin America Market Volume (Kilotons) Forecast by Form, 2020-2035
  • Table 21: Latin America Market Value (USD Billion) Forecast by Ingredients, 2020-2035
  • Table 22: Latin America Market Volume (Kilotons) Forecast by Ingredients, 2020-2035
  • Table 23: Latin America Market Value (USD Billion) Forecast by Application, 2020-2035
  • Table 24: Latin America Market Volume (Kilotons) Forecast by Application, 2020-2035
  • Table 25: Western Europe Market Value (USD Billion) Forecast by Country, 2020-2035
  • Table 26: Western Europe Market Volume (Kilotons) Forecast by Country, 2020-2035
  • Table 27: Western Europe Market Value (USD Billion) Forecast by Form, 2020-2035
  • Table 28: Western Europe Market Volume (Kilotons) Forecast by Form, 2020-2035
  • Table 29: Western Europe Market Value (USD Billion) Forecast by Ingredients, 2020-2035
  • Table 30: Western Europe Market Volume (Kilotons) Forecast by Ingredients, 2020-2035
  • Table 31: Western Europe Market Value (USD Billion) Forecast by Application, 2020-2035
  • Table 32: Western Europe Market Volume (Kilotons) Forecast by Application, 2020-2035
  • Table 33: Eastern Europe Market Value (USD Billion) Forecast by Country, 2020-2035
  • Table 34: Eastern Europe Market Volume (Kilotons) Forecast by Country, 2020-2035
  • Table 35: Eastern Europe Market Value (USD Billion) Forecast by Form, 2020-2035
  • Table 36: Eastern Europe Market Volume (Kilotons) Forecast by Form, 2020-2035
  • Table 37: Eastern Europe Market Value (USD Billion) Forecast by Ingredients, 2020-2035
  • Table 38: Eastern Europe Market Volume (Kilotons) Forecast by Ingredients, 2020-2035
  • Table 39: Eastern Europe Market Value (USD Billion) Forecast by Application, 2020-2035
  • Table 40: Eastern Europe Market Volume (Kilotons) Forecast by Application, 2020-2035
  • Table 41: East Asia Market Value (USD Billion) Forecast by Country, 2020-2035
  • Table 42: East Asia Market Volume (Kilotons) Forecast by Country, 2020-2035
  • Table 43: East Asia Market Value (USD Billion) Forecast by Form, 2020-2035
  • Table 44: East Asia Market Volume (Kilotons) Forecast by Form, 2020-2035
  • Table 45: East Asia Market Value (USD Billion) Forecast by Ingredients, 2020-2035
  • Table 46: East Asia Market Volume (Kilotons) Forecast by Ingredients, 2020-2035
  • Table 47: East Asia Market Value (USD Billion) Forecast by Application, 2020-2035
  • Table 48: East Asia Market Volume (Kilotons) Forecast by Application, 2020-2035
  • Table 49: South Asia & Pacific Market Value (USD Billion) Forecast by Country, 2020-2035
  • Table 50: South Asia & Pacific Market Volume (Kilotons) Forecast by Country, 2020-2035
  • Table 51: South Asia & Pacific Market Value (USD Billion) Forecast by Form, 2020-2035
  • Table 52: South Asia & Pacific Market Volume (Kilotons) Forecast by Form, 2020-2035
  • Table 53: South Asia & Pacific Market Value (USD Billion) Forecast by Ingredients, 2020-2035
  • Table 54: South Asia & Pacific Market Volume (Kilotons) Forecast by Ingredients, 2020-2035
  • Table 55: South Asia & Pacific Market Value (USD Billion) Forecast by Application, 2020-2035
  • Table 56: South Asia & Pacific Market Volume (Kilotons) Forecast by Application, 2020-2035
  • Table 57: Middle East and Africa Market Value (USD Billion) Forecast by Country, 2020-2035
  • Table 58: Middle East and Africa Market Volume (Kilotons) Forecast by Country, 2020-2035
  • Table 59: Middle East and Africa Market Value (USD Billion) Forecast by Form, 2020-2035
  • Table 60: Middle East and Africa Market Volume (Kilotons) Forecast by Form, 2020-2035
  • Table 61: Middle East and Africa Market Value (USD Billion) Forecast by Ingredients, 2020-2035
  • Table 62: Middle East and Africa Market Volume (Kilotons) Forecast by Ingredients, 2020-2035
  • Table 63: Middle East and Africa Market Value (USD Billion) Forecast by Application, 2020-2035
  • Table 64: Middle East and Africa Market Volume (Kilotons) Forecast by Application, 2020-2035

List of Figures

  • Figure 1: Global Market Volume (Kilotons) Forecast 2020-2035
  • Figure 2: Global Market Pricing Analysis
  • Figure 3: Global Market Value (USD Billion) Forecast 2020-2035
  • Figure 4: Global Market Value Share and BPS Analysis by Form, 2025 and 2035
  • Figure 5: Global Market Y-o-Y Growth Comparison by Form, 2025-2035
  • Figure 6: Global Market Attractiveness Analysis by Form
  • Figure 7: Global Market Value Share and BPS Analysis by Ingredients, 2025 and 2035
  • Figure 8: Global Market Y-o-Y Growth Comparison by Ingredients, 2025-2035
  • Figure 9: Global Market Attractiveness Analysis by Ingredients
  • Figure 10: Global Market Value Share and BPS Analysis by Application, 2025 and 2035
  • Figure 11: Global Market Y-o-Y Growth Comparison by Application, 2025-2035
  • Figure 12: Global Market Attractiveness Analysis by Application
  • Figure 13: Global Market Value (USD Billion) Share and BPS Analysis by Region, 2025 and 2035
  • Figure 14: Global Market Y-o-Y Growth Comparison by Region, 2025-2035
  • Figure 15: Global Market Attractiveness Analysis by Region
  • Figure 16: North America Market Incremental $ Opportunity, 2025-2035
  • Figure 17: Latin America Market Incremental $ Opportunity, 2025-2035
  • Figure 18: Western Europe Market Incremental $ Opportunity, 2025-2035
  • Figure 19: Eastern Europe Market Incremental $ Opportunity, 2025-2035
  • Figure 20: East Asia Market Incremental $ Opportunity, 2025-2035
  • Figure 21: South Asia & Pacific Market Incremental $ Opportunity, 2025-2035
  • Figure 22: Middle East and Africa Market Incremental $ Opportunity, 2025-2035
  • Figure 23: North America Market Value Share and BPS Analysis by Country, 2025 and 2035
  • Figure 24: North America Market Value Share and BPS Analysis by Form, 2025 and 2035
  • Figure 25: North America Market Y-o-Y Growth Comparison by Form, 2025-2035
  • Figure 26: North America Market Attractiveness Analysis by Form
  • Figure 27: North America Market Value Share and BPS Analysis by Ingredients, 2025 and 2035
  • Figure 28: North America Market Y-o-Y Growth Comparison by Ingredients, 2025-2035
  • Figure 29: North America Market Attractiveness Analysis by Ingredients
  • Figure 30: North America Market Value Share and BPS Analysis by Application, 2025 and 2035
  • Figure 31: North America Market Y-o-Y Growth Comparison by Application, 2025-2035
  • Figure 32: North America Market Attractiveness Analysis by Application
  • Figure 33: Latin America Market Value Share and BPS Analysis by Country, 2025 and 2035
  • Figure 34: Latin America Market Value Share and BPS Analysis by Form, 2025 and 2035
  • Figure 35: Latin America Market Y-o-Y Growth Comparison by Form, 2025-2035
  • Figure 36: Latin America Market Attractiveness Analysis by Form
  • Figure 37: Latin America Market Value Share and BPS Analysis by Ingredients, 2025 and 2035
  • Figure 38: Latin America Market Y-o-Y Growth Comparison by Ingredients, 2025-2035
  • Figure 39: Latin America Market Attractiveness Analysis by Ingredients
  • Figure 40: Latin America Market Value Share and BPS Analysis by Application, 2025 and 2035
  • Figure 41: Latin America Market Y-o-Y Growth Comparison by Application, 2025-2035
  • Figure 42: Latin America Market Attractiveness Analysis by Application
  • Figure 43: Western Europe Market Value Share and BPS Analysis by Country, 2025 and 2035
  • Figure 44: Western Europe Market Value Share and BPS Analysis by Form, 2025 and 2035
  • Figure 45: Western Europe Market Y-o-Y Growth Comparison by Form, 2025-2035
  • Figure 46: Western Europe Market Attractiveness Analysis by Form
  • Figure 47: Western Europe Market Value Share and BPS Analysis by Ingredients, 2025 and 2035
  • Figure 48: Western Europe Market Y-o-Y Growth Comparison by Ingredients, 2025-2035
  • Figure 49: Western Europe Market Attractiveness Analysis by Ingredients
  • Figure 50: Western Europe Market Value Share and BPS Analysis by Application, 2025 and 2035
  • Figure 51: Western Europe Market Y-o-Y Growth Comparison by Application, 2025-2035
  • Figure 52: Western Europe Market Attractiveness Analysis by Application
  • Figure 53: Eastern Europe Market Value Share and BPS Analysis by Country, 2025 and 2035
  • Figure 54: Eastern Europe Market Value Share and BPS Analysis by Form, 2025 and 2035
  • Figure 55: Eastern Europe Market Y-o-Y Growth Comparison by Form, 2025-2035
  • Figure 56: Eastern Europe Market Attractiveness Analysis by Form
  • Figure 57: Eastern Europe Market Value Share and BPS Analysis by Ingredients, 2025 and 2035
  • Figure 58: Eastern Europe Market Y-o-Y Growth Comparison by Ingredients, 2025-2035
  • Figure 59: Eastern Europe Market Attractiveness Analysis by Ingredients
  • Figure 60: Eastern Europe Market Value Share and BPS Analysis by Application, 2025 and 2035
  • Figure 61: Eastern Europe Market Y-o-Y Growth Comparison by Application, 2025-2035
  • Figure 62: Eastern Europe Market Attractiveness Analysis by Application
  • Figure 63: East Asia Market Value Share and BPS Analysis by Country, 2025 and 2035
  • Figure 64: East Asia Market Value Share and BPS Analysis by Form, 2025 and 2035
  • Figure 65: East Asia Market Y-o-Y Growth Comparison by Form, 2025-2035
  • Figure 66: East Asia Market Attractiveness Analysis by Form
  • Figure 67: East Asia Market Value Share and BPS Analysis by Ingredients, 2025 and 2035
  • Figure 68: East Asia Market Y-o-Y Growth Comparison by Ingredients, 2025-2035
  • Figure 69: East Asia Market Attractiveness Analysis by Ingredients
  • Figure 70: East Asia Market Value Share and BPS Analysis by Application, 2025 and 2035
  • Figure 71: East Asia Market Y-o-Y Growth Comparison by Application, 2025-2035
  • Figure 72: East Asia Market Attractiveness Analysis by Application
  • Figure 73: South Asia & Pacific Market Value Share and BPS Analysis by Country, 2025 and 2035
  • Figure 74: South Asia & Pacific Market Value Share and BPS Analysis by Form, 2025 and 2035
  • Figure 75: South Asia & Pacific Market Y-o-Y Growth Comparison by Form, 2025-2035
  • Figure 76: South Asia & Pacific Market Attractiveness Analysis by Form
  • Figure 77: South Asia & Pacific Market Value Share and BPS Analysis by Ingredients, 2025 and 2035
  • Figure 78: South Asia & Pacific Market Y-o-Y Growth Comparison by Ingredients, 2025-2035
  • Figure 79: South Asia & Pacific Market Attractiveness Analysis by Ingredients
  • Figure 80: South Asia & Pacific Market Value Share and BPS Analysis by Application, 2025 and 2035
  • Figure 81: South Asia & Pacific Market Y-o-Y Growth Comparison by Application, 2025-2035
  • Figure 82: South Asia & Pacific Market Attractiveness Analysis by Application
  • Figure 83: Middle East and Africa Market Value Share and BPS Analysis by Country, 2025 and 2035
  • Figure 84: Middle East and Africa Market Value Share and BPS Analysis by Form, 2025 and 2035
  • Figure 85: Middle East and Africa Market Y-o-Y Growth Comparison by Form, 2025-2035
  • Figure 86: Middle East and Africa Market Attractiveness Analysis by Form
  • Figure 87: Middle East and Africa Market Value Share and BPS Analysis by Ingredients, 2025 and 2035
  • Figure 88: Middle East and Africa Market Y-o-Y Growth Comparison by Ingredients, 2025-2035
  • Figure 89: Middle East and Africa Market Attractiveness Analysis by Ingredients
  • Figure 90: Middle East and Africa Market Value Share and BPS Analysis by Application, 2025 and 2035
  • Figure 91: Middle East and Africa Market Y-o-Y Growth Comparison by Application, 2025-2035
  • Figure 92: Middle East and Africa Market Attractiveness Analysis by Application
  • Figure 93: Global Market - Tier Structure Analysis
  • Figure 94: Global Market - Company Share Analysis

Frequently Asked Questions

What is the projected size of the egg replacer market in 2025?

The egg replacer market is valued at USD 1.4 billion in 2025.

What is the forecast for the egg replacer market size by 2035?

The market is expected to reach USD 2.6 billion by 2035, with a CAGR of 6.0%.

Which form of egg replacer will dominate the market in 2025?

Dry egg replacers are anticipated to lead the market with a 67.5% share in 2025.

What is the expected share of dairy proteins in the egg replacer ingredient segment by 2025?

Dairy proteins are expected to hold a 32.4% share in 2025.

Which country is forecast to have the fastest-growing egg replacer market?

Japan is projected to be the fastest-growing market with a CAGR of 7.1% from 2025 to 2035.

Explore Similar Insights

Future Market Insights

Egg Replacer Market