Egg and Egg Products Market Size, Share, and Forecast Outlook 2025 to 2035

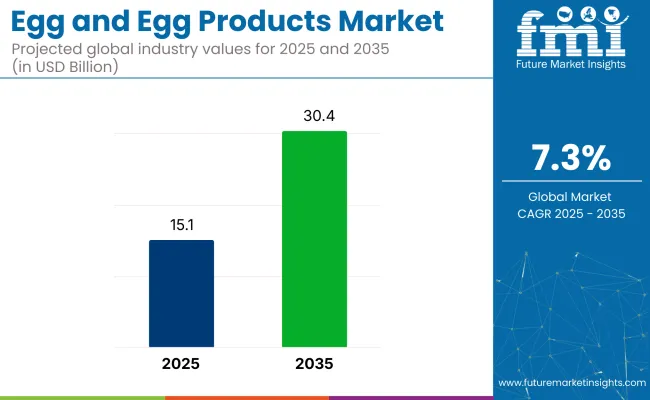
The global egg and egg products market is anticipated to reach a market value of USD 15.1 billion in 2025, with expectations to expand further to USD 30.4 billion by 2035. This growth trajectory indicates a CAGR of 7.3% from 2025 to 2035.
Quick Stats of Egg and Egg Products Market

  • Market Value (2025): USD 15.1 billion
  • Forecast Value (2035): USD 30.4 billion
  • Forecast CAGR (2025 to 2035): 7.3%
  • Leading Segment in 2025: Conventional Egg (65% share)
  • Key Growth Region: Asia Pacific (India is the fastest growing market with 9.2% CAGR)
  • Key Players: Centrum Valley Farms, Opal Foods LLC, Kreider Farms, Wabash Valley Produce, Inc., Center Fresh Group, Cal-Maine Foods Inc., Rose Acre Farms Inc., Michael Foods Inc., Hillandale Farms, Trillium Farm Holdings L.L.C.

Egg And Egg Products Market

Metric Value
Industry Size (2025E) USD 15.1 billion
Industry Value (2035F) USD 30.4 billion
CAGR (2025 to 2035) 7.3%

The egg and egg products market reached an inflection point between 2020 and 2024, shaped by supply reconfiguration and rapid adoption of processed formats across industrial applications. Between 2020 and 2024, global demand was buoyed by the pandemic-driven acceleration of shelf-stable and value-added protein ingredients.

Shelf-ready products such as pasteurized liquid eggs and powdered albumin gained commercial momentum, especially in North America and parts of East Asia, where baking, confectionery, and institutional catering underwent cost and labor rationalization.

USA egg exports rose from 231 million dozen in 2020 to 293 million dozen in 2023, with Japan, South Korea, and Mexico leading import growth. In Europe, the egg-processing sector saw a 19% rise in demand for powdered yolk in bakery and ready-meal categories over this same period, aided by long ambient shelf life and streamlined HACCP compliance.

By contrast, the 2025 to 2035 phase is shaped more by efficiency, vertical integration, and differentiated nutrition. Automation and robotics adoption in grading, packing, and pasteurization has reduced production cost per dozen by 12- 14% in the USA and EU since 2021, improving the feasibility of diversified SKUs for institutional buyers.

Growth from 2025 onward is less reactive and more structurally optimized: centralized processing, renewable energy-driven hatcheries, and precision-fed layer hens are becoming dominant themes. These shifts mark the movement from pandemic-induced substitution to strategic protein integration- where shelf life, consistency, and functionality are prioritized across ready-to-eat, sports nutrition, and medical nutrition categories.

The industry accounts for a smaller share compared to parent markets such as the global pulses, legumes, and plant-based protein markets. In the broader agricultural and protein sectors, eggs represent a niche segment. The egg market, while substantial, accounts for only about 2-3% of the total global protein market.

In comparison, pulses and legumes, with their diverse applications and higher global consumption, dominate with a share of approximately 10-12%. Within the plant-based protein market, eggs, particularly in the form of substitutes or processed products, make up around 4-5%, still a significant but smaller portion. In relation to the organic food and African agricultural markets, eggs capture a modest share, influenced by regional consumer trends towards health.

Analysis of Egg and Egg Products Market by Top Investment Segments

The market is primarily driven by the dominance of whole eggs, brown eggs, and medium-sized eggs, each holding substantial shares due to their versatility, affordability, and consumer preferences for health. The food and beverage industry remains the largest end-user, with liquid eggs leading in form due to their convenience in large-scale food production.

Conventional eggs dominate the market, while indirect sales channels continue to hold the majority share, ensuring widespread accessibility and distribution across both retail and foodservice sectors.

By Product Type, Whole Egg Segment Accounts for Over 50% Share

The whole egg segment is expected to dominate the market, holding the largest share. This segment is projected to capture 50% of the total market in 2025.
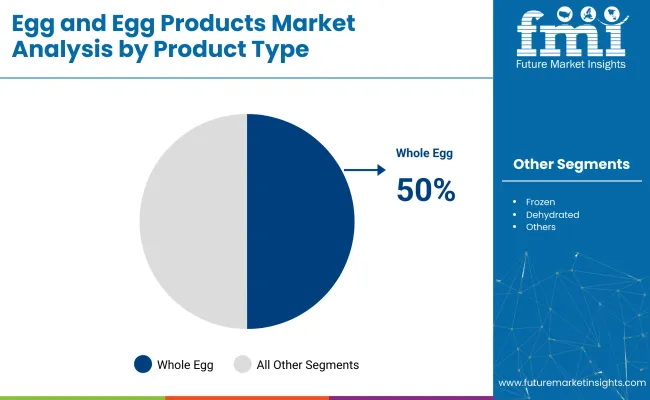
  • The widespread consumption of whole eggs in both household and commercial settings drives its leading position.
  • Whole eggs are versatile and used in various forms, cooking, baking, food processing, and nutritional applications, making them an essential staple in diets worldwide.
  • The strong market share is further supported by the increasing demand for protein-rich foods, as eggs are an affordable, high-quality protein source. Their familiarity and affordability make them a preferred choice for both consumers and foodservice providers.

Egg And Egg Products Market Analysis By Product Type

Brown Eggs Lead Product Demand with 58.3% Share

Brown eggs are projected to account for nearly 58.3% industry share by 2025, primarily due to their perceived health benefits.

  • Consumers often associate brown eggs with being more natural, organic, or nutrient-rich, even though there is little nutritional difference compared to white eggs. This perception, combined with rising interest in ethical farming practices, drives demand for brown eggs, especially in health-conscious markets in North America and Europe.
  • Brown eggs are also frequently marketed as coming from free-range or cage-free hens, which align with growing consumer concerns about animal welfare and sustainable farming.
  • Trends continue to gain momentum brown eggs are expected to maintain their dominant market share.

By Size, Medium Segment Account for Over 36.4% Market Share

Medium size are projected to account for over 36.4% of the share in 2025, making them the largest size category. The medium size egg segment is leading due to its versatility and suitability for a wide range of culinary applications.

  • Medium eggs are favored for their optimal balance between price and functionality, making them ideal for both home cooks and commercial foodservice providers. They are commonly used in baking, cooking, and food processing, where a standard size is preferred for consistency and portion control.
  • Medium-sized eggs cater well to smaller households or specific dietary needs, offering consumers the flexibility to manage egg consumption more precisely.
  • Growing popularity, especially in retail markets, is fueled by increasing demand for convenience, cost-efficiency, and balanced nutritional portions.

Food and Beverage to be the Major End Users with 45% Share

The food and beverage segment is expected to dominate the market in 2025, capturing the largest share. This segment is projected to hold around 45% of the total market due to the widespread use of eggs in various food applications, particularly in processed foods, ready-to-eat meals, and beverages.

  • Eggs are a versatile ingredient in both the baking and confectionery industries, where they play a crucial role in texture, taste, and nutritional content.
  • Eggs are commonly used in dressings, sauces, and pasta production, driving their demand across the global food industry.
  • The growing adoption of egg alternatives in some areas does not significantly reduce the strong presence of eggs in traditional food categories, making this the most dominant end-use category.

Liquid Egg Is Expected to Lead Form with 55% Share in 2025

The liquid egg segment is expected to lead the market in 2025, capturing the largest share of 55% in 2025. This dominance is driven by the growing demand for convenience in food preparation, particularly in commercial kitchens, food processing, and the bakery industry.

  • Liquid eggs offer significant advantages in terms of time and labor savings, as they eliminate the need for cracking, separating, and measuring eggs individually.
  • They are widely used in large-scale food production, such as ready-to-eat meals, dressings, sauces, and baked goods, where consistency and efficiency are key.
  • The liquid form’s extended shelf life and easy handling make it ideal for both industrial applications and retail, further cementing its position as the leading form in the egg products market.

Conventional Egg is Projected to Lead Source with a 75% Market Share

The conventional egg segment is expected to lead the market in 2025, capturing the largest share of 75% in 2025. This dominance is due to conventional eggs being more widely available and cost-effective compared to organic eggs.
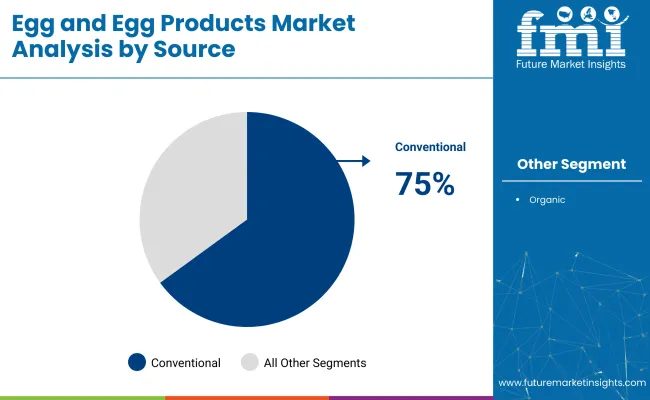
  • Conventional eggs are produced in large quantities, meeting the global demand at a lower price point, making them the preferred choice for most consumers, particularly in emerging markets where price sensitivity is higher.
  • While organic eggs are gaining traction due to growing health-consciousness and ethical concerns, conventional eggs still dominate due to their affordability, accessibility, and established presence in both the retail and foodservice sectors.

Egg And Egg Products Market Analysis By Source

By Sales Channel, Indirect Sales Segment Accounts for Over 60% Share

The indirect sales segment is expected to lead the market in 2025, holding a significant share of around 60%. This dominance is primarily driven by the extensive distribution network that reaches a broad consumer base through intermediaries like wholesalers, distributors, and retailers.

  • Eggs are commonly sold through indirect channels such as grocery stores, supermarkets, and modern trade formats, which cater to both individual consumers and large-scale food service providers.
  • The widespread accessibility and convenience of purchasing eggs through these channels make them the preferred choice for most consumers.
  • Indirect sales ensure that eggs are available in a variety of locations, from rural areas to urban centers, further expanding their reach compared to direct sales.

Top Egg and Egg Products Market Dynamics

Egg and egg product demand is accelerating due to supply-side recalibration and downstream functional diversification. Demand drivers extend beyond fitness trends and into contract manufacturing, foodservice digitization, and ingredient precision.

Shelf-Stable Proteins Restructuring Institutional Menus

Across hospital catering, QSR chains, and export-ready baked goods, egg derivatives such as albumin powder and pasteurized yolk are replacing fresh eggs due to their thermal stability, pathogen control, and transport efficiency. Liquid eggs now account for over 24% of institutional procurement in North America, while UHT-treated formats in Japan have reduced last-mile cold chain dependency by 17% in school meal programs. High-protein ready meals incorporating pasteurized egg blends have expanded in Southeast Asia, where workforce-led urban expansion drives meal-prep simplification.

  • Egg derivatives meeting HACCP-compliant shelf-life benchmarks.
  • Cost-per-serving reduced by up to 21% in processed formats.
  • Procurement cycles shortened by 3.6 days in B2B channels.

Hybrid Sourcing Models Redefining Convenience Economics

Manufacturers are now favoring hybrid sourcing: centralized procurement of cage-free whole eggs paired with regional spray-drying operations to localize powdered supply. These models are helping brands balance ethical sourcing claims with operational resilience.

In France and South Korea, private-label producers increased their egg protein use in breakfast kits and bakery mixes by 14% and 18% YoY, respectively, enabled by localized drying and blending hubs. The rise in plant-animal hybrid meal kits is also prompting reclassification of egg inputs under functional protein indexes rather than commodity SKUs.
  • Region-specific drying plants enhancing input traceability.
  • Localized blends increasing SKU agility in urban retail formats.
  • Hybrid sourcing allowing greater shelf-time predictability across QSRs.

Analysis of Top Countries Manufacturing, Exporting and Supplying Egg and Egg Products Globally

Egg And Egg Products Market Country Wise Analysis

Country CAGR (2025 to 2035)
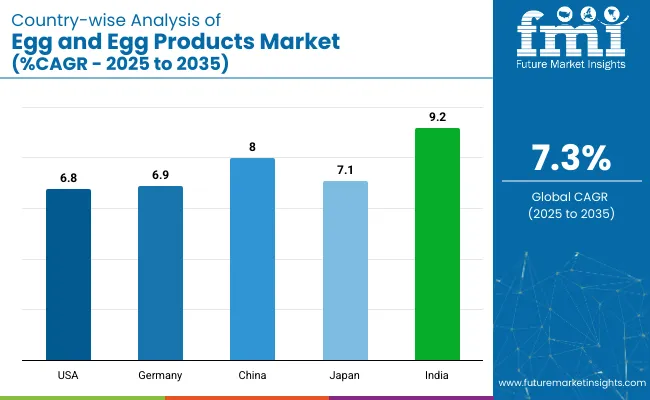
United States 6.8%
Germany 6.9%
Japan 7.1%
China 8.0%
India 9.2%

The global egg and egg products market is projected to grow at a CAGR of 7.3% from 2025 to 2035. Among the five profiled countries, India leads with a CAGR of 9.2%, followed by China at 8.0%, and Japan at 7.1%, while Germany posts 6.9%, and the United States records 6.8%. These rates result in a growth premium of +34% for India, +17% for China, and +10% for Japan compared to the baseline, whereas Germany and the United States trail by -1% each.

Divergence reflects country-specific drivers: India’s rising demand for affordable protein amid population growth, China’s expanding foodservice sector, Japan’s blend of traditional and premium egg consumption trends, Germany’s preference for organic and free-range eggs, and the USA’s focus on health-conscious consumers and convenience-driven egg products.

Analysis of Sales of Egg and Egg Products Systems in the USA

The egg and egg products market in the United States is estimated to grow at a CAGR of 6.8% during the forecast period. This growth is driven by the increasing consumer demand for affordable, high-protein food options and the rise of health-conscious diets. Eggs are widely recognized for their nutritional benefits, offering a cost-effective source of protein, vitamins, and minerals, which has contributed to their increased consumption across various demographics.

The popularity of ready-to-eat meals, meal kits, and processed foods, where eggs are used as a key ingredient, is fueling the market. As the USA continues to focus on convenience, liquid eggs and pre-cooked egg products are seeing higher adoption in both households and the foodservice industry. The growing trend of plant-based diets has encouraged in egg alternatives, with some consumers increasingly seeking sustainable and ethical farming practices for egg production, further driving demand.

  • Growing consumer focus on protein-rich and affordable food options
  • Increased adoption of convenient, ready-to-eat egg products
  • Rising popularity of sustainable and ethical egg production practices

Detailed Outlook on the Future of Egg and Egg Products Market in Germany

The egg and egg products market in Germany is expected to grow at a CAGR of 6.9% from 2025 to 2035. Germany’s growing demand for eggs is influenced by the country’s strong focus on health, and organic products. Consumers are increasingly shifting towards organic and free-range eggs, viewing them as healthier and more environmentally friendly options. The increasing popularity of vegan and plant-based diets has sparked a rising interest in egg alternatives, but eggs remain a staple in German cuisine, used in a variety of foods, including baked goods, pastries, and sauces.

The growing demand for convenience in cooking and food preparation also supports the growth of liquid and pre-cooked egg products, particularly among busy urban consumers. As German consumers place a premium on food traceability and ethical production, eggs produced under strict welfare and standards are expected to see continued demand growth.

  • Strong consumer preference for organic, free-range, and ethical egg products
  • Demand for convenience-driven egg products, including liquid eggs
  • Rising interest in vegan diets alongside continued consumption of eggs

In-depth Analysis of China Egg and Egg Products Market

The egg and egg products market in China is projected to grow at a CAGR of 8.0% between 2025 and 2035. China is one of the largest producers and consumers of eggs in the world, and this market is expanding due to increasing a middle class with rising disposable income. As Chinese consumers shift toward more balanced and health-conscious diets, eggs, known for their high protein content and nutritional value, are becoming a staple food item.

The demand for processed egg products, including liquid and powdered eggs, is growing due to the expanding foodservice and bakery sectors. The Chinese government’s focus on food safety and quality control is further driving demand for more standardized and traceable egg products. The shift towards more convenient, ready-to-eat, and high-quality egg options is transforming consumer preferences, supporting continued market growth.

  • Strong egg consumption driven by a growing middle class
  • Rising demand for processed egg products in foodservice and baking sectors
  • Increasing focus on food safety, quality control, and traceability

Growth Analysis and Forecast for Japan Egg and Egg Products Market

Sales of egg and egg products in Japan is anticipated to grow at a CAGR of 7.1% during the forecast period. Japan’s egg consumption is increasing due to its integral role in the country’s traditional diet, including dishes like tamago (egg omelet) and tamagoyaki (Japanese rolled omelet). The rising health awareness among Japanese consumers is driving demand for eggs, as they are considered an excellent source of protein and essential nutrients.

Japan also has a strong preference for premium and ethically produced eggs, including organic and cage-free varieties, as consumers become more conscious about animal welfare and environmental. Japan's growing food processing and convenience food industries are fueling demand for egg-based ingredients, such as liquid eggs and egg powder, due to their ease of use in mass production and longer shelf life. The market is also supported by Japan’s aging population, where eggs are seen as a convenient and nutritious food choice.

  • Traditional and high consumption of eggs in Japanese cuisine
  • Rising health-consciousness and demand for premium, ethical egg products
  • Growth of food processing and convenience food sectors driving egg product demand

Demand Forecast Analysis for Egg and Egg Products Market in India

Demand for egg and egg products in India is valued at a CAGR of 9.2% during the forecast period. India is experiencing rapid growth in egg consumption due to the rising population, and increased awareness of the nutritional benefits of eggs, especially for protein. Eggs are a vital part of the Indian diet, providing a cost-effective and easily accessible protein source, particularly in rural areas.

The growing popularity of convenience foods, such as ready-to-eat meals and meal kits, is also driving demand for processed egg products like liquid and powdered eggs. As India’s middle class expands, there is increasing demand for higher-quality, premium egg products, including organic and cage-free options. This shift toward more sustainable and ethical egg production practices is in line with global trends, with consumers becoming more concerned about food origins and the ethical treatment of animals.

  • Increasing demand for protein-rich eggs due to population growth
  • Rising popularity of convenience foods and processed egg products
  • Growing interest in premium, sustainable egg options driven by middle-class expansion

Leading Egg and Egg Products Suppliers

The egg and egg products market is moderately consolidated, with leading players such as Centrum Valley Farms, Opal Foods LLC, Kreider Farms, Wabash Valley Produce, Inc., Center Fresh Group, Cal-Maine Foods Inc., Rose Acre Farms Inc., Michael Foods Inc., Hillandale Farms, Trillium Farm Holdings L.LC., Rembrandt Enterprises, Hickman’s Egg Ranch, Midwest Poultry Services L.P., Sparboe Farms, Herbruck’s Poultry Ranch, Weaver Brothers, Daybreak Foods Inc., The Compass Group, and ISE America Inc. These companies dominate the market by offering a variety of egg products, including fresh, liquid, and processed eggs, as well as specialty egg-based offerings tailored to various industries such as food service, retail, and animal feed.

For example, Cal-Maine Foods Inc. is the largest producer of eggs in the USA, focusing on both shell eggs and processed egg products. Rose Acre Farms Inc. is known for its wide range of egg products and sustainable farming practices, while Michael Foods Inc. offers processed egg products that cater to both retail and food service sectors. Sparboe Farms specializes in providing cage-free and organic eggs, which aligns with the growing demand for ethically produced and sustainable food products.

Leading Players

  • Centrum Valley Farms
  • Opal Foods LLC
  • Kreider Farms
  • Wabash Valley Produce, Inc.
  • Center Fresh Group
  • Cal-Maine Foods Inc.
  • Rose Acre Farms Inc.
  • Michael Foods Inc.
  • Hillandale Farms
  • Trillium Farm Holdings L.LC.
  • Rembrandt Enterprises
  • Hickman's Egg Ranch
  • Midwest Poultry Services L.P.
  • Sparboe Farms
  • Herbruck's Poultry Ranch
  • Weaver Brothers
  • Daybreak Foods Inc.
  • The Compass Group
  • ISE America Inc.
  • Michael Foods Group, Inc.

Report Coverage and Scope Summary

Report Attributes Details
Market Size (2025) USD 15.1 billion
Projected Market Size (2035) USD 30.4 billion
CAGR (2025 to 2035) 7.3%
Base Year for Estimation 2024
Historical Period 2020 to 2024
Projections Period 2025 to 2035
Quantitative Units USD billion for value
Product Type Analyzed (Segment 1) Whole Egg, Frozen, Chilled, Pre-Cooked, Dehydrated, and Specialty Products.
Color Analyzed (Segment 2) Brown and White.
Size Analyzed (Segment 3) Small, Medium, Large, and Jumbo Size.
End Use Analyzed (Segment 4) Food And Beverage (Bakery, Confectionary, Dressings, Pasta & Noodles, Fish & Meat Products, And Others), Animal Feed, Pharmaceutical, Cosmetics & Personal Care, Household, And HORECA.
Form Analyzed (Segment 5) Liquid, Crystal, And Powder.
Source Analyzed (Segment 6) Organic And Conventional.
Sales Channel Analyzed (Segment 7) Direct Sales And Indirect Sales (Modern Trade Formats, Convenience Store, Online Retail, Grocery Stores, And Other Retail Formats)
Regions Covered North America, Europe, Asia Pacific, Middle East & Africa, Latin America
Countries Covered United States, Canada, Germany, United Kingdom, France, Italy, Spain, China, Japan, South Korea, India, Australia, Brazil, Mexico, Argentina, Saudi Arabia, UAE, South Africa
Key Players Centrum Valley Farms, Opal Foods LLC, Kreider Farms, Wabash Valley Produce, Inc., Center Fresh Group, Cal-Maine Foods Inc., Rose Acre Farms Inc., Michael Foods Inc., Hillandale Farms, Trillium Farm Holdings L.L.C., Rembrandt Enterprises, Hickman's Egg Ranch, Midwest Poultry Services L.P., Sparboe Farms, Herbruck's Poultry Ranch, Weaver Brothers, Daybreak Foods Inc., The Compass Group, ISE America Inc.
Additional Attributes Dollar sales, market share, growth rate (CAGR), consumer preferences, trends in product types (whole, liquid, specialty), regional demand, competitive landscape, and pricing strategies.

Key Segmentation

By Product Type:

The industry is segmented into whole egg, frozen, chilled, pre-cooked, dehydrated, and specialty products.

By Color:

The key colors are brown and white.

By Size:

The industry finds small, medium, large, and jumbo size.

By End Use

The industry is segmented into food and beverage (bakery, confectionary, dressings, pasta & noodles, fish & meat products, and others), animal feed, pharmaceutical, cosmetics & personal care, household, and HORECA.

By Form:

The industry is segmented into liquid, crystal, and powder.

By Source:

The industry covers organic and conventional.

By Sales Channel:

The industry is divided into direct sales and indirect sales (modern trade formats, convenience store, online retail, grocery stores, and other retail formats).

By Region:

The industry covers regions including North America, Europe, Asia Pacific, Latin America, and the Middle East & Africa.

Table of Content

  1. Executive Summary
    • Global Market Outlook
    • Demand-side Trends
    • Supply-side Trends
    • Technology Roadmap Analysis
    • Analysis and Recommendations
  2. Market Overview
    • Market Coverage / Taxonomy
    • Market Definition / Scope / Limitations
  3. Market Background
    • Market Dynamics
      • Drivers
      • Restraints
      • Opportunity
      • Trends
    • Scenario Forecast
      • Demand in Optimistic Scenario
      • Demand in Likely Scenario
      • Demand in Conservative Scenario
    • Opportunity Map Analysis
    • Product Life Cycle Analysis
    • Supply Chain Analysis
      • Supply Side Participants and their Roles
        • Producers
        • Mid-Level Participants (Traders/ Agents/ Brokers)
        • Wholesalers and Distributors
      • Value Added and Value Created at Node in the Supply Chain
      • List of Raw Material Suppliers
      • List of Existing and Potential Buyer’s
    • Investment Feasibility Matrix
    • Value Chain Analysis
      • Profit Margin Analysis
      • Wholesalers and Distributors
      • Retailers
    • PESTLE and Porter’s Analysis
    • Regulatory Landscape
      • By Key Regions
      • By Key Countries
    • Regional Parent Market Outlook
    • Production and Consumption Statistics
    • Import and Export Statistics
  4. Global Market Analysis 2020 to 2024 and Forecast, 2025 to 2035
    • Historical Market Size Value (USD Billion) Analysis, 2020 to 2024
    • Current and Future Market Size Value (USD Billion) Projections, 2025 to 2035
      • Y-o-Y Growth Trend Analysis
      • Absolute $ Opportunity Analysis
  5. Global Market Pricing Analysis 2020 to 2024 and Forecast 2025 to 2035
  6. Global Market Analysis 2020 to 2024 and Forecast 2025 to 2035, By Product Type
    • Introduction / Key Findings
    • Historical Market Size Value (USD Billion) Analysis By Product Type, 2020 to 2024
    • Current and Future Market Size Value (USD Billion) Analysis and Forecast By Product Type, 2025 to 2035
      • Whole Egg
      • Frozen
      • Chilled
      • Pre-cooked
      • Dehydrated
      • Specialty
    • Y-o-Y Growth Trend Analysis By Product Type, 2020 to 2024
    • Absolute $ Opportunity Analysis By Product Type, 2025 to 2035
  7. Global Market Analysis 2020 to 2024 and Forecast 2025 to 2035, By Color
    • Introduction / Key Findings
    • Historical Market Size Value (USD Billion) Analysis By Color, 2020 to 2024
    • Current and Future Market Size Value (USD Billion) Analysis and Forecast By Color, 2025 to 2035
      • Brown
      • White
    • Y-o-Y Growth Trend Analysis By Color, 2020 to 2024
    • Absolute $ Opportunity Analysis By Color, 2025 to 2035
  8. Global Market Analysis 2020 to 2024 and Forecast 2025 to 2035, By Size
    • Introduction / Key Findings
    • Historical Market Size Value (USD Billion) Analysis By Size, 2020 to 2024
    • Current and Future Market Size Value (USD Billion) Analysis and Forecast By Size, 2025 to 2035
      • Small
      • Medium
      • Large
      • Jumbo
    • Y-o-Y Growth Trend Analysis By Size, 2020 to 2024
    • Absolute $ Opportunity Analysis By Size, 2025 to 2035
  9. Global Market Analysis 2020 to 2024 and Forecast 2025 to 2035, By End-Use
    • Introduction / Key Findings
    • Historical Market Size Value (USD Billion) Analysis By End-Use, 2020 to 2024
    • Current and Future Market Size Value (USD Billion) Analysis and Forecast By End-Use, 2025 to 2035
      • Food and Beverage
        • Bakery
        • Confectionary
        • Dressings
        • Pasta & Noodles
        • Fish & Meat Products
        • Others
      • Animal Feed
      • Pharmaceutical
      • Cosmetics & Personal Care
      • Household
      • HORECA
    • Y-o-Y Growth Trend Analysis By End-Use, 2020 to 2024
    • Absolute $ Opportunity Analysis By End-Use, 2025 to 2035
  10. Global Market Analysis 2020 to 2024 and Forecast 2025 to 2035, By Form
    • Introduction / Key Findings
    • Historical Market Size Value (USD Billion) Analysis By Form, 2020 to 2024
    • Current and Future Market Size Value (USD Billion) Analysis and Forecast By Form, 2025 to 2035
      • Liquid
      • Crystal
      • Powder
    • Y-o-Y Growth Trend Analysis By Form, 2020 to 2024
    • Absolute $ Opportunity Analysis By Form, 2025 to 2035
  11. Global Market Analysis 2020 to 2024 and Forecast 2025 to 2035, By Source
    • Introduction / Key Findings
    • Historical Market Size Value (USD Billion) Analysis By Source, 2020 to 2024
    • Current and Future Market Size Value (USD Billion) Analysis and Forecast By Source, 2025 to 2035
      • Organic
      • Conventional
    • Y-o-Y Growth Trend Analysis By Source, 2020 to 2024
    • Absolute $ Opportunity Analysis By Source, 2025 to 2035
  12. Global Market Analysis 2020 to 2024 and Forecast 2025 to 2035, By Sales Channel
    • Introduction / Key Findings
    • Historical Market Size Value (USD Billion) Analysis By Sales Channel, 2020 to 2024
    • Current and Future Market Size Value (USD Billion) Analysis and Forecast By Sales Channel, 2025 to 2035
      • Direct Sales
      • Indirect Sales
        • Modern Trade Formats
        • Convenience Store
        • Online Retail
        • Grocery Stores
        • Other Retail Formats
    • Y-o-Y Growth Trend Analysis By Sales Channel, 2020 to 2024
    • Absolute $ Opportunity Analysis By Sales Channel, 2025 to 2035
  13. Global Market Analysis 2020 to 2024 and Forecast 2025 to 2035, By Region
    • Introduction
    • Historical Market Size Value (USD Billion) Analysis By Region, 2020 to 2024
    • Current Market Size Value (USD Billion) Analysis and Forecast By Region, 2025 to 2035
      • North America
      • Latin America
      • Western Europe
      • Eastern Europe
      • East Asia
      • South Asia & Pacific
      • Middle East and Africa
    • Market Attractiveness Analysis By Region
  14. North America Market Analysis 2020 to 2024 and Forecast 2025 to 2035, By Country
    • Historical Market Size Value (USD Billion) Trend Analysis By Market Taxonomy, 2020 to 2024
    • Market Size Value (USD Billion) Forecast By Market Taxonomy, 2025 to 2035
      • By Country
        • USA
        • Canada
        • Mexico
      • By Product Type
      • By Color
      • By Size
      • By End-Use
      • By Form
      • By Source
      • By Sales Channel
    • Market Attractiveness Analysis
      • By Country
      • By Product Type
      • By Color
      • By Size
      • By End-Use
      • By Form
      • By Source
      • By Sales Channel
    • Key Takeaways
  15. Latin America Market Analysis 2020 to 2024 and Forecast 2025 to 2035, By Country
    • Historical Market Size Value (USD Billion) Trend Analysis By Market Taxonomy, 2020 to 2024
    • Market Size Value (USD Billion) Forecast By Market Taxonomy, 2025 to 2035
      • By Country
        • Brazil
        • Argentina
        • Rest of LATAM
      • By Product Type
      • By Color
      • By Size
      • By End-Use
      • By Form
      • By Source
      • By Sales Channel
    • Market Attractiveness Analysis
      • By Country
      • By Product Type
      • By Color
      • By Size
      • By End-Use
      • By Form
      • By Source
      • By Sales Channel
    • Key Takeaways
  16. Western Europe Market Analysis 2020 to 2024 and Forecast 2025 to 2035, By Country
    • Historical Market Size Value (USD Billion) Trend Analysis By Market Taxonomy, 2020 to 2024
    • Market Size Value (USD Billion) Forecast By Market Taxonomy, 2025 to 2035
      • By Country
        • Germany
        • Italy
        • France
        • UK
        • Spain
        • BENELUX
        • Nordic
        • Rest of W.Europe
      • By Product Type
      • By Color
      • By Size
      • By End-Use
      • By Form
      • By Source
      • By Sales Channel
    • Market Attractiveness Analysis
      • By Country
      • By Product Type
      • By Color
      • By Size
      • By End-Use
      • By Form
      • By Source
      • By Sales Channel
    • Key Takeaways
  17. Eastern Europe Market Analysis 2020 to 2024 and Forecast 2025 to 2035, By Country
    • Historical Market Size Value (USD Billion) Trend Analysis By Market Taxonomy, 2020 to 2024
    • Market Size Value (USD Billion) Forecast By Market Taxonomy, 2025 to 2035
      • By Country
        • Russia
        • Hungary
        • Poland
        • Balkan & Baltics
        • Rest of E. Europe
      • By Product Type
      • By Color
      • By Size
      • By End-Use
      • By Form
      • By Source
      • By Sales Channel
    • Market Attractiveness Analysis
      • By Country
      • By Product Type
      • By Color
      • By Size
      • By End-Use
      • By Form
      • By Source
      • By Sales Channel
    • Key Takeaways
  18. East Asia Market Analysis 2020 to 2024 and Forecast 2025 to 2035, By Country
    • Historical Market Size Value (USD Billion) Trend Analysis By Market Taxonomy, 2020 to 2024
    • Market Size Value (USD Billion) Forecast By Market Taxonomy, 2025 to 2035
      • By Country
        • China
        • Japan
        • South Korea
      • By Product Type
      • By Color
      • By Size
      • By End-Use
      • By Form
      • By Source
      • By Sales Channel
    • Market Attractiveness Analysis
      • By Country
      • By Product Type
      • By Color
      • By Size
      • By End-Use
      • By Form
      • By Source
      • By Sales Channel
    • Key Takeaways
  19. South Asia & Pacific Market Analysis 2020 to 2024 and Forecast 2025 to 2035, By Country
    • Historical Market Size Value (USD Billion) Trend Analysis By Market Taxonomy, 2020 to 2024
    • Market Size Value (USD Billion) Forecast By Market Taxonomy, 2025 to 2035
      • By Country
        • India
        • Australia & New Zealand
        • ASEAN
        • Rest of SAP
      • By Product Type
      • By Color
      • By Size
      • By End-Use
      • By Form
      • By Source
      • By Sales Channel
    • Market Attractiveness Analysis
      • By Country
      • By Product Type
      • By Color
      • By Size
      • By End-Use
      • By Form
      • By Source
      • By Sales Channel
    • Key Takeaways
  20. Middle East and Africa Market Analysis 2020 to 2024 and Forecast 2025 to 2035, By Country
    • Historical Market Size Value (USD Billion) Trend Analysis By Market Taxonomy, 2020 to 2024
    • Market Size Value (USD Billion) Forecast By Market Taxonomy, 2025 to 2035
      • By Country
        • GCC Countries
        • Northern Africa
        • South Africa
        • Turkiye
        • Rest of MEA
      • By Product Type
      • By Color
      • By Size
      • By End-Use
      • By Form
      • By Source
      • By Sales Channel
    • Market Attractiveness Analysis
      • By Country
      • By Product Type
      • By Color
      • By Size
      • By End-Use
      • By Form
      • By Source
      • By Sales Channel
    • Key Takeaways
  21. Key Countries Market Analysis
    • USA
      • Pricing Analysis
      • Market Share Analysis, 2024
        • By Product Type
        • By Color
        • By Size
        • By End-Use
        • By Form
        • By Source
        • By Sales Channel
    • Canada
      • Pricing Analysis
      • Market Share Analysis, 2024
        • By Product Type
        • By Color
        • By Size
        • By End-Use
        • By Form
        • By Source
        • By Sales Channel
    • Brazil
      • Pricing Analysis
      • Market Share Analysis, 2024
        • By Product Type
        • By Color
        • By Size
        • By End-Use
        • By Form
        • By Source
        • By Sales Channel
    • Mexico
      • Pricing Analysis
      • Market Share Analysis, 2024
        • By Product Type
        • By Color
        • By Size
        • By End-Use
        • By Form
        • By Source
        • By Sales Channel
    • Argentina
      • Pricing Analysis
      • Market Share Analysis, 2024
        • By Product Type
        • By Color
        • By Size
        • By End-Use
        • By Form
        • By Source
        • By Sales Channel
  22. Market Structure Analysis
    • Competition Dashboard
    • Competition Benchmarking
    • Market Share Analysis of Top Players
      • By Regional
      • By Product Type
      • By Color
      • By Size
      • By End-Use
      • By Form
      • By Source
      • By Sales Channel
  23. Competition Analysis
    • Competition Deep Dive
      • Centrum Valley Farms
        • Overview
        • Product Portfolio
        • Profitability by Market Segments (Product/Age /Sales Channel/Region)
        • Sales Footprint
        • Strategy Overview
          • Marketing Strategy
          • Product Strategy
          • Channel Strategy
      • Opal Foods LLC
        • Overview
        • Product Portfolio
        • Profitability by Market Segments (Product/Age /Sales Channel/Region)
        • Sales Footprint
        • Strategy Overview
          • Marketing Strategy
          • Product Strategy
          • Channel Strategy
      • Kreider Farms
        • Overview
        • Product Portfolio
        • Profitability by Market Segments (Product/Age /Sales Channel/Region)
        • Sales Footprint
        • Strategy Overview
          • Marketing Strategy
          • Product Strategy
          • Channel Strategy
      • Wabash Valley Produce, Inc.
        • Overview
        • Product Portfolio
        • Profitability by Market Segments (Product/Age /Sales Channel/Region)
        • Sales Footprint
        • Strategy Overview
          • Marketing Strategy
          • Product Strategy
          • Channel Strategy
      • Center Fresh Group
        • Overview
        • Product Portfolio
        • Profitability by Market Segments (Product/Age /Sales Channel/Region)
        • Sales Footprint
        • Strategy Overview
          • Marketing Strategy
          • Product Strategy
          • Channel Strategy
      • Cal-Maine Foods Inc.
        • Overview
        • Product Portfolio
        • Profitability by Market Segments (Product/Age /Sales Channel/Region)
        • Sales Footprint
        • Strategy Overview
          • Marketing Strategy
          • Product Strategy
          • Channel Strategy
      • Rose Acre Farms Inc.
        • Overview
        • Product Portfolio
        • Profitability by Market Segments (Product/Age /Sales Channel/Region)
        • Sales Footprint
        • Strategy Overview
          • Marketing Strategy
          • Product Strategy
          • Channel Strategy
      • Michael Foods Inc.
        • Overview
        • Product Portfolio
        • Profitability by Market Segments (Product/Age /Sales Channel/Region)
        • Sales Footprint
        • Strategy Overview
          • Marketing Strategy
          • Product Strategy
          • Channel Strategy
      • Hillandale Farms
        • Overview
        • Product Portfolio
        • Profitability by Market Segments (Product/Age /Sales Channel/Region)
        • Sales Footprint
        • Strategy Overview
          • Marketing Strategy
          • Product Strategy
          • Channel Strategy
      • Trillium Farm Holdings L.LC.
        • Overview
        • Product Portfolio
        • Profitability by Market Segments (Product/Age /Sales Channel/Region)
        • Sales Footprint
        • Strategy Overview
          • Marketing Strategy
          • Product Strategy
          • Channel Strategy
      • Rembrandt Enterprises
        • Overview
        • Product Portfolio
        • Profitability by Market Segments (Product/Age /Sales Channel/Region)
        • Sales Footprint
        • Strategy Overview
          • Marketing Strategy
          • Product Strategy
          • Channel Strategy
      • Hickman's Egg Ranch
        • Overview
        • Product Portfolio
        • Profitability by Market Segments (Product/Age /Sales Channel/Region)
        • Sales Footprint
        • Strategy Overview
          • Marketing Strategy
          • Product Strategy
          • Channel Strategy
      • Midwest Poultry Services L.P.
        • Overview
        • Product Portfolio
        • Profitability by Market Segments (Product/Age /Sales Channel/Region)
        • Sales Footprint
        • Strategy Overview
          • Marketing Strategy
          • Product Strategy
          • Channel Strategy
      • Sparboe Farms
        • Overview
        • Product Portfolio
        • Profitability by Market Segments (Product/Age /Sales Channel/Region)
        • Sales Footprint
        • Strategy Overview
          • Marketing Strategy
          • Product Strategy
          • Channel Strategy
      • Herbruck's Poultry Ranch
        • Overview
        • Product Portfolio
        • Profitability by Market Segments (Product/Age /Sales Channel/Region)
        • Sales Footprint
        • Strategy Overview
          • Marketing Strategy
          • Product Strategy
          • Channel Strategy
      • Weaver Brothers
        • Overview
        • Product Portfolio
        • Profitability by Market Segments (Product/Age /Sales Channel/Region)
        • Sales Footprint
        • Strategy Overview
          • Marketing Strategy
          • Product Strategy
          • Channel Strategy
      • Daybreak Foods Inc.
        • Overview
        • Product Portfolio
        • Profitability by Market Segments (Product/Age /Sales Channel/Region)
        • Sales Footprint
        • Strategy Overview
          • Marketing Strategy
          • Product Strategy
          • Channel Strategy
      • The Compass Group
        • Overview
        • Product Portfolio
        • Profitability by Market Segments (Product/Age /Sales Channel/Region)
        • Sales Footprint
        • Strategy Overview
          • Marketing Strategy
          • Product Strategy
          • Channel Strategy
      • ISE America Inc.
        • Overview
        • Product Portfolio
        • Profitability by Market Segments (Product/Age /Sales Channel/Region)
        • Sales Footprint
        • Strategy Overview
          • Marketing Strategy
          • Product Strategy
          • Channel Strategy
      • Michael Foods Group, Inc.
        • Overview
        • Product Portfolio
        • Profitability by Market Segments (Product/Age /Sales Channel/Region)
        • Sales Footprint
        • Strategy Overview
          • Marketing Strategy
          • Product Strategy
          • Channel Strategy
  24. Assumptions & Acronyms Used
  25. Research Methodology

List of Tables

  • Table 1: Global Market Value (USD Billion) Forecast by Region, 2020-2035
  • Table 2: Global Market Value (USD Billion) Forecast by Product Type, 2020-2035
  • Table 3: Global Market Value (USD Billion) Forecast by Color, 2020-2035
  • Table 4: Global Market Value (USD Billion) Forecast by Size, 2020-2035
  • Table 5: Global Market Value (USD Billion) Forecast by End-Use, 2020-2035
  • Table 6: Global Market Value (USD Billion) Forecast by Form, 2020-2035
  • Table 7: Global Market Value (USD Billion) Forecast by Source, 2020-2035
  • Table 8: Global Market Value (USD Billion) Forecast by Sales Channel, 2020-2035
  • Table 9: North America Market Value (USD Billion) Forecast by Country, 2020-2035
  • Table 10: North America Market Value (USD Billion) Forecast by Product Type, 2020-2035
  • Table 11: North America Market Value (USD Billion) Forecast by Color, 2020-2035
  • Table 12: North America Market Value (USD Billion) Forecast by Size, 2020-2035
  • Table 13: North America Market Value (USD Billion) Forecast by End-Use, 2020-2035
  • Table 14: North America Market Value (USD Billion) Forecast by Form, 2020-2035
  • Table 15: North America Market Value (USD Billion) Forecast by Source, 2020-2035
  • Table 16: North America Market Value (USD Billion) Forecast by Sales Channel, 2020-2035
  • Table 17: Latin America Market Value (USD Billion) Forecast by Country, 2020-2035
  • Table 18: Latin America Market Value (USD Billion) Forecast by Product Type, 2020-2035
  • Table 19: Latin America Market Value (USD Billion) Forecast by Color, 2020-2035
  • Table 20: Latin America Market Value (USD Billion) Forecast by Size, 2020-2035
  • Table 21: Latin America Market Value (USD Billion) Forecast by End-Use, 2020-2035
  • Table 22: Latin America Market Value (USD Billion) Forecast by Form, 2020-2035
  • Table 23: Latin America Market Value (USD Billion) Forecast by Source, 2020-2035
  • Table 24: Latin America Market Value (USD Billion) Forecast by Sales Channel, 2020-2035
  • Table 25: Western Europe Market Value (USD Billion) Forecast by Country, 2020-2035
  • Table 26: Western Europe Market Value (USD Billion) Forecast by Product Type, 2020-2035
  • Table 27: Western Europe Market Value (USD Billion) Forecast by Color, 2020-2035
  • Table 28: Western Europe Market Value (USD Billion) Forecast by Size, 2020-2035
  • Table 29: Western Europe Market Value (USD Billion) Forecast by End-Use, 2020-2035
  • Table 30: Western Europe Market Value (USD Billion) Forecast by Form, 2020-2035
  • Table 31: Western Europe Market Value (USD Billion) Forecast by Source, 2020-2035
  • Table 32: Western Europe Market Value (USD Billion) Forecast by Sales Channel, 2020-2035
  • Table 33: Eastern Europe Market Value (USD Billion) Forecast by Country, 2020-2035
  • Table 34: Eastern Europe Market Value (USD Billion) Forecast by Product Type, 2020-2035
  • Table 35: Eastern Europe Market Value (USD Billion) Forecast by Color, 2020-2035
  • Table 36: Eastern Europe Market Value (USD Billion) Forecast by Size, 2020-2035
  • Table 37: Eastern Europe Market Value (USD Billion) Forecast by End-Use, 2020-2035
  • Table 38: Eastern Europe Market Value (USD Billion) Forecast by Form, 2020-2035
  • Table 39: Eastern Europe Market Value (USD Billion) Forecast by Source, 2020-2035
  • Table 40: Eastern Europe Market Value (USD Billion) Forecast by Sales Channel, 2020-2035
  • Table 41: East Asia Market Value (USD Billion) Forecast by Country, 2020-2035
  • Table 42: East Asia Market Value (USD Billion) Forecast by Product Type, 2020-2035
  • Table 43: East Asia Market Value (USD Billion) Forecast by Color, 2020-2035
  • Table 44: East Asia Market Value (USD Billion) Forecast by Size, 2020-2035
  • Table 45: East Asia Market Value (USD Billion) Forecast by End-Use, 2020-2035
  • Table 46: East Asia Market Value (USD Billion) Forecast by Form, 2020-2035
  • Table 47: East Asia Market Value (USD Billion) Forecast by Source, 2020-2035
  • Table 48: East Asia Market Value (USD Billion) Forecast by Sales Channel, 2020-2035
  • Table 49: South Asia & Pacific Market Value (USD Billion) Forecast by Country, 2020-2035
  • Table 50: South Asia & Pacific Market Value (USD Billion) Forecast by Product Type, 2020-2035
  • Table 51: South Asia & Pacific Market Value (USD Billion) Forecast by Color, 2020-2035
  • Table 52: South Asia & Pacific Market Value (USD Billion) Forecast by Size, 2020-2035
  • Table 53: South Asia & Pacific Market Value (USD Billion) Forecast by End-Use, 2020-2035
  • Table 54: South Asia & Pacific Market Value (USD Billion) Forecast by Form, 2020-2035
  • Table 55: South Asia & Pacific Market Value (USD Billion) Forecast by Source, 2020-2035
  • Table 56: South Asia & Pacific Market Value (USD Billion) Forecast by Sales Channel, 2020-2035
  • Table 57: Middle East and Africa Market Value (USD Billion) Forecast by Country, 2020-2035
  • Table 58: Middle East and Africa Market Value (USD Billion) Forecast by Product Type, 2020-2035
  • Table 59: Middle East and Africa Market Value (USD Billion) Forecast by Color, 2020-2035
  • Table 60: Middle East and Africa Market Value (USD Billion) Forecast by Size, 2020-2035
  • Table 61: Middle East and Africa Market Value (USD Billion) Forecast by End-Use, 2020-2035
  • Table 62: Middle East and Africa Market Value (USD Billion) Forecast by Form, 2020-2035
  • Table 63: Middle East and Africa Market Value (USD Billion) Forecast by Source, 2020-2035
  • Table 64: Middle East and Africa Market Value (USD Billion) Forecast by Sales Channel, 2020-2035

List of Figures

  • Figure 1: Global Market Pricing Analysis
  • Figure 2: Global Market Value (USD Billion) Forecast 2020-2035
  • Figure 3: Global Market Value Share and BPS Analysis by Product Type, 2025 and 2035
  • Figure 4: Global Market Y-o-Y Growth Comparison by Product Type, 2025-2035
  • Figure 5: Global Market Attractiveness Analysis by Product Type
  • Figure 6: Global Market Value Share and BPS Analysis by Color, 2025 and 2035
  • Figure 7: Global Market Y-o-Y Growth Comparison by Color, 2025-2035
  • Figure 8: Global Market Attractiveness Analysis by Color
  • Figure 9: Global Market Value Share and BPS Analysis by Size, 2025 and 2035
  • Figure 10: Global Market Y-o-Y Growth Comparison by Size, 2025-2035
  • Figure 11: Global Market Attractiveness Analysis by Size
  • Figure 12: Global Market Value Share and BPS Analysis by End-Use, 2025 and 2035
  • Figure 13: Global Market Y-o-Y Growth Comparison by End-Use, 2025-2035
  • Figure 14: Global Market Attractiveness Analysis by End-Use
  • Figure 15: Global Market Value Share and BPS Analysis by Form, 2025 and 2035
  • Figure 16: Global Market Y-o-Y Growth Comparison by Form, 2025-2035
  • Figure 17: Global Market Attractiveness Analysis by Form
  • Figure 18: Global Market Value Share and BPS Analysis by Source, 2025 and 2035
  • Figure 19: Global Market Y-o-Y Growth Comparison by Source, 2025-2035
  • Figure 20: Global Market Attractiveness Analysis by Source
  • Figure 21: Global Market Value Share and BPS Analysis by Sales Channel, 2025 and 2035
  • Figure 22: Global Market Y-o-Y Growth Comparison by Sales Channel, 2025-2035
  • Figure 23: Global Market Attractiveness Analysis by Sales Channel
  • Figure 24: Global Market Value (USD Billion) Share and BPS Analysis by Region, 2025 and 2035
  • Figure 25: Global Market Y-o-Y Growth Comparison by Region, 2025-2035
  • Figure 26: Global Market Attractiveness Analysis by Region
  • Figure 27: North America Market Incremental $ Opportunity, 2025-2035
  • Figure 28: Latin America Market Incremental $ Opportunity, 2025-2035
  • Figure 29: Western Europe Market Incremental $ Opportunity, 2025-2035
  • Figure 30: Eastern Europe Market Incremental $ Opportunity, 2025-2035
  • Figure 31: East Asia Market Incremental $ Opportunity, 2025-2035
  • Figure 32: South Asia & Pacific Market Incremental $ Opportunity, 2025-2035
  • Figure 33: Middle East and Africa Market Incremental $ Opportunity, 2025-2035
  • Figure 34: North America Market Value Share and BPS Analysis by Country, 2025 and 2035
  • Figure 35: North America Market Value Share and BPS Analysis by Product Type, 2025 and 2035
  • Figure 36: North America Market Y-o-Y Growth Comparison by Product Type, 2025-2035
  • Figure 37: North America Market Attractiveness Analysis by Product Type
  • Figure 38: North America Market Value Share and BPS Analysis by Color, 2025 and 2035
  • Figure 39: North America Market Y-o-Y Growth Comparison by Color, 2025-2035
  • Figure 40: North America Market Attractiveness Analysis by Color
  • Figure 41: North America Market Value Share and BPS Analysis by Size, 2025 and 2035
  • Figure 42: North America Market Y-o-Y Growth Comparison by Size, 2025-2035
  • Figure 43: North America Market Attractiveness Analysis by Size
  • Figure 44: North America Market Value Share and BPS Analysis by End-Use, 2025 and 2035
  • Figure 45: North America Market Y-o-Y Growth Comparison by End-Use, 2025-2035
  • Figure 46: North America Market Attractiveness Analysis by End-Use
  • Figure 47: North America Market Value Share and BPS Analysis by Form, 2025 and 2035
  • Figure 48: North America Market Y-o-Y Growth Comparison by Form, 2025-2035
  • Figure 49: North America Market Attractiveness Analysis by Form
  • Figure 50: North America Market Value Share and BPS Analysis by Source, 2025 and 2035
  • Figure 51: North America Market Y-o-Y Growth Comparison by Source, 2025-2035
  • Figure 52: North America Market Attractiveness Analysis by Source
  • Figure 53: North America Market Value Share and BPS Analysis by Sales Channel, 2025 and 2035
  • Figure 54: North America Market Y-o-Y Growth Comparison by Sales Channel, 2025-2035
  • Figure 55: North America Market Attractiveness Analysis by Sales Channel
  • Figure 56: Latin America Market Value Share and BPS Analysis by Country, 2025 and 2035
  • Figure 57: Latin America Market Value Share and BPS Analysis by Product Type, 2025 and 2035
  • Figure 58: Latin America Market Y-o-Y Growth Comparison by Product Type, 2025-2035
  • Figure 59: Latin America Market Attractiveness Analysis by Product Type
  • Figure 60: Latin America Market Value Share and BPS Analysis by Color, 2025 and 2035
  • Figure 61: Latin America Market Y-o-Y Growth Comparison by Color, 2025-2035
  • Figure 62: Latin America Market Attractiveness Analysis by Color
  • Figure 63: Latin America Market Value Share and BPS Analysis by Size, 2025 and 2035
  • Figure 64: Latin America Market Y-o-Y Growth Comparison by Size, 2025-2035
  • Figure 65: Latin America Market Attractiveness Analysis by Size
  • Figure 66: Latin America Market Value Share and BPS Analysis by End-Use, 2025 and 2035
  • Figure 67: Latin America Market Y-o-Y Growth Comparison by End-Use, 2025-2035
  • Figure 68: Latin America Market Attractiveness Analysis by End-Use
  • Figure 69: Latin America Market Value Share and BPS Analysis by Form, 2025 and 2035
  • Figure 70: Latin America Market Y-o-Y Growth Comparison by Form, 2025-2035
  • Figure 71: Latin America Market Attractiveness Analysis by Form
  • Figure 72: Latin America Market Value Share and BPS Analysis by Source, 2025 and 2035
  • Figure 73: Latin America Market Y-o-Y Growth Comparison by Source, 2025-2035
  • Figure 74: Latin America Market Attractiveness Analysis by Source
  • Figure 75: Latin America Market Value Share and BPS Analysis by Sales Channel, 2025 and 2035
  • Figure 76: Latin America Market Y-o-Y Growth Comparison by Sales Channel, 2025-2035
  • Figure 77: Latin America Market Attractiveness Analysis by Sales Channel
  • Figure 78: Western Europe Market Value Share and BPS Analysis by Country, 2025 and 2035
  • Figure 79: Western Europe Market Value Share and BPS Analysis by Product Type, 2025 and 2035
  • Figure 80: Western Europe Market Y-o-Y Growth Comparison by Product Type, 2025-2035
  • Figure 81: Western Europe Market Attractiveness Analysis by Product Type
  • Figure 82: Western Europe Market Value Share and BPS Analysis by Color, 2025 and 2035
  • Figure 83: Western Europe Market Y-o-Y Growth Comparison by Color, 2025-2035
  • Figure 84: Western Europe Market Attractiveness Analysis by Color
  • Figure 85: Western Europe Market Value Share and BPS Analysis by Size, 2025 and 2035
  • Figure 86: Western Europe Market Y-o-Y Growth Comparison by Size, 2025-2035
  • Figure 87: Western Europe Market Attractiveness Analysis by Size
  • Figure 88: Western Europe Market Value Share and BPS Analysis by End-Use, 2025 and 2035
  • Figure 89: Western Europe Market Y-o-Y Growth Comparison by End-Use, 2025-2035
  • Figure 90: Western Europe Market Attractiveness Analysis by End-Use
  • Figure 91: Western Europe Market Value Share and BPS Analysis by Form, 2025 and 2035
  • Figure 92: Western Europe Market Y-o-Y Growth Comparison by Form, 2025-2035
  • Figure 93: Western Europe Market Attractiveness Analysis by Form
  • Figure 94: Western Europe Market Value Share and BPS Analysis by Source, 2025 and 2035
  • Figure 95: Western Europe Market Y-o-Y Growth Comparison by Source, 2025-2035
  • Figure 96: Western Europe Market Attractiveness Analysis by Source
  • Figure 97: Western Europe Market Value Share and BPS Analysis by Sales Channel, 2025 and 2035
  • Figure 98: Western Europe Market Y-o-Y Growth Comparison by Sales Channel, 2025-2035
  • Figure 99: Western Europe Market Attractiveness Analysis by Sales Channel
  • Figure 100: Eastern Europe Market Value Share and BPS Analysis by Country, 2025 and 2035
  • Figure 101: Eastern Europe Market Value Share and BPS Analysis by Product Type, 2025 and 2035
  • Figure 102: Eastern Europe Market Y-o-Y Growth Comparison by Product Type, 2025-2035
  • Figure 103: Eastern Europe Market Attractiveness Analysis by Product Type
  • Figure 104: Eastern Europe Market Value Share and BPS Analysis by Color, 2025 and 2035
  • Figure 105: Eastern Europe Market Y-o-Y Growth Comparison by Color, 2025-2035
  • Figure 106: Eastern Europe Market Attractiveness Analysis by Color
  • Figure 107: Eastern Europe Market Value Share and BPS Analysis by Size, 2025 and 2035
  • Figure 108: Eastern Europe Market Y-o-Y Growth Comparison by Size, 2025-2035
  • Figure 109: Eastern Europe Market Attractiveness Analysis by Size
  • Figure 110: Eastern Europe Market Value Share and BPS Analysis by End-Use, 2025 and 2035
  • Figure 111: Eastern Europe Market Y-o-Y Growth Comparison by End-Use, 2025-2035
  • Figure 112: Eastern Europe Market Attractiveness Analysis by End-Use
  • Figure 113: Eastern Europe Market Value Share and BPS Analysis by Form, 2025 and 2035
  • Figure 114: Eastern Europe Market Y-o-Y Growth Comparison by Form, 2025-2035
  • Figure 115: Eastern Europe Market Attractiveness Analysis by Form
  • Figure 116: Eastern Europe Market Value Share and BPS Analysis by Source, 2025 and 2035
  • Figure 117: Eastern Europe Market Y-o-Y Growth Comparison by Source, 2025-2035
  • Figure 118: Eastern Europe Market Attractiveness Analysis by Source
  • Figure 119: Eastern Europe Market Value Share and BPS Analysis by Sales Channel, 2025 and 2035
  • Figure 120: Eastern Europe Market Y-o-Y Growth Comparison by Sales Channel, 2025-2035
  • Figure 121: Eastern Europe Market Attractiveness Analysis by Sales Channel
  • Figure 122: East Asia Market Value Share and BPS Analysis by Country, 2025 and 2035
  • Figure 123: East Asia Market Value Share and BPS Analysis by Product Type, 2025 and 2035
  • Figure 124: East Asia Market Y-o-Y Growth Comparison by Product Type, 2025-2035
  • Figure 125: East Asia Market Attractiveness Analysis by Product Type
  • Figure 126: East Asia Market Value Share and BPS Analysis by Color, 2025 and 2035
  • Figure 127: East Asia Market Y-o-Y Growth Comparison by Color, 2025-2035
  • Figure 128: East Asia Market Attractiveness Analysis by Color
  • Figure 129: East Asia Market Value Share and BPS Analysis by Size, 2025 and 2035
  • Figure 130: East Asia Market Y-o-Y Growth Comparison by Size, 2025-2035
  • Figure 131: East Asia Market Attractiveness Analysis by Size
  • Figure 132: East Asia Market Value Share and BPS Analysis by End-Use, 2025 and 2035
  • Figure 133: East Asia Market Y-o-Y Growth Comparison by End-Use, 2025-2035
  • Figure 134: East Asia Market Attractiveness Analysis by End-Use
  • Figure 135: East Asia Market Value Share and BPS Analysis by Form, 2025 and 2035
  • Figure 136: East Asia Market Y-o-Y Growth Comparison by Form, 2025-2035
  • Figure 137: East Asia Market Attractiveness Analysis by Form
  • Figure 138: East Asia Market Value Share and BPS Analysis by Source, 2025 and 2035
  • Figure 139: East Asia Market Y-o-Y Growth Comparison by Source, 2025-2035
  • Figure 140: East Asia Market Attractiveness Analysis by Source
  • Figure 141: East Asia Market Value Share and BPS Analysis by Sales Channel, 2025 and 2035
  • Figure 142: East Asia Market Y-o-Y Growth Comparison by Sales Channel, 2025-2035
  • Figure 143: East Asia Market Attractiveness Analysis by Sales Channel
  • Figure 144: South Asia & Pacific Market Value Share and BPS Analysis by Country, 2025 and 2035
  • Figure 145: South Asia & Pacific Market Value Share and BPS Analysis by Product Type, 2025 and 2035
  • Figure 146: South Asia & Pacific Market Y-o-Y Growth Comparison by Product Type, 2025-2035
  • Figure 147: South Asia & Pacific Market Attractiveness Analysis by Product Type
  • Figure 148: South Asia & Pacific Market Value Share and BPS Analysis by Color, 2025 and 2035
  • Figure 149: South Asia & Pacific Market Y-o-Y Growth Comparison by Color, 2025-2035
  • Figure 150: South Asia & Pacific Market Attractiveness Analysis by Color
  • Figure 151: South Asia & Pacific Market Value Share and BPS Analysis by Size, 2025 and 2035
  • Figure 152: South Asia & Pacific Market Y-o-Y Growth Comparison by Size, 2025-2035
  • Figure 153: South Asia & Pacific Market Attractiveness Analysis by Size
  • Figure 154: South Asia & Pacific Market Value Share and BPS Analysis by End-Use, 2025 and 2035
  • Figure 155: South Asia & Pacific Market Y-o-Y Growth Comparison by End-Use, 2025-2035
  • Figure 156: South Asia & Pacific Market Attractiveness Analysis by End-Use
  • Figure 157: South Asia & Pacific Market Value Share and BPS Analysis by Form, 2025 and 2035
  • Figure 158: South Asia & Pacific Market Y-o-Y Growth Comparison by Form, 2025-2035
  • Figure 159: South Asia & Pacific Market Attractiveness Analysis by Form
  • Figure 160: South Asia & Pacific Market Value Share and BPS Analysis by Source, 2025 and 2035
  • Figure 161: South Asia & Pacific Market Y-o-Y Growth Comparison by Source, 2025-2035
  • Figure 162: South Asia & Pacific Market Attractiveness Analysis by Source
  • Figure 163: South Asia & Pacific Market Value Share and BPS Analysis by Sales Channel, 2025 and 2035
  • Figure 164: South Asia & Pacific Market Y-o-Y Growth Comparison by Sales Channel, 2025-2035
  • Figure 165: South Asia & Pacific Market Attractiveness Analysis by Sales Channel
  • Figure 166: Middle East and Africa Market Value Share and BPS Analysis by Country, 2025 and 2035
  • Figure 167: Middle East and Africa Market Value Share and BPS Analysis by Product Type, 2025 and 2035
  • Figure 168: Middle East and Africa Market Y-o-Y Growth Comparison by Product Type, 2025-2035
  • Figure 169: Middle East and Africa Market Attractiveness Analysis by Product Type
  • Figure 170: Middle East and Africa Market Value Share and BPS Analysis by Color, 2025 and 2035
  • Figure 171: Middle East and Africa Market Y-o-Y Growth Comparison by Color, 2025-2035
  • Figure 172: Middle East and Africa Market Attractiveness Analysis by Color
  • Figure 173: Middle East and Africa Market Value Share and BPS Analysis by Size, 2025 and 2035
  • Figure 174: Middle East and Africa Market Y-o-Y Growth Comparison by Size, 2025-2035
  • Figure 175: Middle East and Africa Market Attractiveness Analysis by Size
  • Figure 176: Middle East and Africa Market Value Share and BPS Analysis by End-Use, 2025 and 2035
  • Figure 177: Middle East and Africa Market Y-o-Y Growth Comparison by End-Use, 2025-2035
  • Figure 178: Middle East and Africa Market Attractiveness Analysis by End-Use
  • Figure 179: Middle East and Africa Market Value Share and BPS Analysis by Form, 2025 and 2035
  • Figure 180: Middle East and Africa Market Y-o-Y Growth Comparison by Form, 2025-2035
  • Figure 181: Middle East and Africa Market Attractiveness Analysis by Form
  • Figure 182: Middle East and Africa Market Value Share and BPS Analysis by Source, 2025 and 2035
  • Figure 183: Middle East and Africa Market Y-o-Y Growth Comparison by Source, 2025-2035
  • Figure 184: Middle East and Africa Market Attractiveness Analysis by Source
  • Figure 185: Middle East and Africa Market Value Share and BPS Analysis by Sales Channel, 2025 and 2035
  • Figure 186: Middle East and Africa Market Y-o-Y Growth Comparison by Sales Channel, 2025-2035
  • Figure 187: Middle East and Africa Market Attractiveness Analysis by Sales Channel
  • Figure 188: Global Market - Tier Structure Analysis
  • Figure 189: Global Market - Company Share Analysis

Frequently Asked Questions

What is the estimated market size of the egg and egg products industry in 2025?

The industry is valued at USD 15.1 billion in 2025.

What is the projected industry size of the egg and egg products industry by 2035?

It is forecasted to reach USD 30.4 billion by 2035.

What is the expected CAGR for the egg and egg products industry between 2025 and 2035?

The industry is anticipated to grow at a CAGR of 7.3% during this period.

Which segment is expected to lead the egg and egg products market in 2025?

Conventional egg is projected to lead the market with a 65% share in 2025.

Which region is expected to witness the highest growth in the egg and egg products market?

Asia Pacific, particularly India, is expected to be the key growth region with a projected growth rate of 9.2%.

Explore Similar Insights

Future Market Insights

Egg and Egg Products Market