Egg Albumin Protein Market
Market Insights on Egg Albumin Protein covering sales outlook, demand forecast & up-to-date key trends
Egg Albumin Protein Market By Flavor Type, Application, Function & Region - Forecast 2022 – 2032
Egg Albumin Protein Market Outlook (2022-2032)
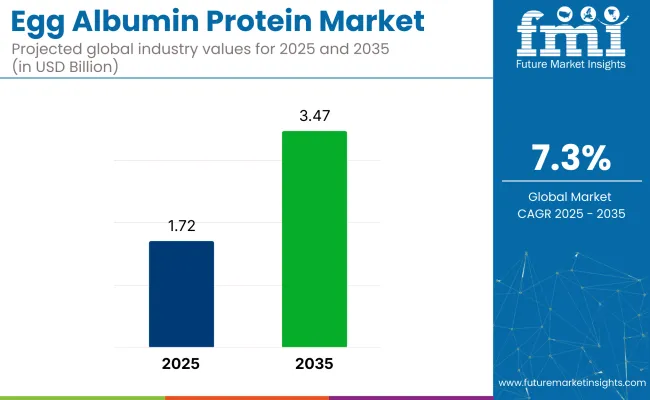
[300 Pages Report] The global egg albumin protein market is expected to reach a valuation of US$ 1.42 Bn by the end of 2022, accelerating at a CAGR of 7.3% during 2022-2032. The egg albumin protein market is anticipated to reach US$ 2.88 Bn in 2032.
Attributes |
Key Statistics |
Global Egg Albumin Protein Market Estimated Size (2022E) |
US$ 1.42 Bn |
Projected Market Valuation (2032F) |
US$ 2.88 Bn |
Value-based CAGR (2022-2032) |
7.3% |
Collective Value Share: Top 3 Countries |
26% |
As per a report by Future Market Insights (FMI), an egg contains 60% of egg white by weight. Egg whites of hens and ducks are high in proteins that are essential for the human body. Ovalbumin is considered to be the most important egg white protein.
Let us know your requirement to get
100% FREE customization
2017-2021 Egg Albumin Protein Demand Outlook Compared to 2022-2032 Forecast
Ovalbumin protein that has been separated from the egg white has a wide range of applications in the food and beverage and pharmaceutical industries. Ovotransferrin, which is another egg white protein, functions as an antimicrobial agent, as well as a metal transporter. Lysozyme, on the other hand, is used as a preservative in processed food items.
Ovalbumin is commonly used as a nutritional supplement by athletes. Egg white protein powder has high heat stability and resistance, which allows it to be used in a variety of food processing applications.
Egg albumin protein powder is available on the market in the form of egg albumin hydrolysate and egg albumin protein white. Increasing use of egg albumin protein in pet treats and pet food owing to its nutritional benefits is anticipated to boost the market.
Spurred by the aforementioned factors, the global egg albumin protein market is set to exhibit growth at a CAGR of 7.3% in the forecast period from 2022 to 2032.
2 Significant Trends Fostering the Consumption of Egg Albumin Protein
- Sports Nutrition Industry to Accelerate Adoption
Egg albumin protein is absorbed by the blood and is used to separate proteins. It is expected to gain immense popularity in the sports nutrition market during the assessment period as it is scientifically proven to be an energy and strength booster. Powdered egg albumin protein is also considered to be a healer of post-workout muscle damage.
- Food Formulation Firms to Create New Items with Powdered Albumin
Besides, the food formulation industry is set to adopt egg albumin protein as it contains no cholesterol and very little fat. It accounts for more than half the weight of an egg and provides thermal coagulation. Its high solubility property makes it an ideal ingredient for use in pet food.
Find your sweet spots for generating winning opportunities in this market.
Talk to AnalystComparative View of Adjacent Egg Protein Market
Egg Protein Market:
Attributes |
Egg Protein Market |
Projected Market Valuation (2032) |
US$ 16 Bn |
Value-based CAGR (2022-2032) |
6.7% |
Key Players |
|
Latest Trends |
|
Egg White Powder Market:
Attributes |
Egg White Powder Market |
Projected Market Valuation (2032) |
US$ 4.9 Bn |
Value-based CAGR (2022-2032) |
10.9% |
Key Players |
|
Latest Trends |
|
Egg White Cubes Market:
Attributes |
Egg White Cubes Market |
Projected Market Valuation (2032) |
US$ 541.7 Mn |
Value-based CAGR (2022-2032) |
4.2% |
Key Players |
|
Latest Trends |
|
Country-wise Insights
What is the U.K. Egg Albumin Protein Market Outlook?
“Egg Albumin Powder to Be Utilized by Fast-food Chains in the U.K.”
The U.K. egg albumin protein market is expected to reach a valuation of US$ 31.1 Mn by 2022, finds FMI. Increasing consumer awareness regarding the functional benefits associated with hen egg albumin protein is set to augment the U.K. market. Rising geriatric population and expansion of the nutritional food sector are also likely to aid growth.
Besides, demand for egg albumin is increasing in the country as fast-food chains are offering albumen-only breakfast flatbreads, sarnies, and burritos to promote healthy eating. Egg albumin has recently become more expensive than yolks in the U.K.
How is the U.S. Egg Albumin Protein Market Faring?
“Personal Care Industry in the U.S. is Using Egg White Albumin”
The U.S. is expected to reach a valuation of US$ 266.3 Mn by 2022 and is anticipated to grow at a CAGR of 5.2% during the forecast period from 2022 to 2032. Increasing use of egg albumin protein powder by personal care product manufacturers for formulations of shampoos is likely to aid the U.S. market. Shampoos infused with egg albumin protein can reduce hair fall and provide thicker-looking solid hair.

A unified Market Research Subscription Platform, built for today's disparate research needs.
Category-wise Insights
Which is the Leading End-use Application of Egg Albumin Proteins?
“Bakery and Confectionery Industry to Adopt Powdered Albumin”
By application, the global egg albumin protein market is divided into bakery & confectionery, protein & nutritional bars, breakfast cereals, functional beverages, dietary supplements, sports nutrition, infant nutrition, prepared foods, meat analogs, dressings, sauces & spreads, pharmaceutical products, personal care products, dairy & desserts, and others.
Out of these, the bakery and confectionery segment is expected to generate the largest market share in the forecast period. Increasing use of albumin for baking in both developed and developing economies to provide stability and volume to baked goods is likely to drive the segment.
Which is the Dominant Function of Egg Albumin Proteins?
“Rising Use of Powdered Egg Albumin as a Thickening Agent to Aid Growth”
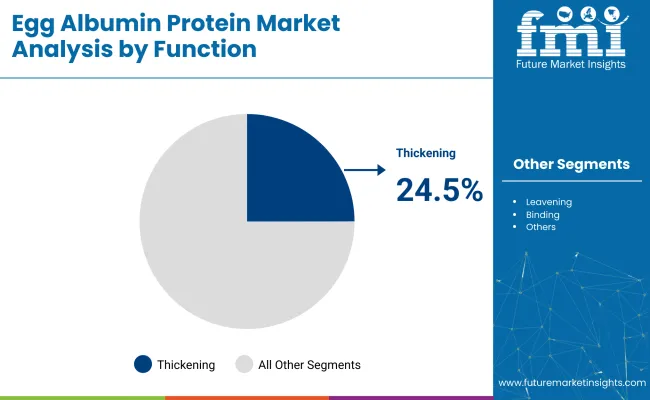
By function, the global egg albumin protein market is segmented into thickening, leavening, binding, preservatives/antimicrobial, emulsifying, crystallization, and others. Amongst these, the thickening segment is expected to create an absolute $ opportunity of US$ 294.3 Mn by the end of 2022.
Which Egg Albumin Protein Flavor Type is Set to Exhibit Steady Growth?
“Athletes to Consume Health Supplements Infused with Unflavored Egg Albumin”
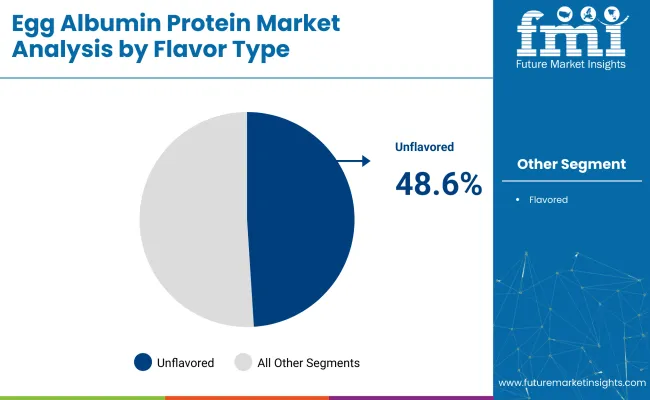
By flavor, the egg albumin market is segregated into flavored and regular/unflavored. The regular/unflavored segment is expected to reach US$ 1.03 Bn by 2022. Increasing demand for health supplements infused with unflavored egg albumin protein for quick recovery after exercise or muscle building activities is set to drive the segment.
Competitive Landscape
Egg albumin protein is produced with the help of hydrolysis process, which reduces the distinctive odor of eggs to a bare minimum. The protein powder can be used to nourish hair as it protects the hair from damage and drying.
As a result, manufacturers in the cosmetics and personal care industry globally are using egg white protein powder to create a wide range of haircare and skincare products. Besides, high demand for albumin protein in the processed food industry is anticipated to create new growth opportunities for market players.
The global egg albumin protein market is set to witness the entry of various start-up companies in the upcoming decade. Some of the recent industry developments by start-ups include:
- In July 2022, RXBAR, a clean-label consumer packaged goods based in Illinois, introduced RXBar A.M., its new breakfast bars in three flavors, namely, blueberry, chocolate, and honey cinnamon peanut butter. All the bars contain egg white as a protein base and are sweetened with coconut sugar and honey.
- In March 2022, Every Co. based in South San Francisco, unveiled the world’s first egg white named EVERY EggWhite that was made without a chicken. The novel ingredient would provide the culinary functionality and taste of egg whites required by chefs and bakers. It aims to cater to the surging demand for animal-free protein.
Scope of the Report
Attribute |
Details |
Estimated Market Size (2022) |
US$ 1.42 Bn |
Projected Market Valuation (2032) |
US$ 2.88 Bn |
Value-based CAGR (2022-2032) |
7.3% |
Forecast Period |
2022-2032 |
Historical Data Available for |
2017-2021 |
Market Analysis |
Value (US$ Bn) and Volume (MT) |
Key Regions Covered |
North America, Latin America, Europe, East Asia, South Asia, and the Middle East & Africa |
Key Countries Covered |
U.S., Brazil, Mexico, Germany, U.K., China, India, Japan, Australia, and GCC Countries |
Key Segments Covered |
Flavor Type, Function, End-use Application, and Region |
Key Companies Profiled |
|
Report Coverage |
Market forecast, company share analysis, competition intelligence, DROT analysis, market dynamics and challenges, and strategic growth initiatives |
Egg Albumin Protein Market Outlook by Category
By Flavor Type:
- Regular/Unflavored
- Flavored
By End-use Application:
- Bakery & Confectionery
- Protein & Nutritional Bars
- Breakfast Cereals
- Functional Beverages
- Dietary Supplements
- Sports Nutrition
- Infant Nutrition
- Prepared Foods
- Meat Analogs
- Dressings, Sauces & Spreads
- Pharmaceutical Products
- Personal Care Products
- Dairy & Desserts
- Others
By Function:
- Thickening
- Leavening
- Binding
- Preservatives/Antimicrobial
- Emulsifying
- Crystalization
- Others
By Region:
- North America
- Latin America
- Europe
- Middle east and Africa
- East Asia
- South Asia
- Oceania
Frequently Asked Questions
The egg albumin protein market is expected to grow at a CAGR of 7.3% during 2022-2032.
By 2032, the egg albumin protein market is expected to be worth US$ 2.88 Bn.
High demand for processed foods is a key factor driving the egg albumin protein market.
Europe is expected to generate the highest egg albumin protein market share.
What are the key strategies adopted by major players in the egg albumin protein market? Major market players are introducing new products, improving conventional products, and investing in research & development activities.
Some of the key players in the egg albumin protein market are Merck KGaA, HiMedia Laboratories Pvt. Ltd., Kewpie Corporation, Now Health Group, and Rembrandt Foods.
Table of Content
1. Executive Summary
1.1. Global Market Outlook
1.2. Demand-side Trends
1.3. Supply-side Trends
1.4. Technology Roadmap Analysis
1.5. Analysis and Recommendations
2. Market Overview
2.1. Market Coverage / Taxonomy
2.2. Market Definition / Scope / Limitations
3. Market Background
3.1. Market Dynamics
3.1.1. Drivers
3.1.2. Restraints
3.1.3. Opportunity
3.1.4. Trends
3.2. Scenario Forecast
3.2.1. Demand in Optimistic Scenario
3.2.2. Demand in Likely Scenario
3.2.3. Demand in Conservative Scenario
3.3. Product launches & Recent Developments
3.4. Product Life Cycle Analysis
3.5. Value Chain Analysis
3.5.1. Supply Side Participants and their Roles
3.5.1.1. Producers
3.5.1.2. Mid-Level Participants (Traders/ Agents/ Brokers)
3.5.1.3. Wholesalers and Distributors
3.5.2. % of Operating Margin Analysis
3.5.3. List of Raw Material Suppliers
3.5.4. List of Existing and Potential Buyer’s
3.6. Global Egg Albumin Protein Market- Pricing Analysis
3.6.1. Price Point Assessment by Region
3.6.2. Price Point Assessment by Product Type
3.6.3. Price Forecast till 2032
3.6.4. Factors affecting Pricing
3.7. Forecast Factors - Relevance & Impact
3.8. PESTLE and Porter’s Analysis
3.9. Regulatory Landscape
3.9.1. Packaging & Labelling Regulations
3.9.2. Certifications and Certifying Agency Overview
3.9.3. Import/Export Policies
3.10. Regional Parent Market Outlook
3.11. Consumers Survey Analysis
3.12. Macro-Economic Factors
3.13. Product Claims & Nutritional Information Scan by Buyers
4. Global Egg Albumin Protein Market Analysis 2017-2021 and Forecast, 2022-2032
4.1. Historical Market Size Value (US$ Bn) & Volume (MT) Analysis, 2017-2021
4.2. Current and Future Market Size Value (US$ Bn) & Volume (MT) Projections, 2022-2032
4.2.1. Y-o-Y Growth Trend Analysis
4.2.2. Absolute $ Opportunity Analysis
5. Global Egg Albumin Protein Market Analysis 2017-2021 and Forecast 2022-2032, By Flavor Type
5.1. Introduction / Key Findings
5.2. Historical Market Size Value (US$ Bn) & Volume (MT) Analysis By Flavor Type, 2017-2021
5.3. Current and Future Market Size Value (US$ Bn) & Volume (MT) Analysis and Forecast By Flavor Type, 2022-2032
5.3.1. Regular/Unflavored
5.3.2. Flavored
5.4. Y-o-Y Growth Trend Analysis By Flavor Type, 2017-2021
5.5. Absolute $ Opportunity Analysis By Flavor Type, 2022-2032
6. Global Egg Albumin Protein Market Analysis 2017-2021 and Forecast 2022-2032, By End-use Application
6.1. Introduction / Key Findings
6.2. Historical Market Size Value (US$ Bn) & Volume (MT) Analysis By End-use Application, 2017-2021
6.3. Current and Future Market Size Value (US$ Bn) & Volume (MT) Analysis and Forecast By End-use Application, 2022-2032
6.3.1. Bakery & Confectionery
6.3.2. Protein & Nutritional Bars
6.3.3. Breakfast Cereals
6.3.4. Functional Beverages
6.3.5. Dietary Supplements
6.3.6. Sports Nutrition
6.3.7. Infant Nutrition
6.3.8. Prepared Foods
6.3.9. Meat Analogs
6.3.10. Dressings, Sauces & Spreads
6.3.11. Pharmaceutical Products
6.3.12. Personal Care Products
6.3.13. Dairy and Desserts
6.3.14. Others
6.4. Y-o-Y Growth Trend Analysis By End-use Application, 2017-2021
6.5. Absolute $ Opportunity Analysis By End-use Application, 2022-2032
7. Global Egg Albumin Protein Market Analysis 2017-2021 and Forecast 2022-2032, By Function
7.1. Introduction / Key Findings
7.2. Historical Market Size Value (US$ Bn) & Volume (MT) Analysis By Function, 2017-2021
7.3. Current and Future Market Size Value (US$ Bn) & Volume (MT) Analysis and Forecast By Function, 2022-2032
7.3.1. Thickening
7.3.2. Leavening
7.3.3. Binding
7.3.4. Preservatives/Antimicrobial
7.3.5. Emulsifying
7.3.6. Crystalization
7.3.7. Others
7.4. Y-o-Y Growth Trend Analysis By Function, 2017-2021
7.5. Absolute $ Opportunity Analysis By Function, 2022-2032
8. Global Egg Albumin Protein Market Analysis 2017-2021 and Forecast 2022-2032, By Region
8.1. Introduction
8.2. Historical Market Size Value (US$ Bn) & Volume (MT) Analysis By Region, 2017-2021
8.3. Current Market Size Value (US$ Bn) & Volume (MT) Analysis and Forecast By Region, 2022-2032
8.3.1. North America
8.3.2. Latin America
8.3.3. Europe
8.3.4. East Asia
8.3.5. South Asia
8.3.6. Oceania
8.3.7. MEA
8.4. Market Attractiveness Analysis By Region
9. North America Egg Albumin Protein Market Analysis 2017-2021 and Forecast 2022-2032, By Country
9.1. Historical Market Size Value (US$ Bn) & Volume (MT) Trend Analysis By Market Taxonomy, 2017-2021
9.2. Market Size Value (US$ Bn) & Volume (MT) Forecast By Market Taxonomy, 2022-2032
9.2.1. By Country
9.2.1.1. U.S.
9.2.1.2. Canada
9.2.2. By Flavor Type
9.2.3. By End-use Application
9.2.4. By Function
9.3. Market Attractiveness Analysis
9.3.1. By Country
9.3.2. By Flavor Type
9.3.3. By End-use Application
9.3.4. By Function
9.4. Key Takeaways
10. Latin America Egg Albumin Protein Market Analysis 2017-2021 and Forecast 2022-2032, By Country
10.1. Historical Market Size Value (US$ Bn) & Volume (MT) Trend Analysis By Market Taxonomy, 2017-2021
10.2. Market Size Value (US$ Bn) & Volume (MT) Forecast By Market Taxonomy, 2022-2032
10.2.1. By Country
10.2.1.1. Brazil
10.2.1.2. Mexico
10.2.1.3. Argentina
10.2.1.4. Chile
10.2.1.5. Peru
10.2.1.6. Rest of Latin America
10.2.2. By Flavor Type
10.2.3. By End-use Application
10.2.4. By Function
10.3. Market Attractiveness Analysis
10.3.1. By Country
10.3.2. By Flavor Type
10.3.3. By End-use Application
10.3.4. By Function
10.4. Key Takeaways
11. Europe Egg Albumin Protein Market Analysis 2017-2021 and Forecast 2022-2032, By Country
11.1. Historical Market Size Value (US$ Bn) & Volume (MT) Trend Analysis By Market Taxonomy, 2017-2021
11.2. Market Size Value (US$ Bn) & Volume (MT) Forecast By Market Taxonomy, 2022-2032
11.2.1. By Country
11.2.1.1. Germany
11.2.1.2. Italy
11.2.1.3. France
11.2.1.4. U.K.
11.2.1.5. Spain
11.2.1.6. Russia
11.2.1.7. BENELUX
11.2.1.8. Poland
11.2.1.9. Nordic Countries
11.2.1.10. Rest of Europe
11.2.2. By Flavor Type
11.2.3. By End-use Application
11.2.4. By Function
11.3. Market Attractiveness Analysis
11.3.1. By Country
11.3.2. By Flavor Type
11.3.3. By End-use Application
11.3.4. By Function
11.4. Key Takeaways
12. East Asia Egg Albumin Protein Market Analysis 2017-2021 and Forecast 2022-2032, By Country
12.1. Historical Market Size Value (US$ Bn) & Volume (MT) Trend Analysis By Market Taxonomy, 2017-2021
12.2. Market Size Value (US$ Bn) & Volume (MT) Forecast By Market Taxonomy, 2022-2032
12.2.1. By Country
12.2.1.1. China
12.2.1.2. Japan
12.2.1.3. South Korea
12.2.2. By Flavor Type
12.2.3. By End-use Application
12.2.4. By Function
12.3. Market Attractiveness Analysis
12.3.1. By Country
12.3.2. By Flavor Type
12.3.3. By End-use Application
12.3.4. By Function
12.4. Key Takeaways
13. South Asia Egg Albumin Protein Market Analysis 2017-2021 and Forecast 2022-2032, By Country
13.1. Historical Market Size Value (US$ Bn) & Volume (MT) Trend Analysis By Market Taxonomy, 2017-2021
13.2. Market Size Value (US$ Bn) & Volume (MT) Forecast By Market Taxonomy, 2022-2032
13.2.1. By Country
13.2.1.1. India
13.2.1.2. Thailand
13.2.1.3. Malaysia
13.2.1.4. Indonesia
13.2.1.5. Rest of South Asia
13.2.2. By Flavor Type
13.2.3. By End-use Application
13.2.4. By Function
13.3. Market Attractiveness Analysis
13.3.1. By Country
13.3.2. By Flavor Type
13.3.3. By End-use Application
13.3.4. By Function
13.4. Key Takeaways
14. Oceania Egg Albumin Protein Market Analysis 2017-2021 and Forecast 2022-2032, By Country
14.1. Historical Market Size Value (US$ Bn) & Volume (MT) Trend Analysis By Market Taxonomy, 2017-2021
14.2. Market Size Value (US$ Bn) & Volume (MT) Forecast By Market Taxonomy, 2022-2032
14.2.1. By Country
14.2.1.1. Australia
14.2.1.2. New Zealand
14.2.2. By Flavor Type
14.2.3. By End-use Application
14.2.4. By Function
14.3. Market Attractiveness Analysis
14.3.1. By Country
14.3.2. By Flavor Type
14.3.3. By End-use Application
14.3.4. By Function
14.4. Key Takeaways
15. MEA Egg Albumin Protein Market Analysis 2017-2021 and Forecast 2022-2032, By Country
15.1. Historical Market Size Value (US$ Bn) & Volume (MT) Trend Analysis By Market Taxonomy, 2017-2021
15.2. Market Size Value (US$ Bn) & Volume (MT) Forecast By Market Taxonomy, 2022-2032
15.2.1. By Country
15.2.1.1. GCC Countries
15.2.1.2. South Africa
15.2.1.3. Central Africa
15.2.1.4. North Africa
15.2.2. By Flavor Type
15.2.3. By End-use Application
15.2.4. By Function
15.3. Market Attractiveness Analysis
15.3.1. By Country
15.3.2. By Flavor Type
15.3.3. By End-use Application
15.3.4. By Function
15.4. Key Takeaways
16. Key Countries Egg Albumin Protein Market Analysis
16.1. U.S.
16.1.1. Pricing Analysis
16.1.2. Market Share Analysis, 2021
16.1.2.1. By Flavor Type
16.1.2.2. By End-use Application
16.1.2.3. By Function
16.2. Canada
16.2.1. Pricing Analysis
16.2.2. Market Share Analysis, 2021
16.2.2.1. By Flavor Type
16.2.2.2. By End-use Application
16.2.2.3. By Function
16.3. Brazil
16.3.1. Pricing Analysis
16.3.2. Market Share Analysis, 2021
16.3.2.1. By Flavor Type
16.3.2.2. By End-use Application
16.3.2.3. By Function
16.4. Mexico
16.4.1. Pricing Analysis
16.4.2. Market Share Analysis, 2021
16.4.2.1. By Flavor Type
16.4.2.2. By End-use Application
16.4.2.3. By Function
16.5. Argentina
16.5.1. Pricing Analysis
16.5.2. Market Share Analysis, 2021
16.5.2.1. By Flavor Type
16.5.2.2. By End-use Application
16.5.2.3. By Function
16.6. Chile
16.6.1. Pricing Analysis
16.6.2. Market Share Analysis, 2021
16.6.2.1. By Flavor Type
16.6.2.2. By End-use Application
16.6.2.3. By Function
16.7. Peru
16.7.1. Pricing Analysis
16.7.2. Market Share Analysis, 2021
16.7.2.1. By Flavor Type
16.7.2.2. By End-use Application
16.7.2.3. By Function
16.8. Germany
16.8.1. Pricing Analysis
16.8.2. Market Share Analysis, 2021
16.8.2.1. By Flavor Type
16.8.2.2. By End-use Application
16.8.2.3. By Function
16.9. Italy
16.9.1. Pricing Analysis
16.9.2. Market Share Analysis, 2021
16.9.2.1. By Flavor Type
16.9.2.2. By End-use Application
16.9.2.3. By Function
16.10. France
16.10.1. Pricing Analysis
16.10.2. Market Share Analysis, 2021
16.10.2.1. By Flavor Type
16.10.2.2. By End-use Application
16.10.2.3. By Function
16.11. Spain
16.11.1. Pricing Analysis
16.11.2. Market Share Analysis, 2021
16.11.2.1. By Flavor Type
16.11.2.2. By End-use Application
16.11.2.3. By Function
16.12. U.K.
16.12.1. Pricing Analysis
16.12.2. Market Share Analysis, 2021
16.12.2.1. By Flavor Type
16.12.2.2. By End-use Application
16.12.2.3. By Function
16.13. Russia
16.13.1. Pricing Analysis
16.13.2. Market Share Analysis, 2021
16.13.2.1. By Flavor Type
16.13.2.2. By End-use Application
16.13.2.3. By Function
16.14. Poland
16.14.1. Pricing Analysis
16.14.2. Market Share Analysis, 2021
16.14.2.1. By Flavor Type
16.14.2.2. By End-use Application
16.14.2.3. By Function
16.15. BENELUX
16.15.1. Pricing Analysis
16.15.2. Market Share Analysis, 2021
16.15.2.1. By Flavor Type
16.15.2.2. By End-use Application
16.15.2.3. By Function
16.16. Nordic Countries
16.16.1. Pricing Analysis
16.16.2. Market Share Analysis, 2021
16.16.2.1. By Flavor Type
16.16.2.2. By End-use Application
16.16.2.3. By Function
16.17. China
16.17.1. Pricing Analysis
16.17.2. Market Share Analysis, 2021
16.17.2.1. By Flavor Type
16.17.2.2. By End-use Application
16.17.2.3. By Function
16.18. Japan
16.18.1. Pricing Analysis
16.18.2. Market Share Analysis, 2021
16.18.2.1. By Flavor Type
16.18.2.2. By End-use Application
16.18.2.3. By Function
16.19. South Korea
16.19.1. Pricing Analysis
16.19.2. Market Share Analysis, 2021
16.19.2.1. By Flavor Type
16.19.2.2. By End-use Application
16.19.2.3. By Function
16.20. India
16.20.1. Pricing Analysis
16.20.2. Market Share Analysis, 2021
16.20.2.1. By Flavor Type
16.20.2.2. By End-use Application
16.20.2.3. By Function
16.21. Thailand
16.21.1. Pricing Analysis
16.21.2. Market Share Analysis, 2021
16.21.2.1. By Flavor Type
16.21.2.2. By End-use Application
16.21.2.3. By Function
16.22. Indonesia
16.22.1. Pricing Analysis
16.22.2. Market Share Analysis, 2021
16.22.2.1. By Flavor Type
16.22.2.2. By End-use Application
16.22.2.3. By Function
16.23. Malaysia
16.23.1. Pricing Analysis
16.23.2. Market Share Analysis, 2021
16.23.2.1. By Flavor Type
16.23.2.2. By End-use Application
16.23.2.3. By Function
16.24. Singapore
16.24.1. Pricing Analysis
16.24.2. Market Share Analysis, 2021
16.24.2.1. By Flavor Type
16.24.2.2. By End-use Application
16.24.2.3. By Function
16.25. GCC Countries
16.25.1. Pricing Analysis
16.25.2. Market Share Analysis, 2021
16.25.2.1. By Flavor Type
16.25.2.2. By End-use Application
16.25.2.3. By Function
16.26. South Africa
16.26.1. Pricing Analysis
16.26.2. Market Share Analysis, 2021
16.26.2.1. By Flavor Type
16.26.2.2. By End-use Application
16.26.2.3. By Function
16.27. Central Africa
16.27.1. Pricing Analysis
16.27.2. Market Share Analysis, 2021
16.27.2.1. By Flavor Type
16.27.2.2. By End-use Application
16.27.2.3. By Function
16.28. North Africa
16.28.1. Pricing Analysis
16.28.2. Market Share Analysis, 2021
16.28.2.1. By Flavor Type
16.28.2.2. By End-use Application
16.28.2.3. By Function
17. Market Structure Analysis
17.1. Competition Dashboard
17.2. Competition Benchmarking
17.3. Market Share Analysis of Top Players
17.3.1. By Regional
17.3.2. By Flavor Type
17.3.3. By End-use Application
17.3.4. By Function
18. Competition Analysis
18.1. Competition Deep Dive
18.1.1. IsoNova
18.1.1.1. Overview
18.1.1.2. Product Portfolio
18.1.1.3. Profitability by Market Segments (Product/Age /Sales Channel/Region)
18.1.1.4. Sales Footprint
18.1.1.5. Strategy Overview
18.1.1.5.1. Marketing Strategy
18.1.1.5.2. Product Strategy
18.1.1.5.3. Channel Strategy
18.1.2. Ottokemi
18.1.2.1. Overview
18.1.2.2. Product Portfolio
18.1.2.3. Profitability by Market Segments (Product/Age /Sales Channel/Region)
18.1.2.4. Sales Footprint
18.1.2.5. Strategy Overview
18.1.2.5.1. Marketing Strategy
18.1.2.5.2. Product Strategy
18.1.2.5.3. Channel Strategy
18.1.3. NUTRA HEALTHCARE
18.1.3.1. Overview
18.1.3.2. Product Portfolio
18.1.3.3. Profitability by Market Segments (Product/Age /Sales Channel/Region)
18.1.3.4. Sales Footprint
18.1.3.5. Strategy Overview
18.1.3.5.1. Marketing Strategy
18.1.3.5.2. Product Strategy
18.1.3.5.3. Channel Strategy
18.1.4. Hangzhou Tenway Biotechnology Co., Ltd.
18.1.4.1. Overview
18.1.4.2. Product Portfolio
18.1.4.3. Profitability by Market Segments (Product/Age /Sales Channel/Region)
18.1.4.4. Sales Footprint
18.1.4.5. Strategy Overview
18.1.4.5.1. Marketing Strategy
18.1.4.5.2. Product Strategy
18.1.4.5.3. Channel Strategy
18.1.5. Taj Agro Products
18.1.5.1. Overview
18.1.5.2. Product Portfolio
18.1.5.3. Profitability by Market Segments (Product/Age /Sales Channel/Region)
18.1.5.4. Sales Footprint
18.1.5.5. Strategy Overview
18.1.5.5.1. Marketing Strategy
18.1.5.5.2. Product Strategy
18.1.5.5.3. Channel Strategy
18.1.6. Okchem
18.1.6.1. Overview
18.1.6.2. Product Portfolio
18.1.6.3. Profitability by Market Segments (Product/Age /Sales Channel/Region)
18.1.6.4. Sales Footprint
18.1.6.5. Strategy Overview
18.1.6.5.1. Marketing Strategy
18.1.6.5.2. Product Strategy
18.1.6.5.3. Channel Strategy
18.1.7. Bioseutica
18.1.7.1. Overview
18.1.7.2. Product Portfolio
18.1.7.3. Profitability by Market Segments (Product/Age /Sales Channel/Region)
18.1.7.4. Sales Footprint
18.1.7.5. Strategy Overview
18.1.7.5.1. Marketing Strategy
18.1.7.5.2. Product Strategy
18.1.7.5.3. Channel Strategy
18.1.8. Blonyx
18.1.8.1. Overview
18.1.8.2. Product Portfolio
18.1.8.3. Profitability by Market Segments (Product/Age /Sales Channel/Region)
18.1.8.4. Sales Footprint
18.1.8.5. Strategy Overview
18.1.8.5.1. Marketing Strategy
18.1.8.5.2. Product Strategy
18.1.8.5.3. Channel Strategy
18.1.9. SKMBest Egg
18.1.9.1. Overview
18.1.9.2. Product Portfolio
18.1.9.3. Profitability by Market Segments (Product/Age /Sales Channel/Region)
18.1.9.4. Sales Footprint
18.1.9.5. Strategy Overview
18.1.9.5.1. Marketing Strategy
18.1.9.5.2. Product Strategy
18.1.9.5.3. Channel Strategy
18.1.10. Venky's
18.1.10.1. Overview
18.1.10.2. Product Portfolio
18.1.10.3. Profitability by Market Segments (Product/Age /Sales Channel/Region)
18.1.10.4. Sales Footprint
18.1.10.5. Strategy Overview
18.1.10.5.1. Marketing Strategy
18.1.10.5.2. Product Strategy
18.1.10.5.3. Channel Strategy
18.1.11. Others (on additional request)
19. Assumptions & Acronyms Used
20. Research Methodology
Let us know your requirement to get
100% FREE customization
List of Tables
Table 1: Global Egg Albumin Protein Market Value (US$ Bn) Forecast by Region, 2017-2032
Table 2: Global Egg Albumin Protein Market Volume (MT) Forecast by Region, 2017-2032
Table 3: Global Egg Albumin Protein Market Value (US$ Bn) Forecast by Flavor Type, 2017-2032
Table 4: Global Egg Albumin Protein Market Volume (MT) Forecast by Flavor Type, 2017-2032
Table 5: Global Egg Albumin Protein Market Value (US$ Bn) Forecast by End-use Application, 2017-2032
Table 6: Global Egg Albumin Protein Market Volume (MT) Forecast by End-use Application, 2017-2032
Table 7: Global Egg Albumin Protein Market Value (US$ Bn) Forecast by Function, 2017-2032
Table 8: Global Egg Albumin Protein Market Volume (MT) Forecast by Function, 2017-2032
Table 9: North America Egg Albumin Protein Market Value (US$ Bn) Forecast by Country, 2017-2032
Table 10: North America Egg Albumin Protein Market Volume (MT) Forecast by Country, 2017-2032
Table 11: North America Egg Albumin Protein Market Value (US$ Bn) Forecast by Flavor Type, 2017-2032
Table 12: North America Egg Albumin Protein Market Volume (MT) Forecast by Flavor Type, 2017-2032
Table 13: North America Egg Albumin Protein Market Value (US$ Bn) Forecast by End-use Application, 2017-2032
Table 14: North America Egg Albumin Protein Market Volume (MT) Forecast by End-use Application, 2017-2032
Table 15: North America Egg Albumin Protein Market Value (US$ Bn) Forecast by Function, 2017-2032
Table 16: North America Egg Albumin Protein Market Volume (MT) Forecast by Function, 2017-2032
Table 17: Latin America Egg Albumin Protein Market Value (US$ Bn) Forecast by Country, 2017-2032
Table 18: Latin America Egg Albumin Protein Market Volume (MT) Forecast by Country, 2017-2032
Table 19: Latin America Egg Albumin Protein Market Value (US$ Bn) Forecast by Flavor Type, 2017-2032
Table 20: Latin America Egg Albumin Protein Market Volume (MT) Forecast by Flavor Type, 2017-2032
Table 21: Latin America Egg Albumin Protein Market Value (US$ Bn) Forecast by End-use Application, 2017-2032
Table 22: Latin America Egg Albumin Protein Market Volume (MT) Forecast by End-use Application, 2017-2032
Table 23: Latin America Egg Albumin Protein Market Value (US$ Bn) Forecast by Function, 2017-2032
Table 24: Latin America Egg Albumin Protein Market Volume (MT) Forecast by Function, 2017-2032
Table 25: Europe Egg Albumin Protein Market Value (US$ Bn) Forecast by Country, 2017-2032
Table 26: Europe Egg Albumin Protein Market Volume (MT) Forecast by Country, 2017-2032
Table 27: Europe Egg Albumin Protein Market Value (US$ Bn) Forecast by Flavor Type, 2017-2032
Table 28: Europe Egg Albumin Protein Market Volume (MT) Forecast by Flavor Type, 2017-2032
Table 29: Europe Egg Albumin Protein Market Value (US$ Bn) Forecast by End-use Application, 2017-2032
Table 30: Europe Egg Albumin Protein Market Volume (MT) Forecast by End-use Application, 2017-2032
Table 31: Europe Egg Albumin Protein Market Value (US$ Bn) Forecast by Function, 2017-2032
Table 32: Europe Egg Albumin Protein Market Volume (MT) Forecast by Function, 2017-2032
Table 33: East Asia Egg Albumin Protein Market Value (US$ Bn) Forecast by Country, 2017-2032
Table 34: East Asia Egg Albumin Protein Market Volume (MT) Forecast by Country, 2017-2032
Table 35: East Asia Egg Albumin Protein Market Value (US$ Bn) Forecast by Flavor Type, 2017-2032
Table 36: East Asia Egg Albumin Protein Market Volume (MT) Forecast by Flavor Type, 2017-2032
Table 37: East Asia Egg Albumin Protein Market Value (US$ Bn) Forecast by End-use Application, 2017-2032
Table 38: East Asia Egg Albumin Protein Market Volume (MT) Forecast by End-use Application, 2017-2032
Table 39: East Asia Egg Albumin Protein Market Value (US$ Bn) Forecast by Function, 2017-2032
Table 40: East Asia Egg Albumin Protein Market Volume (MT) Forecast by Function, 2017-2032
Table 41: South Asia Egg Albumin Protein Market Value (US$ Bn) Forecast by Country, 2017-2032
Table 42: South Asia Egg Albumin Protein Market Volume (MT) Forecast by Country, 2017-2032
Table 43: South Asia Egg Albumin Protein Market Value (US$ Bn) Forecast by Flavor Type, 2017-2032
Table 44: South Asia Egg Albumin Protein Market Volume (MT) Forecast by Flavor Type, 2017-2032
Table 45: South Asia Egg Albumin Protein Market Value (US$ Bn) Forecast by End-use Application, 2017-2032
Table 46: South Asia Egg Albumin Protein Market Volume (MT) Forecast by End-use Application, 2017-2032
Table 47: South Asia Egg Albumin Protein Market Value (US$ Bn) Forecast by Function, 2017-2032
Table 48: South Asia Egg Albumin Protein Market Volume (MT) Forecast by Function, 2017-2032
Table 49: Oceania Egg Albumin Protein Market Value (US$ Bn) Forecast by Country, 2017-2032
Table 50: Oceania Egg Albumin Protein Market Volume (MT) Forecast by Country, 2017-2032
Table 51: Oceania Egg Albumin Protein Market Value (US$ Bn) Forecast by Flavor Type, 2017-2032
Table 52: Oceania Egg Albumin Protein Market Volume (MT) Forecast by Flavor Type, 2017-2032
Table 53: Oceania Egg Albumin Protein Market Value (US$ Bn) Forecast by End-use Application, 2017-2032
Table 54: Oceania Egg Albumin Protein Market Volume (MT) Forecast by End-use Application, 2017-2032
Table 55: Oceania Egg Albumin Protein Market Value (US$ Bn) Forecast by Function, 2017-2032
Table 56: Oceania Egg Albumin Protein Market Volume (MT) Forecast by Function, 2017-2032
Table 57: MEA Egg Albumin Protein Market Value (US$ Bn) Forecast by Country, 2017-2032
Table 58: MEA Egg Albumin Protein Market Volume (MT) Forecast by Country, 2017-2032
Table 59: MEA Egg Albumin Protein Market Value (US$ Bn) Forecast by Flavor Type, 2017-2032
Table 60: MEA Egg Albumin Protein Market Volume (MT) Forecast by Flavor Type, 2017-2032
Table 61: MEA Egg Albumin Protein Market Value (US$ Bn) Forecast by End-use Application, 2017-2032
Table 62: MEA Egg Albumin Protein Market Volume (MT) Forecast by End-use Application, 2017-2032
Table 63: MEA Egg Albumin Protein Market Value (US$ Bn) Forecast by Function, 2017-2032
Table 64: MEA Egg Albumin Protein Market Volume (MT) Forecast by Function, 2017-2032
Find your sweet spots for generating winning opportunities in this market.
Talk to AnalystList of Charts
Figure 1: Global Egg Albumin Protein Market Value (US$ Bn) by Flavor Type, 2022-2032
Figure 2: Global Egg Albumin Protein Market Value (US$ Bn) by End-use Application, 2022-2032
Figure 3: Global Egg Albumin Protein Market Value (US$ Bn) by Function, 2022-2032
Figure 4: Global Egg Albumin Protein Market Value (US$ Bn) by Region, 2022-2032
Figure 5: Global Egg Albumin Protein Market Value (US$ Bn) Analysis by Region, 2017-2032
Figure 6: Global Egg Albumin Protein Market Volume (MT) Analysis by Region, 2017-2032
Figure 7: Global Egg Albumin Protein Market Value Share (%) and BPS Analysis by Region, 2022-2032
Figure 8: Global Egg Albumin Protein Market Y-o-Y Growth (%) Projections by Region, 2022-2032
Figure 9: Global Egg Albumin Protein Market Value (US$ Bn) Analysis by Flavor Type, 2017-2032
Figure 10: Global Egg Albumin Protein Market Volume (MT) Analysis by Flavor Type, 2017-2032
Figure 11: Global Egg Albumin Protein Market Value Share (%) and BPS Analysis by Flavor Type, 2022-2032
Figure 12: Global Egg Albumin Protein Market Y-o-Y Growth (%) Projections by Flavor Type, 2022-2032
Figure 13: Global Egg Albumin Protein Market Value (US$ Bn) Analysis by End-use Application, 2017-2032
Figure 14: Global Egg Albumin Protein Market Volume (MT) Analysis by End-use Application, 2017-2032
Figure 15: Global Egg Albumin Protein Market Value Share (%) and BPS Analysis by End-use Application, 2022-2032
Figure 16: Global Egg Albumin Protein Market Y-o-Y Growth (%) Projections by End-use Application, 2022-2032
Figure 17: Global Egg Albumin Protein Market Value (US$ Bn) Analysis by Function, 2017-2032
Figure 18: Global Egg Albumin Protein Market Volume (MT) Analysis by Function, 2017-2032
Figure 19: Global Egg Albumin Protein Market Value Share (%) and BPS Analysis by Function, 2022-2032
Figure 20: Global Egg Albumin Protein Market Y-o-Y Growth (%) Projections by Function, 2022-2032
Figure 21: Global Egg Albumin Protein Market Attractiveness by Flavor Type, 2022-2032
Figure 22: Global Egg Albumin Protein Market Attractiveness by End-use Application, 2022-2032
Figure 23: Global Egg Albumin Protein Market Attractiveness by Function, 2022-2032
Figure 24: Global Egg Albumin Protein Market Attractiveness by Region, 2022-2032
Figure 25: North America Egg Albumin Protein Market Value (US$ Bn) by Flavor Type, 2022-2032
Figure 26: North America Egg Albumin Protein Market Value (US$ Bn) by End-use Application, 2022-2032
Figure 27: North America Egg Albumin Protein Market Value (US$ Bn) by Function, 2022-2032
Figure 28: North America Egg Albumin Protein Market Value (US$ Bn) by Country, 2022-2032
Figure 29: North America Egg Albumin Protein Market Value (US$ Bn) Analysis by Country, 2017-2032
Figure 30: North America Egg Albumin Protein Market Volume (MT) Analysis by Country, 2017-2032
Figure 31: North America Egg Albumin Protein Market Value Share (%) and BPS Analysis by Country, 2022-2032
Figure 32: North America Egg Albumin Protein Market Y-o-Y Growth (%) Projections by Country, 2022-2032
Figure 33: North America Egg Albumin Protein Market Value (US$ Bn) Analysis by Flavor Type, 2017-2032
Figure 34: North America Egg Albumin Protein Market Volume (MT) Analysis by Flavor Type, 2017-2032
Figure 35: North America Egg Albumin Protein Market Value Share (%) and BPS Analysis by Flavor Type, 2022-2032
Figure 36: North America Egg Albumin Protein Market Y-o-Y Growth (%) Projections by Flavor Type, 2022-2032
Figure 37: North America Egg Albumin Protein Market Value (US$ Bn) Analysis by End-use Application, 2017-2032
Figure 38: North America Egg Albumin Protein Market Volume (MT) Analysis by End-use Application, 2017-2032
Figure 39: North America Egg Albumin Protein Market Value Share (%) and BPS Analysis by End-use Application, 2022-2032
Figure 40: North America Egg Albumin Protein Market Y-o-Y Growth (%) Projections by End-use Application, 2022-2032
Figure 41: North America Egg Albumin Protein Market Value (US$ Bn) Analysis by Function, 2017-2032
Figure 42: North America Egg Albumin Protein Market Volume (MT) Analysis by Function, 2017-2032
Figure 43: North America Egg Albumin Protein Market Value Share (%) and BPS Analysis by Function, 2022-2032
Figure 44: North America Egg Albumin Protein Market Y-o-Y Growth (%) Projections by Function, 2022-2032
Figure 45: North America Egg Albumin Protein Market Attractiveness by Flavor Type, 2022-2032
Figure 46: North America Egg Albumin Protein Market Attractiveness by End-use Application, 2022-2032
Figure 47: North America Egg Albumin Protein Market Attractiveness by Function, 2022-2032
Figure 48: North America Egg Albumin Protein Market Attractiveness by Country, 2022-2032
Figure 49: Latin America Egg Albumin Protein Market Value (US$ Bn) by Flavor Type, 2022-2032
Figure 50: Latin America Egg Albumin Protein Market Value (US$ Bn) by End-use Application, 2022-2032
Figure 51: Latin America Egg Albumin Protein Market Value (US$ Bn) by Function, 2022-2032
Figure 52: Latin America Egg Albumin Protein Market Value (US$ Bn) by Country, 2022-2032
Figure 53: Latin America Egg Albumin Protein Market Value (US$ Bn) Analysis by Country, 2017-2032
Figure 54: Latin America Egg Albumin Protein Market Volume (MT) Analysis by Country, 2017-2032
Figure 55: Latin America Egg Albumin Protein Market Value Share (%) and BPS Analysis by Country, 2022-2032
Figure 56: Latin America Egg Albumin Protein Market Y-o-Y Growth (%) Projections by Country, 2022-2032
Figure 57: Latin America Egg Albumin Protein Market Value (US$ Bn) Analysis by Flavor Type, 2017-2032
Figure 58: Latin America Egg Albumin Protein Market Volume (MT) Analysis by Flavor Type, 2017-2032
Figure 59: Latin America Egg Albumin Protein Market Value Share (%) and BPS Analysis by Flavor Type, 2022-2032
Figure 60: Latin America Egg Albumin Protein Market Y-o-Y Growth (%) Projections by Flavor Type, 2022-2032
Figure 61: Latin America Egg Albumin Protein Market Value (US$ Bn) Analysis by End-use Application, 2017-2032
Figure 62: Latin America Egg Albumin Protein Market Volume (MT) Analysis by End-use Application, 2017-2032
Figure 63: Latin America Egg Albumin Protein Market Value Share (%) and BPS Analysis by End-use Application, 2022-2032
Figure 64: Latin America Egg Albumin Protein Market Y-o-Y Growth (%) Projections by End-use Application, 2022-2032
Figure 65: Latin America Egg Albumin Protein Market Value (US$ Bn) Analysis by Function, 2017-2032
Figure 66: Latin America Egg Albumin Protein Market Volume (MT) Analysis by Function, 2017-2032
Figure 67: Latin America Egg Albumin Protein Market Value Share (%) and BPS Analysis by Function, 2022-2032
Figure 68: Latin America Egg Albumin Protein Market Y-o-Y Growth (%) Projections by Function, 2022-2032
Figure 69: Latin America Egg Albumin Protein Market Attractiveness by Flavor Type, 2022-2032
Figure 70: Latin America Egg Albumin Protein Market Attractiveness by End-use Application, 2022-2032
Figure 71: Latin America Egg Albumin Protein Market Attractiveness by Function, 2022-2032
Figure 72: Latin America Egg Albumin Protein Market Attractiveness by Country, 2022-2032
Figure 73: Europe Egg Albumin Protein Market Value (US$ Bn) by Flavor Type, 2022-2032
Figure 74: Europe Egg Albumin Protein Market Value (US$ Bn) by End-use Application, 2022-2032
Figure 75: Europe Egg Albumin Protein Market Value (US$ Bn) by Function, 2022-2032
Figure 76: Europe Egg Albumin Protein Market Value (US$ Bn) by Country, 2022-2032
Figure 77: Europe Egg Albumin Protein Market Value (US$ Bn) Analysis by Country, 2017-2032
Figure 78: Europe Egg Albumin Protein Market Volume (MT) Analysis by Country, 2017-2032
Figure 79: Europe Egg Albumin Protein Market Value Share (%) and BPS Analysis by Country, 2022-2032
Figure 80: Europe Egg Albumin Protein Market Y-o-Y Growth (%) Projections by Country, 2022-2032
Figure 81: Europe Egg Albumin Protein Market Value (US$ Bn) Analysis by Flavor Type, 2017-2032
Figure 82: Europe Egg Albumin Protein Market Volume (MT) Analysis by Flavor Type, 2017-2032
Figure 83: Europe Egg Albumin Protein Market Value Share (%) and BPS Analysis by Flavor Type, 2022-2032
Figure 84: Europe Egg Albumin Protein Market Y-o-Y Growth (%) Projections by Flavor Type, 2022-2032
Figure 85: Europe Egg Albumin Protein Market Value (US$ Bn) Analysis by End-use Application, 2017-2032
Figure 86: Europe Egg Albumin Protein Market Volume (MT) Analysis by End-use Application, 2017-2032
Figure 87: Europe Egg Albumin Protein Market Value Share (%) and BPS Analysis by End-use Application, 2022-2032
Figure 88: Europe Egg Albumin Protein Market Y-o-Y Growth (%) Projections by End-use Application, 2022-2032
Figure 89: Europe Egg Albumin Protein Market Value (US$ Bn) Analysis by Function, 2017-2032
Figure 90: Europe Egg Albumin Protein Market Volume (MT) Analysis by Function, 2017-2032
Figure 91: Europe Egg Albumin Protein Market Value Share (%) and BPS Analysis by Function, 2022-2032
Figure 92: Europe Egg Albumin Protein Market Y-o-Y Growth (%) Projections by Function, 2022-2032
Figure 93: Europe Egg Albumin Protein Market Attractiveness by Flavor Type, 2022-2032
Figure 94: Europe Egg Albumin Protein Market Attractiveness by End-use Application, 2022-2032
Figure 95: Europe Egg Albumin Protein Market Attractiveness by Function, 2022-2032
Figure 96: Europe Egg Albumin Protein Market Attractiveness by Country, 2022-2032
Figure 97: East Asia Egg Albumin Protein Market Value (US$ Bn) by Flavor Type, 2022-2032
Figure 98: East Asia Egg Albumin Protein Market Value (US$ Bn) by End-use Application, 2022-2032
Figure 99: East Asia Egg Albumin Protein Market Value (US$ Bn) by Function, 2022-2032
Figure 100: East Asia Egg Albumin Protein Market Value (US$ Bn) by Country, 2022-2032
Figure 101: East Asia Egg Albumin Protein Market Value (US$ Bn) Analysis by Country, 2017-2032
Figure 102: East Asia Egg Albumin Protein Market Volume (MT) Analysis by Country, 2017-2032
Figure 103: East Asia Egg Albumin Protein Market Value Share (%) and BPS Analysis by Country, 2022-2032
Figure 104: East Asia Egg Albumin Protein Market Y-o-Y Growth (%) Projections by Country, 2022-2032
Figure 105: East Asia Egg Albumin Protein Market Value (US$ Bn) Analysis by Flavor Type, 2017-2032
Figure 106: East Asia Egg Albumin Protein Market Volume (MT) Analysis by Flavor Type, 2017-2032
Figure 107: East Asia Egg Albumin Protein Market Value Share (%) and BPS Analysis by Flavor Type, 2022-2032
Figure 108: East Asia Egg Albumin Protein Market Y-o-Y Growth (%) Projections by Flavor Type, 2022-2032
Figure 109: East Asia Egg Albumin Protein Market Value (US$ Bn) Analysis by End-use Application, 2017-2032
Figure 110: East Asia Egg Albumin Protein Market Volume (MT) Analysis by End-use Application, 2017-2032
Figure 111: East Asia Egg Albumin Protein Market Value Share (%) and BPS Analysis by End-use Application, 2022-2032
Figure 112: East Asia Egg Albumin Protein Market Y-o-Y Growth (%) Projections by End-use Application, 2022-2032
Figure 113: East Asia Egg Albumin Protein Market Value (US$ Bn) Analysis by Function, 2017-2032
Figure 114: East Asia Egg Albumin Protein Market Volume (MT) Analysis by Function, 2017-2032
Figure 115: East Asia Egg Albumin Protein Market Value Share (%) and BPS Analysis by Function, 2022-2032
Figure 116: East Asia Egg Albumin Protein Market Y-o-Y Growth (%) Projections by Function, 2022-2032
Figure 117: East Asia Egg Albumin Protein Market Attractiveness by Flavor Type, 2022-2032
Figure 118: East Asia Egg Albumin Protein Market Attractiveness by End-use Application, 2022-2032
Figure 119: East Asia Egg Albumin Protein Market Attractiveness by Function, 2022-2032
Figure 120: East Asia Egg Albumin Protein Market Attractiveness by Country, 2022-2032
Figure 121: South Asia Egg Albumin Protein Market Value (US$ Bn) by Flavor Type, 2022-2032
Figure 122: South Asia Egg Albumin Protein Market Value (US$ Bn) by End-use Application, 2022-2032
Figure 123: South Asia Egg Albumin Protein Market Value (US$ Bn) by Function, 2022-2032
Figure 124: South Asia Egg Albumin Protein Market Value (US$ Bn) by Country, 2022-2032
Figure 125: South Asia Egg Albumin Protein Market Value (US$ Bn) Analysis by Country, 2017-2032
Figure 126: South Asia Egg Albumin Protein Market Volume (MT) Analysis by Country, 2017-2032
Figure 127: South Asia Egg Albumin Protein Market Value Share (%) and BPS Analysis by Country, 2022-2032
Figure 128: South Asia Egg Albumin Protein Market Y-o-Y Growth (%) Projections by Country, 2022-2032
Figure 129: South Asia Egg Albumin Protein Market Value (US$ Bn) Analysis by Flavor Type, 2017-2032
Figure 130: South Asia Egg Albumin Protein Market Volume (MT) Analysis by Flavor Type, 2017-2032
Figure 131: South Asia Egg Albumin Protein Market Value Share (%) and BPS Analysis by Flavor Type, 2022-2032
Figure 132: South Asia Egg Albumin Protein Market Y-o-Y Growth (%) Projections by Flavor Type, 2022-2032
Figure 133: South Asia Egg Albumin Protein Market Value (US$ Bn) Analysis by End-use Application, 2017-2032
Figure 134: South Asia Egg Albumin Protein Market Volume (MT) Analysis by End-use Application, 2017-2032
Figure 135: South Asia Egg Albumin Protein Market Value Share (%) and BPS Analysis by End-use Application, 2022-2032
Figure 136: South Asia Egg Albumin Protein Market Y-o-Y Growth (%) Projections by End-use Application, 2022-2032
Figure 137: South Asia Egg Albumin Protein Market Value (US$ Bn) Analysis by Function, 2017-2032
Figure 138: South Asia Egg Albumin Protein Market Volume (MT) Analysis by Function, 2017-2032
Figure 139: South Asia Egg Albumin Protein Market Value Share (%) and BPS Analysis by Function, 2022-2032
Figure 140: South Asia Egg Albumin Protein Market Y-o-Y Growth (%) Projections by Function, 2022-2032
Figure 141: South Asia Egg Albumin Protein Market Attractiveness by Flavor Type, 2022-2032
Figure 142: South Asia Egg Albumin Protein Market Attractiveness by End-use Application, 2022-2032
Figure 143: South Asia Egg Albumin Protein Market Attractiveness by Function, 2022-2032
Figure 144: South Asia Egg Albumin Protein Market Attractiveness by Country, 2022-2032
Figure 145: Oceania Egg Albumin Protein Market Value (US$ Bn) by Flavor Type, 2022-2032
Figure 146: Oceania Egg Albumin Protein Market Value (US$ Bn) by End-use Application, 2022-2032
Figure 147: Oceania Egg Albumin Protein Market Value (US$ Bn) by Function, 2022-2032
Figure 148: Oceania Egg Albumin Protein Market Value (US$ Bn) by Country, 2022-2032
Figure 149: Oceania Egg Albumin Protein Market Value (US$ Bn) Analysis by Country, 2017-2032
Figure 150: Oceania Egg Albumin Protein Market Volume (MT) Analysis by Country, 2017-2032
Figure 151: Oceania Egg Albumin Protein Market Value Share (%) and BPS Analysis by Country, 2022-2032
Figure 152: Oceania Egg Albumin Protein Market Y-o-Y Growth (%) Projections by Country, 2022-2032
Figure 153: Oceania Egg Albumin Protein Market Value (US$ Bn) Analysis by Flavor Type, 2017-2032
Figure 154: Oceania Egg Albumin Protein Market Volume (MT) Analysis by Flavor Type, 2017-2032
Figure 155: Oceania Egg Albumin Protein Market Value Share (%) and BPS Analysis by Flavor Type, 2022-2032
Figure 156: Oceania Egg Albumin Protein Market Y-o-Y Growth (%) Projections by Flavor Type, 2022-2032
Figure 157: Oceania Egg Albumin Protein Market Value (US$ Bn) Analysis by End-use Application, 2017-2032
Figure 158: Oceania Egg Albumin Protein Market Volume (MT) Analysis by End-use Application, 2017-2032
Figure 159: Oceania Egg Albumin Protein Market Value Share (%) and BPS Analysis by End-use Application, 2022-2032
Figure 160: Oceania Egg Albumin Protein Market Y-o-Y Growth (%) Projections by End-use Application, 2022-2032
Figure 161: Oceania Egg Albumin Protein Market Value (US$ Bn) Analysis by Function, 2017-2032
Figure 162: Oceania Egg Albumin Protein Market Volume (MT) Analysis by Function, 2017-2032
Figure 163: Oceania Egg Albumin Protein Market Value Share (%) and BPS Analysis by Function, 2022-2032
Figure 164: Oceania Egg Albumin Protein Market Y-o-Y Growth (%) Projections by Function, 2022-2032
Figure 165: Oceania Egg Albumin Protein Market Attractiveness by Flavor Type, 2022-2032
Figure 166: Oceania Egg Albumin Protein Market Attractiveness by End-use Application, 2022-2032
Figure 167: Oceania Egg Albumin Protein Market Attractiveness by Function, 2022-2032
Figure 168: Oceania Egg Albumin Protein Market Attractiveness by Country, 2022-2032
Figure 169: MEA Egg Albumin Protein Market Value (US$ Bn) by Flavor Type, 2022-2032
Figure 170: MEA Egg Albumin Protein Market Value (US$ Bn) by End-use Application, 2022-2032
Figure 171: MEA Egg Albumin Protein Market Value (US$ Bn) by Function, 2022-2032
Figure 172: MEA Egg Albumin Protein Market Value (US$ Bn) by Country, 2022-2032
Figure 173: MEA Egg Albumin Protein Market Value (US$ Bn) Analysis by Country, 2017-2032
Figure 174: MEA Egg Albumin Protein Market Volume (MT) Analysis by Country, 2017-2032
Figure 175: MEA Egg Albumin Protein Market Value Share (%) and BPS Analysis by Country, 2022-2032
Figure 176: MEA Egg Albumin Protein Market Y-o-Y Growth (%) Projections by Country, 2022-2032
Figure 177: MEA Egg Albumin Protein Market Value (US$ Bn) Analysis by Flavor Type, 2017-2032
Figure 178: MEA Egg Albumin Protein Market Volume (MT) Analysis by Flavor Type, 2017-2032
Figure 179: MEA Egg Albumin Protein Market Value Share (%) and BPS Analysis by Flavor Type, 2022-2032
Figure 180: MEA Egg Albumin Protein Market Y-o-Y Growth (%) Projections by Flavor Type, 2022-2032
Figure 181: MEA Egg Albumin Protein Market Value (US$ Bn) Analysis by End-use Application, 2017-2032
Figure 182: MEA Egg Albumin Protein Market Volume (MT) Analysis by End-use Application, 2017-2032
Figure 183: MEA Egg Albumin Protein Market Value Share (%) and BPS Analysis by End-use Application, 2022-2032
Figure 184: MEA Egg Albumin Protein Market Y-o-Y Growth (%) Projections by End-use Application, 2022-2032
Figure 185: MEA Egg Albumin Protein Market Value (US$ Bn) Analysis by Function, 2017-2032
Figure 186: MEA Egg Albumin Protein Market Volume (MT) Analysis by Function, 2017-2032
Figure 187: MEA Egg Albumin Protein Market Value Share (%) and BPS Analysis by Function, 2022-2032
Figure 188: MEA Egg Albumin Protein Market Y-o-Y Growth (%) Projections by Function, 2022-2032
Figure 189: MEA Egg Albumin Protein Market Attractiveness by Flavor Type, 2022-2032
Figure 190: MEA Egg Albumin Protein Market Attractiveness by End-use Application, 2022-2032
Figure 191: MEA Egg Albumin Protein Market Attractiveness by Function, 2022-2032
Figure 192: MEA Egg Albumin Protein Market Attractiveness by Country, 2022-2032
Need specific information?
Request CustomizationExplore Food and Beverage Insights
View Reports