Egg Replacement Ingredients Market
Growing Adoption of Dairy Proteins and Egg Replacement Ingredients in the Bakery Industry to Stir-up the Market Dynamics. Here’s More.
Egg Replacement Ingredients Market By Form, Ingredient, Application, Distribution Channel & Region - Forecast 2022-2032
Egg Replacement Ingredients Market Outlook (2022-2032)
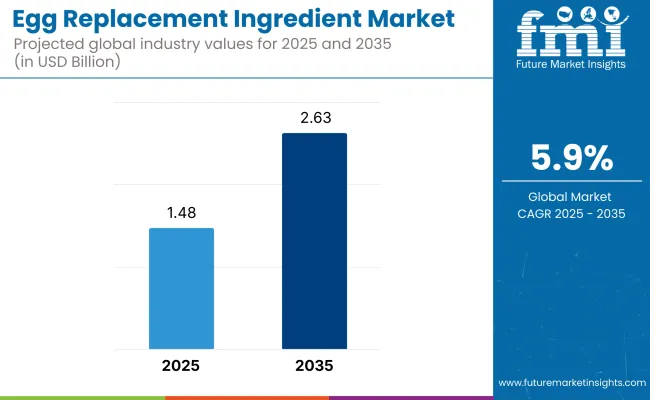
[324 Pages Report] The global egg replacement ingredients market is projected to have a moderate-paced CAGR of 5.8% during the forecast period. The current valuation of the market is US$ 1,228.36 million in 2022. The market value of the egg replacement ingredients market is anticipated to reach a high of US$ 2,138.33 million by the year 2032. A historical CAGR of 3.4% has been recorded as per the statistics in the base year by expert analysts at Future Market Insights.
Report Attribute |
Details |
Egg Replacement Ingredients Market Value (2022) |
US$ 1,228.36 Million |
Egg Replacement Ingredients Market Anticipated Value (2032) |
US$ 2,138.33 Million |
Egg Replacement Ingredients Projected Growth Rate (2022-2032) |
5.8% |
The egg replacement ingredients market has witnessed an unprecedented surge over the past few years owing to the rising egg prices and the inkling focus of consumers on preventive healthcare. It is anticipated to gain rapid traction during the estimated period of study, mainly owing to the fact that the egg replacement ingredients in the food are not affecting the taste and final appearance of the products manufactured using egg substitutes.
The market share of vegan egg replacement ingredients is projected to rise by the expert analysts at FMI due o the widespread use of egg replacement ingredients in products such as ice cream, cakes, mayonnaise, chocolates, and other baked goods. The sale of egg replacement ingredients is therefore projected to increase at a steady pace, attributed to a plethora of usages like egg replacements for baking, egg replacements for cookies, egg replacements for pancakes, and more.
Therefore, the egg replacement ingredients market is likely to witness significant growth during the forecast period.
Let us know your requirement to get
100% FREE customization
A Contrast with the Historical Market Scenario
The market size of egg replacement ingredients has gradually witnessed an increase in recent years. There is a considerable rise in the growth rate of the market, from a CAGR of 3.4% during the period 2017-2021 to a CAGR of 5.8% during the current year.
This incredible rise in share can be attributed to the factor that egg replacement ingredients are a commercial alternative to eggs and is gaining prominence due to their incredible properties like being gluten-free, high nutritional value, cholesterol-free, high vitamin content, and more.
Furthermore, egg replacement ingredients are having an upsurge in demand due to the increasing preference of consumers for vegan processed food products. This is a crucial factor fuelling the demand for ingredients like vegan egg substitutes. In addition to that, it is expected that the adoption of low-cholesterol and low-fat products like tofu, banana, yogurt, and others by consumers will drive the concerned market during the foreseeable years.
Comparative Analysis of Adjacent Markets
Egg Replacement Ingredients Market:
Differentiating Aspects |
Egg Replacement Ingredients Market |
CAGR in 2022-2032 |
5.8% |
Current Valuation in 2022 |
US$ 1,228.36 Million |
Projected Valuation in 2032 |
US$ 2,138.33 Million |
Demand Drivers |
Increasing consumer preference for vegan processed food products to fuel market growth. The medical fraternity is a key proponent of healthy ingredients fueling the adoption of the egg replacement ingredients market. |
Silken Tofu Market:
Differentiating Aspects |
Silken Tofu Market |
CAGR in 2022-2032 |
6.3% |
Current Valuation in 2022 |
US$ 1,378.22 Million |
Projected Valuation in 2032 |
US$ 2,538.94 Million |
Demand Drivers |
Easy availability of silken tofu in convenient stores is a factor propelling the consumption of tofu as an egg replacement. Increasing demand for a healthy source of protein alternatives to boost demand in the silken tofu market. |
Commercial Egg Replacer Market:
Differentiating Aspects |
Commercial Egg Replacer Market |
CAGR in 2022-2032 |
5.4% |
Current Valuation in 2022 |
US$ 1.3 Billion |
Projected Valuation in 2032 |
US$ 1.5 Billion |
Demand Drivers |
Consumer health awareness is a key demand driver for commercial egg replacers. The rising number of celiac patients has boosted the popularity of gluten-free items, thereby expanding the market size for commercial egg replacers. |
Find your sweet spots for generating winning opportunities in this market.
Talk to AnalystAnalyzing the Market Dynamics In-Depth: Key Propellants and Deterrents
While performing the analysis of the egg replacement ingredients market, the experts at Future Market Insights have identified that there are several factors responsible for propelling the expansion of the forum and are likely to have a positive impact in the long run.
Besides the identification of the key demand drivers, the experts have also stated that some of the aspects are expected to influence the market negatively and inhibit the growth of the egg replacement ingredients market during the forecast period.
Let’s take a stroll across the key factors jigging up the egg replacement ingredients forum:
DRIVERS |
The elements driving the demand for egg replacement ingredients are:
|
RESTRAINTS |
The key elements likely to deter the expansion of the egg replacement ingredients market are:
|
Category-wise Insights
Domineering Segments in the Egg Replacement Ingredients Market
Mayonnaise – By Product Type
Mayonnaise is poised to stay ahead of the curve in terms of revenue in the egg replacement ingredients market as compared to other product types such as chocolates, muffins, pastries, and more.
The mayonnaise segment is estimated to account for a value share of 38.2% during the forecast period. The reasons behind the rising rate of mayonnaise can be attributed to:
- Increase in the trend of café culture, which is offering a diverse range of food that uses mayonnaise as a key ingredient.
- Inclining consumer taste preference and popularity of luxury foods is an integral aspect of driving sales across the global market.
Commercial Segment – By End-use
The commercial segment is anticipated to exhibit growth at a rapid pace during the forecast period. As per the analysis of Future Market Insights, this segment will remain dominant and account for 79.7% value share in the global egg replacement ingredients market.
The factors attributing to such domineering share for the commercial segment can be attributed to:
- The health-savvy population is evolving globally who highly prefer functional foods with natural ingredients.
- Several departmental stores and outlets have begun selling eggless replacement ingredients and are leveraging the power of e-commerce to drive sales.
Other Segments |
Cakes/Pastries/Muffins/Bread Segment |
Category |
By Product Type |
Market Statistics |
26% Value Share |
Other Segments |
Powder Segment |
Category |
By Form |
Market Statistics | Market Valuation of US$ 815.4 Million |

A unified Market Research Subscription Platform, built for today's disparate research needs.
Regional Outlook
Growth Outlook of North America Egg Replacement Ingredients Market
North America is projected to dominate the global egg replacement ingredients market. As per the analysis of FMI, this region is likely to account for a market share of 47.8% during the forecast period, growing at a pace of 7% CAGR.
The U.S. is projected to hold a lucrative pocket through 2032. The reasons that are majorly contributing to the expansion of the egg replacement ingredients market in this region are:
- Surging demand for plant-based ingredients from the food and beverage sector in the U.S.
- The presence of a technologically proficient food processing sector and the adoption of an interpersonal diet in the country drive market growth.
- Huge losses in the wake of a highly pathogenic strain of avian influenza have persuaded producers to cull millions of chickens, thereby making pockets for the adoption of egg replacement ingredients.
How are Egg Replacement Ingredients Gaining Traction in the Europe Market?
Europe is projected to have the second-largest revenue share in the global egg replacement ingredients market after North America. As per the statistics revealed while analyzing the forum, the expert analysts at FMI have identified that this region is estimated to advance at a moderate-paced CAGR of 6.5% during the forecast period.
The U.K is anticipated to slate a substantial share. The factors attributing to the market size expansion in this region are as follows:
- There is rising consumption of non-dry diets and growing interest in consumers in nutritional diets.
- The high demand for low-calorie and low-fat food is significantly influencing the need for the egg replacement ingredients market in Europe.
Start-Up Ecosystem
New Entrants Stirring Up the Market-o-nomics
The emerging companies are on the lookout for egg substitutes to include in various products, which is foreseen to bode well for the egg replacement ingredients market. They are using strategies like:
- Cutting down on recipe costs by using the substitute for eggs, thereby slating an expansion for egg replacement ingredients.
- They are appealing to the growing fad of popular functional foods made of natural ingredients with rigorous innovations to existing replacement ingredients.
- They are indulging in research and development activities to offer new product lines to the consumers and the end-use industry to further strengthen their foothold in the global egg replacement ingredients market.
Top Start-Ups to Watch For
Start-Up |
Perfeggt |
Base Country & Founding Year |
Berlin-based Start-up |
Description |
Perfeggt’s egg alternative is formulated with fava bean protein and may be fried in a pan like an omelet or scrambled eggs, according to the company. They have laser-focused on matching the right plant-based proteins and lipids that allow us to replicate the exceedingly complex multifunctional and versatile characteristics of an egg and its indistinguishable taste. |
Start-Up |
Oggs |
Base Country & Founding Year |
U.K.-based Start-up |
Description |
This start-up has recently launched the world’s first patented liquid vegan egg alternative called Oggs Aquafaba, the product contains just aquafaba – aka chickpea water. As it can whip and whisk just like real eggs, it can be used to replace eggs in baking recipes, especially those that call for egg whites. Since its first product launch in July this year across Waitrose supermarkets in the U.K., the start-up says it has already saved 28,676 eggs. Oggs will also be launching its product in Asda and Sainsbury’s in the country in the coming months. |
Start-Up |
Les Merveilloeufs |
Base Country & Founding Year |
France-based Start-up |
Description |
This firm’s exact ingredients list remains a secret, the startup’s vegan egg alternative contains legumes as its base. It comes in a shell, and once cracked, it looks exactly like a real egg with its distinctive egg and yolk separation. Looking ahead, Les Merveilloeufs wants to make its product available directly to consumers, in France, and in overseas markets as well. |
Competitive Landscape
Biggies Revolutionizing the Market
The global eggless replacement ingredients market is slated to expand at a stellar pace in the times to follow. The vendors operating in the global egg replacement ingredients market cater to an extremely niche market. This factor contracts the market share of the companies and prompts them to resort to subsidiary means of revenue generation.
Despite this, the growth index of the leading vendors in the global egg replacement ingredients market is improving. The market players are following a staggered approach in targeting multiple domains within the food industry. Starting with eggless baking ingredients, these vendors have captured several other sub-domains of the food industry.
Recent Developments
- In July 2021, Canadian food tech company Nabati Foods announced the launch of the “First Canadian-made plant-based eggs substitute”. The liquid egg substitute will be sold under the name Nabati Plant Eggz and is free of soy, gluten, and cholesterol. It is also high in fiber, protein, and vitamins, including vitamin B12.
- In January 2020, Noblegen launched its first consumer product, a plant-based whole egg powder named “the egg.” It is vegan-friendly, free from cholesterol, and provides protein equivalent to a traditional egg but low calories.
- In July 2021, Japanese food tech Next Meats expanded its alternative protein range with a new egg substitute named Next Egg 1.0. The 100% vegan egg alternative will soon be landing in Japan through B2B channels.
Some of the key companies proliferating in the market are
- Glanbia Plc.
- Kerry Group
- Archer Daniels Midland Company
- Ingredion Incorporated
- DuPont Nutrition & Health
- Cargill Incorporated
Key Segments in the Egg Replacement Ingredients Market
By Form:
- Dry
- Liquid
By Ingredient:
- Dairy Proteins
- Starch
- Algal Flour
- Soy-based Products
By Application:
- Bakery & Confectionery
- Savories
- Sauces
- Dressings & Spreads
By Distribution Channel:
- Convenience Stores
- Hypermarkets
- Departmental Stores
- Others
By Region:
- North America
- Latin America
- Asia Pacific
- MEA
- Europe
Frequently Asked Questions
The growth outlook for the egg replacement ingredients market is predicted to advance at a CAGR of 5.8% from 2022 to 2032.
The North American region is anticipated to lead the egg replacement ingredients market during the forecast period.
The market valuation of the egg replacement ingredients market stands at US$ 1,228.36 Million in 2022.
The egg replacement ingredients market is likely to hold a valuation of US$ 2,138.33 Million by 2032.
The global egg replacement ingredients market grew at a 3.4% CAGR between the years 2017-2021.
Table of Content
1. Executive Summary
1.1. Global Market Outlook
1.2. Demand-side Trends
1.3. Supply-side Trends
1.4. Technology Roadmap Analysis
1.5. Analysis and Recommendations
2. Market Overview
2.1. Market Coverage / Taxonomy
2.2. Market Definition / Scope / Limitations
3. Market Background
3.1. Market Dynamics
3.1.1. Drivers
3.1.2. Restraints
3.1.3. Opportunity
3.1.4. Trends
3.2. Scenario Forecast
3.2.1. Demand in Optimistic Scenario
3.2.2. Demand in Likely Scenario
3.2.3. Demand in Conservative Scenario
3.3. Product launches & Recent Developments
3.4. Product Life Cycle Analysis
3.5. Value Chain Analysis
3.5.1. Supply Side Participants and their Roles
3.5.1.1. Producers
3.5.1.2. Mid-Level Participants (Traders/ Agents/ Brokers)
3.5.1.3. Wholesalers and Distributors
3.5.2. % of Operating Margin Analysis
3.5.3. List of Raw Material Suppliers
3.5.4. List of Existing and Potential Buyer’s
3.6. Global Egg Replacement Ingredients Market - Pricing Analysis
3.6.1. Price Point Assessment by Region
3.6.2. Price Point Assessment by Product Type
3.6.3. Price Forecast till 2032
3.6.4. Factors affecting Pricing
3.7. Forecast Factors - Relevance & Impact
3.8. PESTLE and Porter’s Analysis
3.9. Regulatory Landscape
3.9.1. Packaging & Labelling Regulations
3.9.2. Certifications and Certifying Agency Overview
3.9.3. Import/Export Policies
3.10. Regional Parent Market Outlook
3.11. Consumers Survey Analysis
3.12. Macro-Economic Factors
3.13. Product Claims & Nutritional Information Scan by Buyers
4. Global Egg Replacement Ingredients Market Analysis 2017-2021 and Forecast, 2022-2032
4.1. Historical Market Size Value (US$ Mn) & Volume (MT) Analysis, 2017-2021
4.2. Current and Future Market Size Value (US$ Mn) & Volume (MT) Projections, 2022-2032
4.2.1. Y-o-Y Growth Trend Analysis
4.2.2. Absolute $ Opportunity Analysis
5. Global Egg Replacement Ingredients Market Analysis 2017-2021 and Forecast 2022-2032, By Ingredient
5.1. Introduction / Key Findings
5.2. Historical Market Size Value (US$ Mn) & Volume (MT) Analysis By Ingredient, 2017-2021
5.3. Current and Future Market Size Value (US$ Mn) & Volume (MT) Analysis and Forecast By Ingredient, 2022-2032
5.3.1. Milk Protein Formulation
5.3.2. Algal Flour
5.3.3. Proteins
5.3.4. Soy Products (Lecithin, Tofu & Tahini)
5.3.5. Others (Fruit Purees & Vinegar)
5.4. Y-o-Y Growth Trend Analysis By Ingredient, 2017-2021
5.5. Absolute $ Opportunity Analysis By Ingredient, 2022-2032
6. Global Egg Replacement Ingredients Market Analysis 2017-2021 and Forecast 2022-2032, By Form
6.1. Introduction / Key Findings
6.2. Historical Market Size Value (US$ Mn) & Volume (MT) Analysis By Form, 2017-2021
6.3. Current and Future Market Size Value (US$ Mn) & Volume (MT) Analysis and Forecast By Form, 2022-2032
6.3.1. Liquid
6.3.2. Powder
6.4. Y-o-Y Growth Trend Analysis By Form, 2017-2021
6.5. Absolute $ Opportunity Analysis By Form, 2022-2032
7. Global Egg Replacement Ingredients Market Analysis 2017-2021 and Forecast 2022-2032, By Application
7.1. Introduction / Key Findings
7.2. Historical Market Size Value (US$ Mn) & Volume (MT) Analysis By Application, 2017-2021
7.3. Current and Future Market Size Value (US$ Mn) & Volume (MT) Analysis and Forecast By Application, 2022-2032
7.3.1. Bakery Products
7.3.2. Confectionary Products
7.4. Y-o-Y Growth Trend Analysis By Application, 2017-2021
7.5. Absolute $ Opportunity Analysis By Application, 2022-2032
8. Global Egg Replacement Ingredients Market Analysis 2017-2021 and Forecast 2022-2032, By Region
8.1. Introduction
8.2. Historical Market Size Value (US$ Mn) & Volume (MT) Analysis By Region, 2017-2021
8.3. Current Market Size Value (US$ Mn) & Volume (MT) Analysis and Forecast By Region, 2022-2032
8.3.1. North America
8.3.2. Latin America
8.3.3. Europe
8.3.4. East Asia
8.3.5. South Asia
8.3.6. Oceania
8.3.7. MEA
8.4. Market Attractiveness Analysis By Region
9. North America Egg Replacement Ingredients Market Analysis 2017-2021 and Forecast 2022-2032, By Country
9.1. Historical Market Size Value (US$ Mn) & Volume (MT) Trend Analysis By Market Taxonomy, 2017-2021
9.2. Market Size Value (US$ Mn) & Volume (MT) Forecast By Market Taxonomy, 2022-2032
9.2.1. By Country
9.2.1.1. U.S.
9.2.1.2. Canada
9.2.2. By Ingredient
9.2.3. By Form
9.2.4. By Application
9.3. Market Attractiveness Analysis
9.3.1. By Country
9.3.2. By Ingredient
9.3.3. By Form
9.3.4. By Application
9.4. Key Takeaways
10. Latin America Egg Replacement Ingredients Market Analysis 2017-2021 and Forecast 2022-2032, By Country
10.1. Historical Market Size Value (US$ Mn) & Volume (MT) Trend Analysis By Market Taxonomy, 2017-2021
10.2. Market Size Value (US$ Mn) & Volume (MT) Forecast By Market Taxonomy, 2022-2032
10.2.1. By Country
10.2.1.1. Brazil
10.2.1.2. Mexico
10.2.1.3. Argentina
10.2.1.4. Chile
10.2.1.5. Peru
10.2.1.6. Rest of Latin America
10.2.2. By Ingredient
10.2.3. By Form
10.2.4. By Application
10.3. Market Attractiveness Analysis
10.3.1. By Country
10.3.2. By Ingredient
10.3.3. By Form
10.3.4. By Application
10.4. Key Takeaways
11. Europe Egg Replacement Ingredients Market Analysis 2017-2021 and Forecast 2022-2032, By Country
11.1. Historical Market Size Value (US$ Mn) & Volume (MT) Trend Analysis By Market Taxonomy, 2017-2021
11.2. Market Size Value (US$ Mn) & Volume (MT) Forecast By Market Taxonomy, 2022-2032
11.2.1. By Country
11.2.1.1. Germany
11.2.1.2. Italy
11.2.1.3. France
11.2.1.4. U.K.
11.2.1.5. Spain
11.2.1.6. Russia
11.2.1.7. BENELUX
11.2.1.8. Poland
11.2.1.9. Nordic Countries
11.2.1.10. Rest of Europe
11.2.2. By Ingredient
11.2.3. By Form
11.2.4. By Application
11.3. Market Attractiveness Analysis
11.3.1. By Country
11.3.2. By Ingredient
11.3.3. By Form
11.3.4. By Application
11.4. Key Takeaways
12. East Asia Egg Replacement Ingredients Market Analysis 2017-2021 and Forecast 2022-2032, By Country
12.1. Historical Market Size Value (US$ Mn) & Volume (MT) Trend Analysis By Market Taxonomy, 2017-2021
12.2. Market Size Value (US$ Mn) & Volume (MT) Forecast By Market Taxonomy, 2022-2032
12.2.1. By Country
12.2.1.1. China
12.2.1.2. Japan
12.2.1.3. South Korea
12.2.2. By Ingredient
12.2.3. By Form
12.2.4. By Application
12.3. Market Attractiveness Analysis
12.3.1. By Country
12.3.2. By Ingredient
12.3.3. By Form
12.3.4. By Application
12.4. Key Takeaways
13. South Asia Egg Replacement Ingredients Market Analysis 2017-2021 and Forecast 2022-2032, By Country
13.1. Historical Market Size Value (US$ Mn) & Volume (MT) Trend Analysis By Market Taxonomy, 2017-2021
13.2. Market Size Value (US$ Mn) & Volume (MT) Forecast By Market Taxonomy, 2022-2032
13.2.1. By Country
13.2.1.1. India
13.2.1.2. Thailand
13.2.1.3. Malaysia
13.2.1.4. Indonesia
13.2.1.5. Rest of South Asia
13.2.2. By Ingredient
13.2.3. By Form
13.2.4. By Application
13.3. Market Attractiveness Analysis
13.3.1. By Country
13.3.2. By Ingredient
13.3.3. By Form
13.3.4. By Application
13.4. Key Takeaways
14. Oceania Egg Replacement Ingredients Market Analysis 2017-2021 and Forecast 2022-2032, By Country
14.1. Historical Market Size Value (US$ Mn) & Volume (MT) Trend Analysis By Market Taxonomy, 2017-2021
14.2. Market Size Value (US$ Mn) & Volume (MT) Forecast By Market Taxonomy, 2022-2032
14.2.1. By Country
14.2.1.1. Australia
14.2.1.2. New Zealand
14.2.2. By Ingredient
14.2.3. By Form
14.2.4. By Application
14.3. Market Attractiveness Analysis
14.3.1. By Country
14.3.2. By Ingredient
14.3.3. By Form
14.3.4. By Application
14.4. Key Takeaways
15. MEA Egg Replacement Ingredients Market Analysis 2017-2021 and Forecast 2022-2032, By Country
15.1. Historical Market Size Value (US$ Mn) & Volume (MT) Trend Analysis By Market Taxonomy, 2017-2021
15.2. Market Size Value (US$ Mn) & Volume (MT) Forecast By Market Taxonomy, 2022-2032
15.2.1. By Country
15.2.1.1. GCC Countries
15.2.1.2. South Africa
15.2.1.3. Central Africa
15.2.1.4. North Africa
15.2.2. By Ingredient
15.2.3. By Form
15.2.4. By Application
15.3. Market Attractiveness Analysis
15.3.1. By Country
15.3.2. By Ingredient
15.3.3. By Form
15.3.4. By Application
15.4. Key Takeaways
16. Key Countries Egg Replacement Ingredients Market Analysis
16.1. U.S.
16.1.1. Pricing Analysis
16.1.2. Market Share Analysis, 2021
16.1.2.1. By Ingredient
16.1.2.2. By Form
16.1.2.3. By Application
16.2. Canada
16.2.1. Pricing Analysis
16.2.2. Market Share Analysis, 2021
16.2.2.1. By Ingredient
16.2.2.2. By Form
16.2.2.3. By Application
16.3. Brazil
16.3.1. Pricing Analysis
16.3.2. Market Share Analysis, 2021
16.3.2.1. By Ingredient
16.3.2.2. By Form
16.3.2.3. By Application
16.4. Mexico
16.4.1. Pricing Analysis
16.4.2. Market Share Analysis, 2021
16.4.2.1. By Ingredient
16.4.2.2. By Form
16.4.2.3. By Application
16.5. Argentina
16.5.1. Pricing Analysis
16.5.2. Market Share Analysis, 2021
16.5.2.1. By Ingredient
16.5.2.2. By Form
16.5.2.3. By Application
16.6. Chile
16.6.1. Pricing Analysis
16.6.2. Market Share Analysis, 2021
16.6.2.1. By Ingredient
16.6.2.2. By Form
16.6.2.3. By Application
16.7. Peru
16.7.1. Pricing Analysis
16.7.2. Market Share Analysis, 2021
16.7.2.1. By Ingredient
16.7.2.2. By Form
16.7.2.3. By Application
16.8. Germany
16.8.1. Pricing Analysis
16.8.2. Market Share Analysis, 2021
16.8.2.1. By Ingredient
16.8.2.2. By Form
16.8.2.3. By Application
16.9. Italy
16.9.1. Pricing Analysis
16.9.2. Market Share Analysis, 2021
16.9.2.1. By Ingredient
16.9.2.2. By Form
16.9.2.3. By Application
16.10. France
16.10.1. Pricing Analysis
16.10.2. Market Share Analysis, 2021
16.10.2.1. By Ingredient
16.10.2.2. By Form
16.10.2.3. By Application
16.11. Spain
16.11.1. Pricing Analysis
16.11.2. Market Share Analysis, 2021
16.11.2.1. By Ingredient
16.11.2.2. By Form
16.11.2.3. By Application
16.12. U.K.
16.12.1. Pricing Analysis
16.12.2. Market Share Analysis, 2021
16.12.2.1. By Ingredient
16.12.2.2. By Form
16.12.2.3. By Application
16.13. Russia
16.13.1. Pricing Analysis
16.13.2. Market Share Analysis, 2021
16.13.2.1. By Ingredient
16.13.2.2. By Form
16.13.2.3. By Application
16.14. Poland
16.14.1. Pricing Analysis
16.14.2. Market Share Analysis, 2021
16.14.2.1. By Ingredient
16.14.2.2. By Form
16.14.2.3. By Application
16.15. BENELUX
16.15.1. Pricing Analysis
16.15.2. Market Share Analysis, 2021
16.15.2.1. By Ingredient
16.15.2.2. By Form
16.15.2.3. By Application
16.16. Nordic Countries
16.16.1. Pricing Analysis
16.16.2. Market Share Analysis, 2021
16.16.2.1. By Ingredient
16.16.2.2. By Form
16.16.2.3. By Application
16.17. China
16.17.1. Pricing Analysis
16.17.2. Market Share Analysis, 2021
16.17.2.1. By Ingredient
16.17.2.2. By Form
16.17.2.3. By Application
16.18. Japan
16.18.1. Pricing Analysis
16.18.2. Market Share Analysis, 2021
16.18.2.1. By Ingredient
16.18.2.2. By Form
16.18.2.3. By Application
16.19. South Korea
16.19.1. Pricing Analysis
16.19.2. Market Share Analysis, 2021
16.19.2.1. By Ingredient
16.19.2.2. By Form
16.19.2.3. By Application
16.20. India
16.20.1. Pricing Analysis
16.20.2. Market Share Analysis, 2021
16.20.2.1. By Ingredient
16.20.2.2. By Form
16.20.2.3. By Application
16.21. Thailand
16.21.1. Pricing Analysis
16.21.2. Market Share Analysis, 2021
16.21.2.1. By Ingredient
16.21.2.2. By Form
16.21.2.3. By Application
16.22. Indonesia
16.22.1. Pricing Analysis
16.22.2. Market Share Analysis, 2021
16.22.2.1. By Ingredient
16.22.2.2. By Form
16.22.2.3. By Application
16.23. Malaysia
16.23.1. Pricing Analysis
16.23.2. Market Share Analysis, 2021
16.23.2.1. By Ingredient
16.23.2.2. By Form
16.23.2.3. By Application
16.24. Singapore
16.24.1. Pricing Analysis
16.24.2. Market Share Analysis, 2021
16.24.2.1. By Ingredient
16.24.2.2. By Form
16.24.2.3. By Application
16.25. GCC Countries
16.25.1. Pricing Analysis
16.25.2. Market Share Analysis, 2021
16.25.2.1. By Ingredient
16.25.2.2. By Form
16.25.2.3. By Application
16.26. South Africa
16.26.1. Pricing Analysis
16.26.2. Market Share Analysis, 2021
16.26.2.1. By Ingredient
16.26.2.2. By Form
16.26.2.3. By Application
16.27. Central Africa
16.27.1. Pricing Analysis
16.27.2. Market Share Analysis, 2021
16.27.2.1. By Ingredient
16.27.2.2. By Form
16.27.2.3. By Application
16.28. North Africa
16.28.1. Pricing Analysis
16.28.2. Market Share Analysis, 2021
16.28.2.1. By Ingredient
16.28.2.2. By Form
16.28.2.3. By Application
17. Market Structure Analysis
17.1. Competition Dashboard
17.2. Competition Benchmarking
17.3. Market Share Analysis of Top Players
17.3.1. By Regional
17.3.2. By Ingredient
17.3.3. By Form
17.3.4. By Application
18. Competition Analysis
18.1. Competition Deep Dive
18.1.1. Arla Foods amba
18.1.1.1. Overview
18.1.1.2. Product Portfolio
18.1.1.3. Profitability by Market Segments (Product/Age /Sales Channel/Region)
18.1.1.4. Sales Footprint
18.1.1.5. Strategy Overview
18.1.1.5.1. Marketing Strategy
18.1.1.5.2. Product Strategy
18.1.1.5.3. Channel Strategy
18.1.2. Archer Daniels Midland Company
18.1.2.1. Overview
18.1.2.2. Product Portfolio
18.1.2.3. Profitability by Market Segments (Product/Age /Sales Channel/Region)
18.1.2.4. Sales Footprint
18.1.2.5. Strategy Overview
18.1.2.5.1. Marketing Strategy
18.1.2.5.2. Product Strategy
18.1.2.5.3. Channel Strategy
18.1.3. Corbion group
18.1.3.1. Overview
18.1.3.2. Product Portfolio
18.1.3.3. Profitability by Market Segments (Product/Age /Sales Channel/Region)
18.1.3.4. Sales Footprint
18.1.3.5. Strategy Overview
18.1.3.5.1. Marketing Strategy
18.1.3.5.2. Product Strategy
18.1.3.5.3. Channel Strategy
18.1.4. Glanbia plc
18.1.4.1. Overview
18.1.4.2. Product Portfolio
18.1.4.3. Profitability by Market Segments (Product/Age /Sales Channel/Region)
18.1.4.4. Sales Footprint
18.1.4.5. Strategy Overview
18.1.4.5.1. Marketing Strategy
18.1.4.5.2. Product Strategy
18.1.4.5.3. Channel Strategy
18.1.5. Fiberstar, Ingredion group of companies
18.1.5.1. Overview
18.1.5.2. Product Portfolio
18.1.5.3. Profitability by Market Segments (Product/Age /Sales Channel/Region)
18.1.5.4. Sales Footprint
18.1.5.5. Strategy Overview
18.1.5.5.1. Marketing Strategy
18.1.5.5.2. Product Strategy
18.1.5.5.3. Channel Strategy
18.1.6. Florida Food Products, Cargill
18.1.6.1. Overview
18.1.6.2. Product Portfolio
18.1.6.3. Profitability by Market Segments (Product/Age /Sales Channel/Region)
18.1.6.4. Sales Footprint
18.1.6.5. Strategy Overview
18.1.6.5.1. Marketing Strategy
18.1.6.5.2. Product Strategy
18.1.6.5.3. Channel Strategy
18.1.7. Tate & Lyle
18.1.7.1. Overview
18.1.7.2. Product Portfolio
18.1.7.3. Profitability by Market Segments (Product/Age /Sales Channel/Region)
18.1.7.4. Sales Footprint
18.1.7.5. Strategy Overview
18.1.7.5.1. Marketing Strategy
18.1.7.5.2. Product Strategy
18.1.7.5.3. Channel Strategy
18.1.8. Ener-G foods
18.1.8.1. Overview
18.1.8.2. Product Portfolio
18.1.8.3. Profitability by Market Segments (Product/Age /Sales Channel/Region)
18.1.8.4. Sales Footprint
18.1.8.5. Strategy Overview
18.1.8.5.1. Marketing Strategy
18.1.8.5.2. Product Strategy
18.1.8.5.3. Channel Strategy
18.1.9. Puratos
18.1.9.1. Overview
18.1.9.2. Product Portfolio
18.1.9.3. Profitability by Market Segments (Product/Age /Sales Channel/Region)
18.1.9.4. Sales Footprint
18.1.9.5. Strategy Overview
18.1.9.5.1. Marketing Strategy
18.1.9.5.2. Product Strategy
18.1.9.5.3. Channel Strategy
18.1.10. Ingredion Inc.
18.1.10.1. Overview
18.1.10.2. Product Portfolio
18.1.10.3. Profitability by Market Segments (Product/Age /Sales Channel/Region)
18.1.10.4. Sales Footprint
18.1.10.5. Strategy Overview
18.1.10.5.1. Marketing Strategy
18.1.10.5.2. Product Strategy
18.1.10.5.3. Channel Strategy
18.1.11. Natural Product Inc.
18.1.11.1. Overview
18.1.11.2. Product Portfolio
18.1.11.3. Profitability by Market Segments (Product/Age /Sales Channel/Region)
18.1.11.4. Sales Footprint
18.1.11.5. Strategy Overview
18.1.11.5.1. Marketing Strategy
18.1.11.5.2. Product Strategy
18.1.11.5.3. Channel Strategy
18.1.12. Orchard Valley Foods Limited
18.1.12.1. Overview
18.1.12.2. Product Portfolio
18.1.12.3. Profitability by Market Segments (Product/Age /Sales Channel/Region)
18.1.12.4. Sales Footprint
18.1.12.5. Strategy Overview
18.1.12.5.1. Marketing Strategy
18.1.12.5.2. Product Strategy
18.1.12.5.3. Channel Strategy
18.1.13. TerraVia Holdings, Inc.
18.1.13.1. Overview
18.1.13.2. Product Portfolio
18.1.13.3. Profitability by Market Segments (Product/Age /Sales Channel/Region)
18.1.13.4. Sales Footprint
18.1.13.5. Strategy Overview
18.1.13.5.1. Marketing Strategy
18.1.13.5.2. Product Strategy
18.1.13.5.3. Channel Strategy
18.1.14. Ener-G foods
18.1.14.1. Overview
18.1.14.2. Product Portfolio
18.1.14.3. Profitability by Market Segments (Product/Age /Sales Channel/Region)
18.1.14.4. Sales Footprint
18.1.14.5. Strategy Overview
18.1.14.5.1. Marketing Strategy
18.1.14.5.2. Product Strategy
18.1.14.5.3. Channel Strategy
18.1.15. Florida Food Products
18.1.15.1. Overview
18.1.15.2. Product Portfolio
18.1.15.3. Profitability by Market Segments (Product/Age /Sales Channel/Region)
18.1.15.4. Sales Footprint
18.1.15.5. Strategy Overview
18.1.15.5.1. Marketing Strategy
18.1.15.5.2. Product Strategy
18.1.15.5.3. Channel Strategy
18.1.16. Others (on Additional Request)
19. Assumptions & Acronyms Used
20. Research Methodology
Let us know your requirement to get
100% FREE customization
List of Tables
Table 1: Global Egg Replacement Ingredients Market Value (US$ Mn) Forecast by Region, 2017-2032
Table 2: Global Egg Replacement Ingredients Market Volume (MT) Forecast by Region, 2017-2032
Table 3: Global Egg Replacement Ingredients Market Value (US$ Mn) Forecast by Ingredient, 2017-2032
Table 4: Global Egg Replacement Ingredients Market Volume (MT) Forecast by Ingredient, 2017-2032
Table 5: Global Egg Replacement Ingredients Market Value (US$ Mn) Forecast by Form, 2017-2032
Table 6: Global Egg Replacement Ingredients Market Volume (MT) Forecast by Form, 2017-2032
Table 7: Global Egg Replacement Ingredients Market Value (US$ Mn) Forecast by Application, 2017-2032
Table 8: Global Egg Replacement Ingredients Market Volume (MT) Forecast by Application, 2017-2032
Table 9: North America Egg Replacement Ingredients Market Value (US$ Mn) Forecast by Country, 2017-2032
Table 10: North America Egg Replacement Ingredients Market Volume (MT) Forecast by Country, 2017-2032
Table 11: North America Egg Replacement Ingredients Market Value (US$ Mn) Forecast by Ingredient, 2017-2032
Table 12: North America Egg Replacement Ingredients Market Volume (MT) Forecast by Ingredient, 2017-2032
Table 13: North America Egg Replacement Ingredients Market Value (US$ Mn) Forecast by Form, 2017-2032
Table 14: North America Egg Replacement Ingredients Market Volume (MT) Forecast by Form, 2017-2032
Table 15: North America Egg Replacement Ingredients Market Value (US$ Mn) Forecast by Application, 2017-2032
Table 16: North America Egg Replacement Ingredients Market Volume (MT) Forecast by Application, 2017-2032
Table 17: Latin America Egg Replacement Ingredients Market Value (US$ Mn) Forecast by Country, 2017-2032
Table 18: Latin America Egg Replacement Ingredients Market Volume (MT) Forecast by Country, 2017-2032
Table 19: Latin America Egg Replacement Ingredients Market Value (US$ Mn) Forecast by Ingredient, 2017-2032
Table 20: Latin America Egg Replacement Ingredients Market Volume (MT) Forecast by Ingredient, 2017-2032
Table 21: Latin America Egg Replacement Ingredients Market Value (US$ Mn) Forecast by Form, 2017-2032
Table 22: Latin America Egg Replacement Ingredients Market Volume (MT) Forecast by Form, 2017-2032
Table 23: Latin America Egg Replacement Ingredients Market Value (US$ Mn) Forecast by Application, 2017-2032
Table 24: Latin America Egg Replacement Ingredients Market Volume (MT) Forecast by Application, 2017-2032
Table 25: Europe Egg Replacement Ingredients Market Value (US$ Mn) Forecast by Country, 2017-2032
Table 26: Europe Egg Replacement Ingredients Market Volume (MT) Forecast by Country, 2017-2032
Table 27: Europe Egg Replacement Ingredients Market Value (US$ Mn) Forecast by Ingredient, 2017-2032
Table 28: Europe Egg Replacement Ingredients Market Volume (MT) Forecast by Ingredient, 2017-2032
Table 29: Europe Egg Replacement Ingredients Market Value (US$ Mn) Forecast by Form, 2017-2032
Table 30: Europe Egg Replacement Ingredients Market Volume (MT) Forecast by Form, 2017-2032
Table 31: Europe Egg Replacement Ingredients Market Value (US$ Mn) Forecast by Application, 2017-2032
Table 32: Europe Egg Replacement Ingredients Market Volume (MT) Forecast by Application, 2017-2032
Table 33: East Asia Egg Replacement Ingredients Market Value (US$ Mn) Forecast by Country, 2017-2032
Table 34: East Asia Egg Replacement Ingredients Market Volume (MT) Forecast by Country, 2017-2032
Table 35: East Asia Egg Replacement Ingredients Market Value (US$ Mn) Forecast by Ingredient, 2017-2032
Table 36: East Asia Egg Replacement Ingredients Market Volume (MT) Forecast by Ingredient, 2017-2032
Table 37: East Asia Egg Replacement Ingredients Market Value (US$ Mn) Forecast by Form, 2017-2032
Table 38: East Asia Egg Replacement Ingredients Market Volume (MT) Forecast by Form, 2017-2032
Table 39: East Asia Egg Replacement Ingredients Market Value (US$ Mn) Forecast by Application, 2017-2032
Table 40: East Asia Egg Replacement Ingredients Market Volume (MT) Forecast by Application, 2017-2032
Table 41: South Asia Egg Replacement Ingredients Market Value (US$ Mn) Forecast by Country, 2017-2032
Table 42: South Asia Egg Replacement Ingredients Market Volume (MT) Forecast by Country, 2017-2032
Table 43: South Asia Egg Replacement Ingredients Market Value (US$ Mn) Forecast by Ingredient, 2017-2032
Table 44: South Asia Egg Replacement Ingredients Market Volume (MT) Forecast by Ingredient, 2017-2032
Table 45: South Asia Egg Replacement Ingredients Market Value (US$ Mn) Forecast by Form, 2017-2032
Table 46: South Asia Egg Replacement Ingredients Market Volume (MT) Forecast by Form, 2017-2032
Table 47: South Asia Egg Replacement Ingredients Market Value (US$ Mn) Forecast by Application, 2017-2032
Table 48: South Asia Egg Replacement Ingredients Market Volume (MT) Forecast by Application, 2017-2032
Table 49: Oceania Egg Replacement Ingredients Market Value (US$ Mn) Forecast by Country, 2017-2032
Table 50: Oceania Egg Replacement Ingredients Market Volume (MT) Forecast by Country, 2017-2032
Table 51: Oceania Egg Replacement Ingredients Market Value (US$ Mn) Forecast by Ingredient, 2017-2032
Table 52: Oceania Egg Replacement Ingredients Market Volume (MT) Forecast by Ingredient, 2017-2032
Table 53: Oceania Egg Replacement Ingredients Market Value (US$ Mn) Forecast by Form, 2017-2032
Table 54: Oceania Egg Replacement Ingredients Market Volume (MT) Forecast by Form, 2017-2032
Table 55: Oceania Egg Replacement Ingredients Market Value (US$ Mn) Forecast by Application, 2017-2032
Table 56: Oceania Egg Replacement Ingredients Market Volume (MT) Forecast by Application, 2017-2032
Table 57: MEA Egg Replacement Ingredients Market Value (US$ Mn) Forecast by Country, 2017-2032
Table 58: MEA Egg Replacement Ingredients Market Volume (MT) Forecast by Country, 2017-2032
Table 59: MEA Egg Replacement Ingredients Market Value (US$ Mn) Forecast by Ingredient, 2017-2032
Table 60: MEA Egg Replacement Ingredients Market Volume (MT) Forecast by Ingredient, 2017-2032
Table 61: MEA Egg Replacement Ingredients Market Value (US$ Mn) Forecast by Form, 2017-2032
Table 62: MEA Egg Replacement Ingredients Market Volume (MT) Forecast by Form, 2017-2032
Table 63: MEA Egg Replacement Ingredients Market Value (US$ Mn) Forecast by Application, 2017-2032
Table 64: MEA Egg Replacement Ingredients Market Volume (MT) Forecast by Application, 2017-2032
Find your sweet spots for generating winning opportunities in this market.
Talk to AnalystList of Charts
Figure 1: Global Egg Replacement Ingredients Market Value (US$ Mn) by Ingredient, 2022-2032
Figure 2: Global Egg Replacement Ingredients Market Value (US$ Mn) by Form, 2022-2032
Figure 3: Global Egg Replacement Ingredients Market Value (US$ Mn) by Application, 2022-2032
Figure 4: Global Egg Replacement Ingredients Market Value (US$ Mn) by Region, 2022-2032
Figure 5: Global Egg Replacement Ingredients Market Value (US$ Mn) Analysis by Region, 2017-2032
Figure 6: Global Egg Replacement Ingredients Market Volume (MT) Analysis by Region, 2017-2032
Figure 7: Global Egg Replacement Ingredients Market Value Share (%) and BPS Analysis by Region, 2022-2032
Figure 8: Global Egg Replacement Ingredients Market Y-o-Y Growth (%) Projections by Region, 2022-2032
Figure 9: Global Egg Replacement Ingredients Market Value (US$ Mn) Analysis by Ingredient, 2017-2032
Figure 10: Global Egg Replacement Ingredients Market Volume (MT) Analysis by Ingredient, 2017-2032
Figure 11: Global Egg Replacement Ingredients Market Value Share (%) and BPS Analysis by Ingredient, 2022-2032
Figure 12: Global Egg Replacement Ingredients Market Y-o-Y Growth (%) Projections by Ingredient, 2022-2032
Figure 13: Global Egg Replacement Ingredients Market Value (US$ Mn) Analysis by Form, 2017-2032
Figure 14: Global Egg Replacement Ingredients Market Volume (MT) Analysis by Form, 2017-2032
Figure 15: Global Egg Replacement Ingredients Market Value Share (%) and BPS Analysis by Form, 2022-2032
Figure 16: Global Egg Replacement Ingredients Market Y-o-Y Growth (%) Projections by Form, 2022-2032
Figure 17: Global Egg Replacement Ingredients Market Value (US$ Mn) Analysis by Application, 2017-2032
Figure 18: Global Egg Replacement Ingredients Market Volume (MT) Analysis by Application, 2017-2032
Figure 19: Global Egg Replacement Ingredients Market Value Share (%) and BPS Analysis by Application, 2022-2032
Figure 20: Global Egg Replacement Ingredients Market Y-o-Y Growth (%) Projections by Application, 2022-2032
Figure 21: Global Egg Replacement Ingredients Market Attractiveness by Ingredient, 2022-2032
Figure 22: Global Egg Replacement Ingredients Market Attractiveness by Form, 2022-2032
Figure 23: Global Egg Replacement Ingredients Market Attractiveness by Application, 2022-2032
Figure 24: Global Egg Replacement Ingredients Market Attractiveness by Region, 2022-2032
Figure 25: North America Egg Replacement Ingredients Market Value (US$ Mn) by Ingredient, 2022-2032
Figure 26: North America Egg Replacement Ingredients Market Value (US$ Mn) by Form, 2022-2032
Figure 27: North America Egg Replacement Ingredients Market Value (US$ Mn) by Application, 2022-2032
Figure 28: North America Egg Replacement Ingredients Market Value (US$ Mn) by Country, 2022-2032
Figure 29: North America Egg Replacement Ingredients Market Value (US$ Mn) Analysis by Country, 2017-2032
Figure 30: North America Egg Replacement Ingredients Market Volume (MT) Analysis by Country, 2017-2032
Figure 31: North America Egg Replacement Ingredients Market Value Share (%) and BPS Analysis by Country, 2022-2032
Figure 32: North America Egg Replacement Ingredients Market Y-o-Y Growth (%) Projections by Country, 2022-2032
Figure 33: North America Egg Replacement Ingredients Market Value (US$ Mn) Analysis by Ingredient, 2017-2032
Figure 34: North America Egg Replacement Ingredients Market Volume (MT) Analysis by Ingredient, 2017-2032
Figure 35: North America Egg Replacement Ingredients Market Value Share (%) and BPS Analysis by Ingredient, 2022-2032
Figure 36: North America Egg Replacement Ingredients Market Y-o-Y Growth (%) Projections by Ingredient, 2022-2032
Figure 37: North America Egg Replacement Ingredients Market Value (US$ Mn) Analysis by Form, 2017-2032
Figure 38: North America Egg Replacement Ingredients Market Volume (MT) Analysis by Form, 2017-2032
Figure 39: North America Egg Replacement Ingredients Market Value Share (%) and BPS Analysis by Form, 2022-2032
Figure 40: North America Egg Replacement Ingredients Market Y-o-Y Growth (%) Projections by Form, 2022-2032
Figure 41: North America Egg Replacement Ingredients Market Value (US$ Mn) Analysis by Application, 2017-2032
Figure 42: North America Egg Replacement Ingredients Market Volume (MT) Analysis by Application, 2017-2032
Figure 43: North America Egg Replacement Ingredients Market Value Share (%) and BPS Analysis by Application, 2022-2032
Figure 44: North America Egg Replacement Ingredients Market Y-o-Y Growth (%) Projections by Application, 2022-2032
Figure 45: North America Egg Replacement Ingredients Market Attractiveness by Ingredient, 2022-2032
Figure 46: North America Egg Replacement Ingredients Market Attractiveness by Form, 2022-2032
Figure 47: North America Egg Replacement Ingredients Market Attractiveness by Application, 2022-2032
Figure 48: North America Egg Replacement Ingredients Market Attractiveness by Country, 2022-2032
Figure 49: Latin America Egg Replacement Ingredients Market Value (US$ Mn) by Ingredient, 2022-2032
Figure 50: Latin America Egg Replacement Ingredients Market Value (US$ Mn) by Form, 2022-2032
Figure 51: Latin America Egg Replacement Ingredients Market Value (US$ Mn) by Application, 2022-2032
Figure 52: Latin America Egg Replacement Ingredients Market Value (US$ Mn) by Country, 2022-2032
Figure 53: Latin America Egg Replacement Ingredients Market Value (US$ Mn) Analysis by Country, 2017-2032
Figure 54: Latin America Egg Replacement Ingredients Market Volume (MT) Analysis by Country, 2017-2032
Figure 55: Latin America Egg Replacement Ingredients Market Value Share (%) and BPS Analysis by Country, 2022-2032
Figure 56: Latin America Egg Replacement Ingredients Market Y-o-Y Growth (%) Projections by Country, 2022-2032
Figure 57: Latin America Egg Replacement Ingredients Market Value (US$ Mn) Analysis by Ingredient, 2017-2032
Figure 58: Latin America Egg Replacement Ingredients Market Volume (MT) Analysis by Ingredient, 2017-2032
Figure 59: Latin America Egg Replacement Ingredients Market Value Share (%) and BPS Analysis by Ingredient, 2022-2032
Figure 60: Latin America Egg Replacement Ingredients Market Y-o-Y Growth (%) Projections by Ingredient, 2022-2032
Figure 61: Latin America Egg Replacement Ingredients Market Value (US$ Mn) Analysis by Form, 2017-2032
Figure 62: Latin America Egg Replacement Ingredients Market Volume (MT) Analysis by Form, 2017-2032
Figure 63: Latin America Egg Replacement Ingredients Market Value Share (%) and BPS Analysis by Form, 2022-2032
Figure 64: Latin America Egg Replacement Ingredients Market Y-o-Y Growth (%) Projections by Form, 2022-2032
Figure 65: Latin America Egg Replacement Ingredients Market Value (US$ Mn) Analysis by Application, 2017-2032
Figure 66: Latin America Egg Replacement Ingredients Market Volume (MT) Analysis by Application, 2017-2032
Figure 67: Latin America Egg Replacement Ingredients Market Value Share (%) and BPS Analysis by Application, 2022-2032
Figure 68: Latin America Egg Replacement Ingredients Market Y-o-Y Growth (%) Projections by Application, 2022-2032
Figure 69: Latin America Egg Replacement Ingredients Market Attractiveness by Ingredient, 2022-2032
Figure 70: Latin America Egg Replacement Ingredients Market Attractiveness by Form, 2022-2032
Figure 71: Latin America Egg Replacement Ingredients Market Attractiveness by Application, 2022-2032
Figure 72: Latin America Egg Replacement Ingredients Market Attractiveness by Country, 2022-2032
Figure 73: Europe Egg Replacement Ingredients Market Value (US$ Mn) by Ingredient, 2022-2032
Figure 74: Europe Egg Replacement Ingredients Market Value (US$ Mn) by Form, 2022-2032
Figure 75: Europe Egg Replacement Ingredients Market Value (US$ Mn) by Application, 2022-2032
Figure 76: Europe Egg Replacement Ingredients Market Value (US$ Mn) by Country, 2022-2032
Figure 77: Europe Egg Replacement Ingredients Market Value (US$ Mn) Analysis by Country, 2017-2032
Figure 78: Europe Egg Replacement Ingredients Market Volume (MT) Analysis by Country, 2017-2032
Figure 79: Europe Egg Replacement Ingredients Market Value Share (%) and BPS Analysis by Country, 2022-2032
Figure 80: Europe Egg Replacement Ingredients Market Y-o-Y Growth (%) Projections by Country, 2022-2032
Figure 81: Europe Egg Replacement Ingredients Market Value (US$ Mn) Analysis by Ingredient, 2017-2032
Figure 82: Europe Egg Replacement Ingredients Market Volume (MT) Analysis by Ingredient, 2017-2032
Figure 83: Europe Egg Replacement Ingredients Market Value Share (%) and BPS Analysis by Ingredient, 2022-2032
Figure 84: Europe Egg Replacement Ingredients Market Y-o-Y Growth (%) Projections by Ingredient, 2022-2032
Figure 85: Europe Egg Replacement Ingredients Market Value (US$ Mn) Analysis by Form, 2017-2032
Figure 86: Europe Egg Replacement Ingredients Market Volume (MT) Analysis by Form, 2017-2032
Figure 87: Europe Egg Replacement Ingredients Market Value Share (%) and BPS Analysis by Form, 2022-2032
Figure 88: Europe Egg Replacement Ingredients Market Y-o-Y Growth (%) Projections by Form, 2022-2032
Figure 89: Europe Egg Replacement Ingredients Market Value (US$ Mn) Analysis by Application, 2017-2032
Figure 90: Europe Egg Replacement Ingredients Market Volume (MT) Analysis by Application, 2017-2032
Figure 91: Europe Egg Replacement Ingredients Market Value Share (%) and BPS Analysis by Application, 2022-2032
Figure 92: Europe Egg Replacement Ingredients Market Y-o-Y Growth (%) Projections by Application, 2022-2032
Figure 93: Europe Egg Replacement Ingredients Market Attractiveness by Ingredient, 2022-2032
Figure 94: Europe Egg Replacement Ingredients Market Attractiveness by Form, 2022-2032
Figure 95: Europe Egg Replacement Ingredients Market Attractiveness by Application, 2022-2032
Figure 96: Europe Egg Replacement Ingredients Market Attractiveness by Country, 2022-2032
Figure 97: East Asia Egg Replacement Ingredients Market Value (US$ Mn) by Ingredient, 2022-2032
Figure 98: East Asia Egg Replacement Ingredients Market Value (US$ Mn) by Form, 2022-2032
Figure 99: East Asia Egg Replacement Ingredients Market Value (US$ Mn) by Application, 2022-2032
Figure 100: East Asia Egg Replacement Ingredients Market Value (US$ Mn) by Country, 2022-2032
Figure 101: East Asia Egg Replacement Ingredients Market Value (US$ Mn) Analysis by Country, 2017-2032
Figure 102: East Asia Egg Replacement Ingredients Market Volume (MT) Analysis by Country, 2017-2032
Figure 103: East Asia Egg Replacement Ingredients Market Value Share (%) and BPS Analysis by Country, 2022-2032
Figure 104: East Asia Egg Replacement Ingredients Market Y-o-Y Growth (%) Projections by Country, 2022-2032
Figure 105: East Asia Egg Replacement Ingredients Market Value (US$ Mn) Analysis by Ingredient, 2017-2032
Figure 106: East Asia Egg Replacement Ingredients Market Volume (MT) Analysis by Ingredient, 2017-2032
Figure 107: East Asia Egg Replacement Ingredients Market Value Share (%) and BPS Analysis by Ingredient, 2022-2032
Figure 108: East Asia Egg Replacement Ingredients Market Y-o-Y Growth (%) Projections by Ingredient, 2022-2032
Figure 109: East Asia Egg Replacement Ingredients Market Value (US$ Mn) Analysis by Form, 2017-2032
Figure 110: East Asia Egg Replacement Ingredients Market Volume (MT) Analysis by Form, 2017-2032
Figure 111: East Asia Egg Replacement Ingredients Market Value Share (%) and BPS Analysis by Form, 2022-2032
Figure 112: East Asia Egg Replacement Ingredients Market Y-o-Y Growth (%) Projections by Form, 2022-2032
Figure 113: East Asia Egg Replacement Ingredients Market Value (US$ Mn) Analysis by Application, 2017-2032
Figure 114: East Asia Egg Replacement Ingredients Market Volume (MT) Analysis by Application, 2017-2032
Figure 115: East Asia Egg Replacement Ingredients Market Value Share (%) and BPS Analysis by Application, 2022-2032
Figure 116: East Asia Egg Replacement Ingredients Market Y-o-Y Growth (%) Projections by Application, 2022-2032
Figure 117: East Asia Egg Replacement Ingredients Market Attractiveness by Ingredient, 2022-2032
Figure 118: East Asia Egg Replacement Ingredients Market Attractiveness by Form, 2022-2032
Figure 119: East Asia Egg Replacement Ingredients Market Attractiveness by Application, 2022-2032
Figure 120: East Asia Egg Replacement Ingredients Market Attractiveness by Country, 2022-2032
Figure 121: South Asia Egg Replacement Ingredients Market Value (US$ Mn) by Ingredient, 2022-2032
Figure 122: South Asia Egg Replacement Ingredients Market Value (US$ Mn) by Form, 2022-2032
Figure 123: South Asia Egg Replacement Ingredients Market Value (US$ Mn) by Application, 2022-2032
Figure 124: South Asia Egg Replacement Ingredients Market Value (US$ Mn) by Country, 2022-2032
Figure 125: South Asia Egg Replacement Ingredients Market Value (US$ Mn) Analysis by Country, 2017-2032
Figure 126: South Asia Egg Replacement Ingredients Market Volume (MT) Analysis by Country, 2017-2032
Figure 127: South Asia Egg Replacement Ingredients Market Value Share (%) and BPS Analysis by Country, 2022-2032
Figure 128: South Asia Egg Replacement Ingredients Market Y-o-Y Growth (%) Projections by Country, 2022-2032
Figure 129: South Asia Egg Replacement Ingredients Market Value (US$ Mn) Analysis by Ingredient, 2017-2032
Figure 130: South Asia Egg Replacement Ingredients Market Volume (MT) Analysis by Ingredient, 2017-2032
Figure 131: South Asia Egg Replacement Ingredients Market Value Share (%) and BPS Analysis by Ingredient, 2022-2032
Figure 132: South Asia Egg Replacement Ingredients Market Y-o-Y Growth (%) Projections by Ingredient, 2022-2032
Figure 133: South Asia Egg Replacement Ingredients Market Value (US$ Mn) Analysis by Form, 2017-2032
Figure 134: South Asia Egg Replacement Ingredients Market Volume (MT) Analysis by Form, 2017-2032
Figure 135: South Asia Egg Replacement Ingredients Market Value Share (%) and BPS Analysis by Form, 2022-2032
Figure 136: South Asia Egg Replacement Ingredients Market Y-o-Y Growth (%) Projections by Form, 2022-2032
Figure 137: South Asia Egg Replacement Ingredients Market Value (US$ Mn) Analysis by Application, 2017-2032
Figure 138: South Asia Egg Replacement Ingredients Market Volume (MT) Analysis by Application, 2017-2032
Figure 139: South Asia Egg Replacement Ingredients Market Value Share (%) and BPS Analysis by Application, 2022-2032
Figure 140: South Asia Egg Replacement Ingredients Market Y-o-Y Growth (%) Projections by Application, 2022-2032
Figure 141: South Asia Egg Replacement Ingredients Market Attractiveness by Ingredient, 2022-2032
Figure 142: South Asia Egg Replacement Ingredients Market Attractiveness by Form, 2022-2032
Figure 143: South Asia Egg Replacement Ingredients Market Attractiveness by Application, 2022-2032
Figure 144: South Asia Egg Replacement Ingredients Market Attractiveness by Country, 2022-2032
Figure 145: Oceania Egg Replacement Ingredients Market Value (US$ Mn) by Ingredient, 2022-2032
Figure 146: Oceania Egg Replacement Ingredients Market Value (US$ Mn) by Form, 2022-2032
Figure 147: Oceania Egg Replacement Ingredients Market Value (US$ Mn) by Application, 2022-2032
Figure 148: Oceania Egg Replacement Ingredients Market Value (US$ Mn) by Country, 2022-2032
Figure 149: Oceania Egg Replacement Ingredients Market Value (US$ Mn) Analysis by Country, 2017-2032
Figure 150: Oceania Egg Replacement Ingredients Market Volume (MT) Analysis by Country, 2017-2032
Figure 151: Oceania Egg Replacement Ingredients Market Value Share (%) and BPS Analysis by Country, 2022-2032
Figure 152: Oceania Egg Replacement Ingredients Market Y-o-Y Growth (%) Projections by Country, 2022-2032
Figure 153: Oceania Egg Replacement Ingredients Market Value (US$ Mn) Analysis by Ingredient, 2017-2032
Figure 154: Oceania Egg Replacement Ingredients Market Volume (MT) Analysis by Ingredient, 2017-2032
Figure 155: Oceania Egg Replacement Ingredients Market Value Share (%) and BPS Analysis by Ingredient, 2022-2032
Figure 156: Oceania Egg Replacement Ingredients Market Y-o-Y Growth (%) Projections by Ingredient, 2022-2032
Figure 157: Oceania Egg Replacement Ingredients Market Value (US$ Mn) Analysis by Form, 2017-2032
Figure 158: Oceania Egg Replacement Ingredients Market Volume (MT) Analysis by Form, 2017-2032
Figure 159: Oceania Egg Replacement Ingredients Market Value Share (%) and BPS Analysis by Form, 2022-2032
Figure 160: Oceania Egg Replacement Ingredients Market Y-o-Y Growth (%) Projections by Form, 2022-2032
Figure 161: Oceania Egg Replacement Ingredients Market Value (US$ Mn) Analysis by Application, 2017-2032
Figure 162: Oceania Egg Replacement Ingredients Market Volume (MT) Analysis by Application, 2017-2032
Figure 163: Oceania Egg Replacement Ingredients Market Value Share (%) and BPS Analysis by Application, 2022-2032
Figure 164: Oceania Egg Replacement Ingredients Market Y-o-Y Growth (%) Projections by Application, 2022-2032
Figure 165: Oceania Egg Replacement Ingredients Market Attractiveness by Ingredient, 2022-2032
Figure 166: Oceania Egg Replacement Ingredients Market Attractiveness by Form, 2022-2032
Figure 167: Oceania Egg Replacement Ingredients Market Attractiveness by Application, 2022-2032
Figure 168: Oceania Egg Replacement Ingredients Market Attractiveness by Country, 2022-2032
Figure 169: MEA Egg Replacement Ingredients Market Value (US$ Mn) by Ingredient, 2022-2032
Figure 170: MEA Egg Replacement Ingredients Market Value (US$ Mn) by Form, 2022-2032
Figure 171: MEA Egg Replacement Ingredients Market Value (US$ Mn) by Application, 2022-2032
Figure 172: MEA Egg Replacement Ingredients Market Value (US$ Mn) by Country, 2022-2032
Figure 173: MEA Egg Replacement Ingredients Market Value (US$ Mn) Analysis by Country, 2017-2032
Figure 174: MEA Egg Replacement Ingredients Market Volume (MT) Analysis by Country, 2017-2032
Figure 175: MEA Egg Replacement Ingredients Market Value Share (%) and BPS Analysis by Country, 2022-2032
Figure 176: MEA Egg Replacement Ingredients Market Y-o-Y Growth (%) Projections by Country, 2022-2032
Figure 177: MEA Egg Replacement Ingredients Market Value (US$ Mn) Analysis by Ingredient, 2017-2032
Figure 178: MEA Egg Replacement Ingredients Market Volume (MT) Analysis by Ingredient, 2017-2032
Figure 179: MEA Egg Replacement Ingredients Market Value Share (%) and BPS Analysis by Ingredient, 2022-2032
Figure 180: MEA Egg Replacement Ingredients Market Y-o-Y Growth (%) Projections by Ingredient, 2022-2032
Figure 181: MEA Egg Replacement Ingredients Market Value (US$ Mn) Analysis by Form, 2017-2032
Figure 182: MEA Egg Replacement Ingredients Market Volume (MT) Analysis by Form, 2017-2032
Figure 183: MEA Egg Replacement Ingredients Market Value Share (%) and BPS Analysis by Form, 2022-2032
Figure 184: MEA Egg Replacement Ingredients Market Y-o-Y Growth (%) Projections by Form, 2022-2032
Figure 185: MEA Egg Replacement Ingredients Market Value (US$ Mn) Analysis by Application, 2017-2032
Figure 186: MEA Egg Replacement Ingredients Market Volume (MT) Analysis by Application, 2017-2032
Figure 187: MEA Egg Replacement Ingredients Market Value Share (%) and BPS Analysis by Application, 2022-2032
Figure 188: MEA Egg Replacement Ingredients Market Y-o-Y Growth (%) Projections by Application, 2022-2032
Figure 189: MEA Egg Replacement Ingredients Market Attractiveness by Ingredient, 2022-2032
Figure 190: MEA Egg Replacement Ingredients Market Attractiveness by Form, 2022-2032
Figure 191: MEA Egg Replacement Ingredients Market Attractiveness by Application, 2022-2032
Figure 192: MEA Egg Replacement Ingredients Market Attractiveness by Country, 2022-2032
Need specific information?
Request CustomizationExplore Food and Beverage Insights
View Reports