Egg Breaking Machine Market Outlook (2023 to 2033)

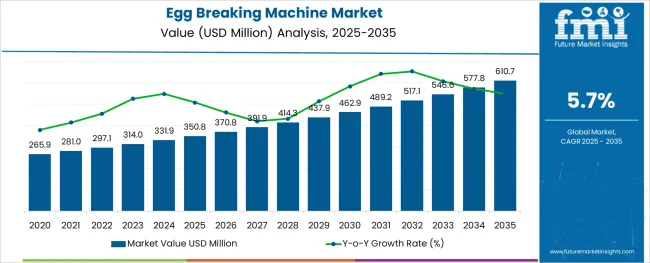
By 2033, the Egg Breaking Machine Market is anticipated to expand at a CAGR of 5.7%. The market size is expected to increase from US$ 314 million in 2023 to US$ 547.8 million by 2033, according to FMI. The market's value in 2022 was US$ 292.4 million, with a slightly lower CAGR of 4.5% from 2018 to 2022.

Sellers of egg-based products have a considerable chance to transform eggs into valuable food ingredients due to the rising demand for egg-breaking machines in the food business. Due to the enormous complexity of modern egg processing gear and grading installations, some components of the plant must be integrated in order for them to operate at their best, which is what is driving the growth of the egg-breaking machine market.

Additionally, egg-breaking machine uses both in-line and off-line egg processing as two strategies for preserving egg quality on the farm. Demand for premium egg products increased as consumer tastes shifted toward processed foods.

The egg-breaking machine market saw a significant expansion due to rising consumer demand for a nutritious diet and high-protein foods. To enhance the production of egg-related products for the approaching market, the egg-breaking machine business has begun utilizing high-quality manufacturing products.

Convenience meals, packaged foods, and processed foods are more in demand as a result of changing food habits and expanding urban and rural populations. The necessity to physically crack eggshells and separate individual egg parts, including the yolk and egg white, is reduced when using processed eggs.

This is likely to be another factor accelerating the egg-breaking machine market growth, which is processed eggs' lower risk of contaminants and pathogens. Moreover, the ease and low cost with which eggs may be purchased on the market is a motivating factor for the sales of egg-breaking machines. New items are constantly being created in response to consumer demand, with innovation and usefulness playing a significant role.

Eggs are processed by having the eggshells removed, and the liquid product that is produced is then dispensed to further refine and prepare it for use in a variety of foods.

The egg-breaking machine market is anticipated to be driven throughout the projected period by the rise in innovations and technological advances in the processing equipment sector.

  • The efficient production of liquid-egg products was greatly enhanced by the invention of egg-breaking and separation devices. At least three separate companies offer breaking machines. They are extremely advanced mechanical, mechanized, and electronic devices that can produce up to 65,000 eggs each hour. Many factors can influence the solid content of egg yolks generated by egg-breaking devices.
  • According to the UNEP Food Waste Index Report 2021, there are 931 million tonnes of food waste in total, 26% of which comes from the food service industry. Additionally, the egg-breaking machine market is starting to feel the financial strain of both freshwater usage and wastewater disposal.
  • A more targeted strategy for enhancing yield and overall production efficiency, including the lowering of operational expenses, is emerging as egg businesses consolidate more frequently.
  • Companies try to offer the appropriate solutions in order to achieve these challenging goals as a chosen supplier to this sector.
Attributes Details
Egg Breaking Machine Market CAGR (2023 to 2033) 5.7%
Egg-Breaking Machine Market Size (2023) US$ 314 million
Egg Breaking Machine Market Size (2033) US$ 547.8 million

Don't pay for what you don't need

Customize your report by selecting specific countries or regions and save 30%!

Egg Breaking Machine Market: Transformation from 2018 to 2022 and 2023 to 2033

The egg-breaking machine market expanded at a 4.5% CAGR from 2018 to 2022. According to FMI, by 2033, demand for egg-breaking machines would rise by 5.7%. The approximate market growth is expected to be US$ 233.8 million.

In total, the egg industry employs 4 million people. According to the IEC's economic analysis of the egg industry, the value at the farm level is projected to be 92,000 million US dollars. At the retail level, this rises to 145 billion US dollars. These figures unmistakably demonstrate that selling eggs can generate good profits, but that not all of this value is reinvested in the egg industry.

This ultimately affects the egg-breaking machines market's overall growth. Additionally, the system needs to redirect inappropriate eggs to pulping so as to reduce the financial loss caused by the egg business heavily influencing the growth of the market for egg-breaking machines.

Outlook of Key Leading Applications in the Market

  • Consumer Awareness Towards Nutritional Benefits

The egg-breaking machine market is expected to increase as a result of rising consumer awareness of the excellent quality and nutritional benefits of eggs, as well as strict regulatory regulations on the procedures and materials used to handle and process eggs.

Additionally, the demand for egg-breaking machines is expanding due to the growing need for egg source identification to prevent the introduction of dangerous eggs.

  • Rise in Organic Eggs Market

Compared to conventional eggs, organic eggs have a higher level of nutrients and a higher source of omega-3 fatty acids. Comparing traditional and mass-produced caged chicken eggs to organic eggs, this element is anticipated to support the growth of the global egg-breaking machine market.

According to the USDA, only birds fed an organic diet are permitted to produce organic eggs. Feed that is free of animal byproducts, synthetic fertilizers, pesticides, and other chemical additions is referred to as organic feed.

  • High Initial Costs

High initial and ongoing costs of egg-breaking machine technology or equipment may prevent its adoption in some nations, where people would prefer to wash their eggs by hand.

Additionally, the recent movement in consumer preferences toward vegan cuisine and the availability of egg replacements may restrain the growth of the worldwide egg-breaking machine market over the forecast period.

Nandini Roy Choudhury

Principal Consultant

Talk to Analyst

Find your sweet spots for generating winning opportunities in this market.

Category-wise Outlook

Management Effectiveness Opens up new opportunities in the Gas Operated Egg Breaking Machine

Gas operated egg-breaking machine segment historically expanded at a steady CAGR of 5.0% and is expected to develop at a CAGR of 6.0% by 2033.

The effectiveness and depth of expertise in this segment of the egg-breaking machine industry are credited with this expansion. Manufacturers concentrated on providing gas-powered egg-breaking machines that were created under the supervision of qualified experts using the best materials in accordance with established market standards.

Which Segment Leads the Egg Breaking Machine Market, Based on Capacity?

Egg-breaking machines with 3000-5000 capacity dominated the market, expected to develop at a CAGR of 5.4% by 2033.

Such appliances are purchased by investors in order to save time and labor in the kitchen. Additionally, during the past several years, there has been a sharp growth in the use of eggs in baked goods. The egg is utilized to soften or add richness to the meal. Since the majority of consumers prefer cake with eggs or other egg-containing baked goods, this market segment is likely to grow at the quickest rate over the projection period.
Region-wise Outlook

What Significant Practices Lead to Regional Development of the Egg-Breaking Machine Market

Region/Country USA
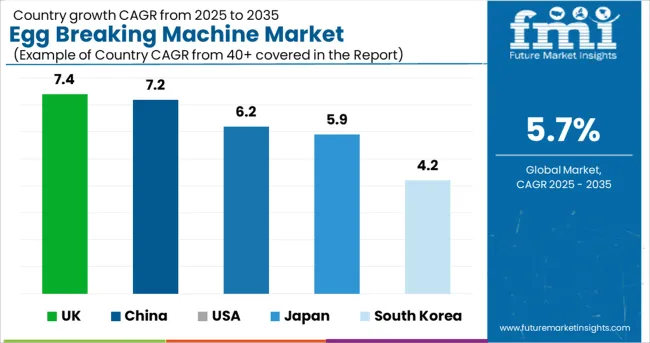
Statistics By 2033, the US is predicted to hold a CAGR of 6.2%. The market has historically grown at a CAGR of 5.2%. The period's growth rate is around US$ 61.5 million.
Factors Growth is attributed to the strict government guidelines for organic foods and practices or standards while processing eggs. The rise of the egg-breaking machine market in North America can also be attributed to the rising consumer awareness of unsafe and contaminated eggs.
Region/Country Asia Pacific
Statistics China-expected CAGR of 7.2% with a market value of US$ 82.1 million by 2033. Japan-expected CAGR of 5.9% with a market value of US$ 34.5 million by 2033 South Korea expected a CAGR of 4.2% with a market value of US$ 13.6 million by 2033
Factors Due mostly to the rising use of eggs in baked goods and processed foods, the Asia Pacific region is the region with the fastest-growing need for egg-breaking machines. Particularly in developing nations like Mexico, China, and India that are building new factories for the processing of eggs, the demand for goods containing processed eggs is growing significantly. South Korea is also a developing market for egg-breaking machines, which can be attributed to consumers' growing purchasing power, their growing interest in healthy food options, and their rising level of life.
Region/Country Europe
Statistics By 2033, the UK is predicted to hold a CAGR of 7.4%, with a market value of US$ 38.3 million. The market has historically grown at a CAGR of 4.5%. The period's growth rate is around US$ 19.5 million.
Factors With amazing additional qualities, the product is just as safe to use as raw eggs, making it ideal for usage in many foods service-related end-use industries. Developing nations are switching from eating foods high in carbohydrates to foods high in protein, including the UK and other nations.

Get the data you need at a Fraction of the cost

Personalize your report by choosing insights you need
and save 40%!

Competitive Landscape

With the development of new technologies, companies like Sanovo Technology Group and River Systems are enhancing their reputations while making necessary endeavors.

A smart egg breaker machine that also separates the egg yolk is being produced by manufacturers to automate a mechanical system to serve this purpose as required by the industry. The most recent device is made to efficiently break eggs, split their shells, and separate the yolk from them so that output is constant every time.

These automatic machines provide new opportunities to egg-breaking machine manufacturers. For instance, one of the top manufacturers of food processing equipment, Sanovo Technology Group, recently unveiled a brand-new pasteurizing system for the US egg-breaking machine market.

Moreover, egg products are less likely to be contaminated with salmonella due to this technology. The most frequent bacterium that results in food poisoning in eggs is salmonella. As a result, a growing variety of product launch strategies are driving up demand for egg-processing goods. The business environment of the egg-breaking machine industry is extremely competitive due to a large number of rivals.

The demand for the egg-breaking machine has expanded as more cuisines, baked goods, and other items call for the usage of eggs. Key players concentrate on the creation of specialized products with better production speeds and reduced operational costs, such as modular assembly lines. This is predicted to have a significant impact on the sales of egg-breaking machines.

The River Systems innovation for 2022 is the ET TOP 24 incubator, which can be fully programmed remotely via the River CovApp. It has a new electronic board with a higher-speed processor and a new, bigger, easier-to-read display.

Companies operating in the egg-breaking machine industry are also anticipated to adopt big data analytics, IoT, robots, and other technologies. To enhance output, for instance, producers have begun utilizing robots to package eggs. It is anticipated that these technological advancements propel the egg-breaking machine ahead.

Initiatives by Egg Machines Market Key Players

  • To keep a competitive edge, these important businesses are likewise making large investments in the creation of new machinery.
  • Moba B.V. introduced the Moba Forta GT100, a new egg-grade machine, in April 2019.
  • Cal-Maine Foods, Inc. finalized the purchase of Red River Valley Egg Farm, LLC's shareholding in June 2021. As a result, Red River Valley Egg Farm, LLC is now a wholly-owned subsidiary of the company.
  • To meet the demand for dry egg products from importing nations, the Ovostar Union boosted its egg processing volume in April 2019 from 139 million eggs in 2018 to 142 million eggs in 2019.
  • DolgovGroup began investing in a new egg-breaking machine facility in Russia in October 2018 with the goal of producing pasteurized egg white/yolk and dried egg products.

Key Players

  • ACTINI GROUP
  • Igreca S.A.,
  • Interovo Egg Group B.V.
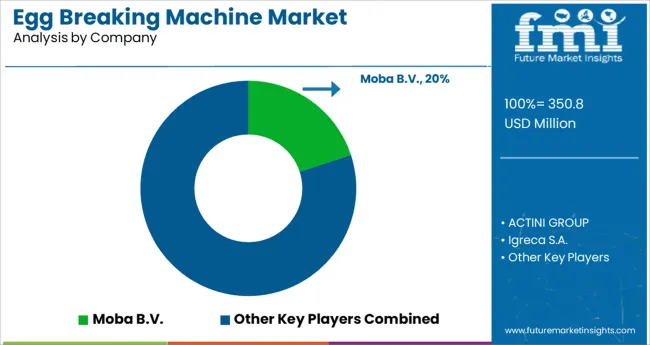
  • Moba B.V.
  • OVO Tech

Key Segments

By Operation Mode:

  • Gas Operated
  • Electrically Operated

By Capacity:

  • <1000
  • 1000-3000
  • 3000-5000
  • >5000

By Sales Channel:

  • Offline
  • Online

By Region:

  • North America
  • Latin America
  • Europe
  • East Asia
  • South Asia and the Pacific
  • Middle East & Africa

Frequently Asked Questions

What is the Growth Outlook of the Egg Breaking Machine Market?

The egg breaking machine market is estimated to record a CAGR of 5.7% during the forecast period.

What is the Projected Value of the Egg Breaking Machine Market By 2033?

The egg breaking machine market size is predicted to be valued at US$ 547.8 million by 2033.

What is the Present Size of the Egg Breaking Machine Market?

The egg breaking machine market share is valued at US$ 314 million in 2023.

Which is the Leading Region in the Egg Breaking Machine Market?

North America is expected to lead the egg breaking machine market with a share of 6.2% by 2033.

Which is the Leading Segment in the Egg Breaking Machine Market, Based on Capacity?

3000-5000 capacity machines dominate the egg breaking machine market, with a CAGR of 5.4% by 2033.

Table of Content
1. Executive Summary | Egg Breaking Machine Market
2. Market Overview
    2.1. Market Definition and Introduction
    2.2. Market Taxonomy/ Research Scope
3. Market Background and Foundation Data
    3.1. Global FnB Processing Equipment Industry Outlook
    3.2. Penetration of in Global Market
    3.3. Comparison of Different Types
    3.4. Growth & Development Pattern in Market
    3.5. Market Opportunity Assessment
        3.5.1. Total Available Market (US$ Million)
        3.5.2. Serviceable Addressable Market (US$ Million)
        3.5.3. Serviceable Obtainable Market (US$ Million)
    3.6. Market White Space Assessment
    3.7. Market Dynamics
        3.7.1. Market Growth Drivers
        3.7.2. Market Restraints
        3.7.3. Market Opportunity
        3.7.4. Market Trends
    3.8. PESTLE Analysis
    3.9. Porter`s Five Force Analysis
    3.10. Investment Feasibility Analysis
    3.11. Key Success Factors
    3.12. Industry Value and Supply Chain Analysis
        3.12.1. Value Added at Each Node of Supply Chain
        3.12.2. Gross Profitability Margins (at Every Level)
        3.12.3. List of Key Participants
            3.12.3.1. Component Suppliers
            3.12.3.2. Manufacturers
            3.12.3.3. Mid-Level Participants
            3.12.3.4. End Users (Prominent)
    3.13. Forecast and Macro-economic Factors - Relevance and Impact
4. Global Demand (Units) Analysis and Forecast
    4.1. Historical Market Volume (Units) Analysis, 2018 to 2022
    4.2. Current and Future Market Volume (Units) Projections, 2023 to 2033
    4.3. Y-o-Y Volume Growth Trend Analysis
5. Global Market - Pricing Analysis
    5.1. Product Category and Country-Level Pricing Analysis
    5.2. Global Average Pricing Analysis Benchmark
    5.3. Factors Influencing Pricing
6. Global Market Value (US$ Million) Analysis and Forecast
    6.1. Historical Market Value (US$ Million) Analysis, 2018 to 2022
    6.2. Current and Future Market Value (US$ Million) Projections, 2023 to 2033
        6.2.1. Y-o-Y Growth Trend Analysis
        6.2.2. Absolute $ Opportunity Analysis
7. Global Market Analysis and Forecast, By Operation mode
    7.1. Introduction / Key Findings
    7.2. Historical Market Size (US$ Million) and Volume (Units) Analysis By Operation mode, 2018 to 2022
    7.3. Current and Future Market Size (US$ Million) Analysis and Volume (Units) Forecast By Operation mode, 2023 to 2033
        7.3.1. Gas operated
        7.3.2. Electrically operated
    7.4. Market Attractiveness Analysis Type
8. Global Market Analysis and Forecast, By Capacity
    8.1. Introduction / Key Findings
    8.2. Historical Market Size (US$ Million) and Volume (Units) Analysis By Capacity, 2018 to 2022
    8.3. Current and Future Market Size (US$ Million) Analysis and Volume (Units) Forecast By Capacity, 2023 to 2033
        8.3.1. <1000
        8.3.2. 1000-3000
        8.3.3. 3000-5000
        8.3.4. >5000
    8.4. Market Attractiveness Analysis By Capacity
9. Global Market Analysis and Forecast, By Sales Channel
    9.1. Introduction / Key Findings
    9.2. Historical Market Size (US$ Million) and Volume (Units) Analysis By Sales Channel, 2018 to 2022
    9.3. Current and Future Market Size (US$ Million) Analysis and Volume (Units) Forecast By Sales Channel, 2023 to 2033
        9.3.1. Offline
        9.3.2. Online
    9.4. Market Attractiveness Analysis By Sales Channel
10. Global Market Analysis and Forecast, by Region
    10.1. Introduction
    10.2. Historical Market Size (US$ Million) and Volume (Units) Analysis By Region, 2018 to 2022
    10.3. Current Market Size (US$ Million) Analysis and Volume (Units) Forecast By Region, 2023 to 2033
        10.3.1. North America
        10.3.2. Latin America
        10.3.3. Europe
        10.3.4. East Asia
        10.3.5. South Asia & Oceania
        10.3.6. Middle East & Africa
    10.4. Market Attractiveness Analysis By Region
11. North America Market Analysis and Forecast
    11.1. Introduction / Key Findings
    11.2. Pricing Analysis
    11.3. Historical Market Size (US$ Million) and Volume (Units) Trend Analysis By Market Taxonomy, 2018 to 2022
    11.4. Market Size (US$ Million) and Volume (Units) Forecast By Market Taxonomy, 2023 to 2033
        11.4.1. By Country
            11.4.1.1. United States of America
            11.4.1.2. Canada
        11.4.2. By Operation mode
        11.4.3. By Capacity
        11.4.4. By Sales Channel
    11.5. Market Attractiveness Analysis
        11.5.1. By Country
        11.5.2. By Operation mode
        11.5.3. By Capacity
        11.5.4. By Sales Channel
12. Latin America Market Analysis and Forecast
    12.1. Introduction / Key Findings
    12.2. Pricing Analysis
    12.3. Historical Market Size (US$ Million) and Volume (Units) Trend Analysis By Market Taxonomy, 2018 to 2022
    12.4. Market Size (US$ Million) and Volume (Units) Forecast By Market Taxonomy, 2023 to 2033
        12.4.1. By Country
            12.4.1.1. Brazil
            12.4.1.2. Mexico
            12.4.1.3. Argentina
            12.4.1.4. Rest of Latin America
        12.4.2. By Operation mode
        12.4.3. By Capacity
        12.4.4. By Sales Channel
    12.5. Market Attractiveness Analysis
        12.5.1. By Country
        12.5.2. By Operation mode
        12.5.3. By Capacity
        12.5.4. By Sales Channel
13. Europe Market Analysis and Forecast
    13.1. Introduction / Key Findings
    13.2. Pricing Analysis
    13.3. Historical Market Size (US$ Million) and Volume (Units) Trend Analysis By Market Taxonomy, 2018 to 2022
    13.4. Market Size (US$ Million) and Volume (Units) Forecast By Market Taxonomy, 2023 to 2033
        13.4.1. By Country
            13.4.1.1. Germany
            13.4.1.2. Italy
            13.4.1.3. France
            13.4.1.4. United Kingdom
            13.4.1.5. Spain
            13.4.1.6. BENELUX
            13.4.1.7. Russia
            13.4.1.8. Rest of Europe
        13.4.2. By Operation mode
        13.4.3. By Capacity
        13.4.4. By Sales Channel
    13.5. Market Attractiveness Analysis
        13.5.1. By Country
        13.5.2. By Operation mode
        13.5.3. By Capacity
        13.5.4. By Sales Channel
14. East Asia Market Analysis and Forecast
    14.1. Introduction / Key Findings
    14.2. Pricing Analysis
    14.3. Historical Market Size (US$ Million) and Volume (Units) Trend Analysis By Market Taxonomy, 2018 to 2022
    14.4. Market Size (US$ Million) and Volume (Units) Forecast By Market Taxonomy, 2023 to 2033
        14.4.1. By Country
            14.4.1.1. China
            14.4.1.2. Japan
            14.4.1.3. South Korea
        14.4.2. By Operation mode
        14.4.3. By Capacity
        14.4.4. By Sales Channel
    14.5. Market Attractiveness Analysis
        14.5.1. By Country
        14.5.2. By Operation mode
        14.5.3. By Capacity
        14.5.4. By Sales Channel
15. South Asia & Oceania Market Analysis and Forecast
    15.1. Introduction / Key Findings
    15.2. Pricing Analysis
    15.3. Historical Market Size (US$ Million) and Volume (Units) Trend Analysis By Market Taxonomy, 2018 to 2022
    15.4. Market Size (US$ Million) and Volume (Units) Forecast By Market Taxonomy, 2023 to 2033
        15.4.1. By Country
            15.4.1.1. India
            15.4.1.2. Thailand
            15.4.1.3. Indonesia
            15.4.1.4. Malaysia
            15.4.1.5. Australia & New Zealand
            15.4.1.6. Rest of South Asia & Oceania
        15.4.2. By Operation mode
        15.4.3. By Capacity
        15.4.4. By Sales Channel
    15.5. Market Attractiveness Analysis
        15.5.1. By Country
        15.5.2. By Operation mode
        15.5.3. By Capacity
        15.5.4. By Sales Channel
16. Middle East & Africa Market Analysis and Forecast
    16.1. Introduction / Key Findings
    16.2. Pricing Analysis
    16.3. Historical Market Size (US$ Million) and Volume (Units) Trend Analysis By Market Taxonomy, 2018 to 2022
    16.4. Market Size (US$ Million) and Volume (Units) Forecast By Market Taxonomy, 2023 to 2033
        16.4.1. By Country
            16.4.1.1. GCC Countries
            16.4.1.2. Turkey
            16.4.1.3. Northern Africa
            16.4.1.4. South Africa
            16.4.1.5. Rest of Middle East and Africa
        16.4.2. By Operation mode
        16.4.3. By Capacity
        16.4.4. By Sales Channel
    16.5. Market Attractiveness Analysis
        16.5.1. By Country
        16.5.2. By Operation mode
        16.5.3. By Capacity
        16.5.4. By Sales Channel
17. Country-level Market Analysis and Forecast
    17.1. Introduction / Key Findings
        17.1.1. Market Value Proportion Analysis, By Key Countries
        17.1.2. Global Vs. Country Growth Comparison
    17.2. US Market Analysis
        17.2.1. Value Proportion Analysis by Market Taxonomy
        17.2.2. Volume (Units) and Value (US$ Million) Analysis and Forecast by Market Taxonomy, 2018 to 2033
            17.2.2.1. By Operation mode
            17.2.2.2. By Capacity
            17.2.2.3. By Sales Channel
    17.3. Canada Market Analysis
        17.3.1. Value Proportion Analysis by Market Taxonomy
        17.3.2. Volume (Units) and Value (US$ Million) Analysis and Forecast by Market Taxonomy, 2018 to 2033
            17.3.2.1. By Operation mode
            17.3.2.2. By Capacity
            17.3.2.3. By Sales Channel
    17.4. Brazil Market Analysis
        17.4.1. Value Proportion Analysis by Market Taxonomy
        17.4.2. Volume (Units) and Value (US$ Million) Analysis and Forecast by Market Taxonomy, 2018 to 2033
            17.4.2.1. By Operation mode
            17.4.2.2. By Capacity
            17.4.2.3. By Sales Channel
    17.5. Mexico Market Analysis
        17.5.1. Value Proportion Analysis by Market Taxonomy
        17.5.2. Volume (Units) and Value (US$ Million) Analysis and Forecast by Market Taxonomy, 2018 to 2033
            17.5.2.1. By Operation mode
            17.5.2.2. By Capacity
            17.5.2.3. By Sales Channel
    17.6. Argentina Market Analysis
        17.6.1. Value Proportion Analysis by Market Taxonomy
        17.6.2. Volume (Units) and Value (US$ Million) Analysis and Forecast by Market Taxonomy, 2018 to 2033
            17.6.2.1. By Operation mode
            17.6.2.2. By Capacity
            17.6.2.3. By Sales Channel
    17.7. Germany Market Analysis
        17.7.1. Value Proportion Analysis by Market Taxonomy
        17.7.2. Volume (Units) and Value (US$ Million) Analysis and Forecast by Market Taxonomy, 2018 to 2033
            17.7.2.1. By Operation mode
            17.7.2.2. By Capacity
            17.7.2.3. By Sales Channel
    17.8. France Market Analysis
        17.8.1. Value Proportion Analysis by Market Taxonomy
        17.8.2. Volume (Units) and Value (US$ Million) Analysis and Forecast by Market Taxonomy, 2018 to 2033
            17.8.2.1. By Operation mode
            17.8.2.2. By Capacity
            17.8.2.3. By Sales Channel
    17.9. Italy Market Analysis
        17.9.1. Value Proportion Analysis by Market Taxonomy
        17.9.2. Volume (Units) and Value (US$ Million) Analysis and Forecast by Market Taxonomy, 2018 to 2033
            17.9.2.1. By Operation mode
            17.9.2.2. By Capacity
            17.9.2.3. By Sales Channel
    17.10. Spain Market Analysis
        17.10.1. Value Proportion Analysis by Market Taxonomy
        17.10.2. Volume (Units) and Value (US$ Million) Analysis and Forecast by Market Taxonomy, 2018 to 2033
            17.10.2.1. By Operation mode
            17.10.2.2. By Capacity
            17.10.2.3. By Sales Channel
    17.11. BENELUX Market Analysis
        17.11.1. Value Proportion Analysis by Market Taxonomy
        17.11.2. Volume (Units) and Value (US$ Million) Analysis and Forecast by Market Taxonomy, 2018 to 2033
            17.11.2.1. By Operation mode
            17.11.2.2. By Capacity
            17.11.2.3. By Sales Channel
    17.12. Russia Market Analysis
        17.12.1. Value Proportion Analysis by Market Taxonomy
        17.12.2. Volume (Units) and Value (US$ Million) Analysis and Forecast by Market Taxonomy, 2018 to 2033
            17.12.2.1. By Operation mode
            17.12.2.2. By Capacity
            17.12.2.3. By Sales Channel
    17.13. United Kingdom Market Analysis
        17.13.1. Value Proportion Analysis by Market Taxonomy
        17.13.2. Volume (Units) and Value (US$ Million) Analysis and Forecast by Market Taxonomy, 2018 to 2033
            17.13.2.1. By Operation mode
            17.13.2.2. By Capacity
            17.13.2.3. By Sales Channel
    17.14. China Market Analysis
        17.14.1. Value Proportion Analysis by Market Taxonomy
        17.14.2. Volume (Units) and Value (US$ Million) Analysis and Forecast by Market Taxonomy, 2018 to 2033
            17.14.2.1. By Operation mode
            17.14.2.2. By Capacity
            17.14.2.3. By Sales Channel
    17.15. Japan Market Analysis
        17.15.1. Value Proportion Analysis by Market Taxonomy
        17.15.2. Volume (Units) and Value (US$ Million) Analysis and Forecast by Market Taxonomy, 2018 to 2033
            17.15.2.1. By Operation mode
            17.15.2.2. By Capacity
            17.15.2.3. By Sales Channel
    17.16. South Korea Market Analysis
        17.16.1. Value Proportion Analysis by Market Taxonomy
        17.16.2. Volume (Units) and Value (US$ Million) Analysis and Forecast by Market Taxonomy, 2018 to 2033
            17.16.2.1. By Operation mode
            17.16.2.2. By Capacity
            17.16.2.3. By Sales Channel
    17.17. India Market Analysis
        17.17.1. Value Proportion Analysis by Market Taxonomy
        17.17.2. Volume (Units) and Value (US$ Million) Analysis and Forecast by Market Taxonomy, 2018 to 2033
            17.17.2.1. By Operation mode
            17.17.2.2. By Capacity
            17.17.2.3. By Sales Channel
    17.18. ASEAN Countries Market Analysis
        17.18.1. Value Proportion Analysis by Market Taxonomy
        17.18.2. Volume (Units) and Value (US$ Million) Analysis and Forecast by Market Taxonomy, 2018 to 2033
            17.18.2.1. By Operation mode
            17.18.2.2. By Capacity
            17.18.2.3. By Sales Channel
    17.19. Australia Market Analysis
        17.19.1. Value Proportion Analysis by Market Taxonomy
        17.19.2. Volume (Units) and Value (US$ Million) Analysis and Forecast by Market Taxonomy, 2018 to 2033
            17.19.2.1. By Operation mode
            17.19.2.2. By Capacity
            17.19.2.3. By Sales Channel
    17.20. GCC Countries Market Analysis
        17.20.1. Value Proportion Analysis by Market Taxonomy
        17.20.2. Volume (Units) and Value (US$ Million) Analysis and Forecast by Market Taxonomy, 2018 to 2033
            17.20.2.1. By Operation mode
            17.20.2.2. By Capacity
            17.20.2.3. By Sales Channel
    17.21. Turkey Market Analysis
        17.21.1. Value Proportion Analysis by Market Taxonomy
        17.21.2. Volume (Units) and Value (US$ Million) Analysis and Forecast by Market Taxonomy, 2018 to 2033
            17.21.2.1. By Operation mode
            17.21.2.2. By Capacity
            17.21.2.3. By Sales Channel
    17.22. South Africa Market Analysis
        17.22.1. Value Proportion Analysis by Market Taxonomy
        17.22.2. Volume (Units) and Value (US$ Million) Analysis and Forecast by Market Taxonomy, 2018 to 2033
            17.22.2.1. By Operation mode
            17.22.2.2. By Capacity
            17.22.2.3. By Sales Channel
18. Market Structure Analysis
    18.1. Market Analysis by Tier of Companies
    18.2. Market Concentration of Players
    18.3. Market Share Analysis of Top Players
    18.4. Market Presence Analysis
19. Competition Analysis
    19.1. Competition Dashboard
    19.2. Competition Benchmarking of Products
    19.3. Competition Deep Dive
        19.3.1. ACTINI GROUP
            19.3.1.1. Overview
            19.3.1.2. Product Portfolio
            19.3.1.3. Key Financials
            19.3.1.4. Sales Footprint
            19.3.1.5. SWOT Analysis
            19.3.1.6. Key Developments
            19.3.1.7. Strategy Overview
        19.3.2. Igreca S.A.
            19.3.2.1. Overview
            19.3.2.2. Product Portfolio
            19.3.2.3. Key Financials
            19.3.2.4. Sales Footprint
            19.3.2.5. SWOT Analysis
            19.3.2.6. Key Developments
            19.3.2.7. Strategy Overview
        19.3.3. Interovo Egg Group B.V.
            19.3.3.1. Overview
            19.3.3.2. Product Portfolio
            19.3.3.3. Key Financials
            19.3.3.4. Sales Footprint
            19.3.3.5. SWOT Analysis
            19.3.3.6. Key Developments
            19.3.3.7. Strategy Overview
        19.3.4. Moba B.V.
            19.3.4.1. Overview
            19.3.4.2. Product Portfolio
            19.3.4.3. Key Financials
            19.3.4.4. Sales Footprint
            19.3.4.5. SWOT Analysis
            19.3.4.6. Key Developments
            19.3.4.7. Strategy Overview
        19.3.5. OVO Tech
            19.3.5.1. Overview
            19.3.5.2. Product Portfolio
            19.3.5.3. Key Financials
            19.3.5.4. Sales Footprint
            19.3.5.5. SWOT Analysis
            19.3.5.6. Key Developments
            19.3.5.7. Strategy Overview
        19.3.6. Ovobel Foods Limited
            19.3.6.1. Overview
            19.3.6.2. Product Portfolio
            19.3.6.3. Key Financials
            19.3.6.4. Sales Footprint
            19.3.6.5. SWOT Analysis
            19.3.6.6. Key Developments
            19.3.6.7. Strategy Overview
        19.3.7. Pelbo S.P.A
            19.3.7.1. Overview
            19.3.7.2. Product Portfolio
            19.3.7.3. Key Financials
            19.3.7.4. Sales Footprint
            19.3.7.5. SWOT Analysis
            19.3.7.6. Key Developments
            19.3.7.7. Strategy Overview
        19.3.8. Professional Eggs Processing Machine Manufacturer
            19.3.8.1. Overview
            19.3.8.2. Product Portfolio
            19.3.8.3. Key Financials
            19.3.8.4. Sales Footprint
            19.3.8.5. SWOT Analysis
            19.3.8.6. Key Developments
            19.3.8.7. Strategy Overview
        19.3.9. Sanovo Technology Group
            19.3.9.1. Overview
            19.3.9.2. Product Portfolio
            19.3.9.3. Key Financials
            19.3.9.4. Sales Footprint
            19.3.9.5. SWOT Analysis
            19.3.9.6. Key Developments
            19.3.9.7. Strategy Overview
        19.3.10. Yash Food Equipment
            19.3.10.1. Overview
            19.3.10.2. Product Portfolio
            19.3.10.3. Key Financials
            19.3.10.4. Sales Footprint
            19.3.10.5. SWOT Analysis
            19.3.10.6. Key Developments
            19.3.10.7. Strategy Overview
        19.3.11. Other Prominent Players
            19.3.11.1. Overview
            19.3.11.2. Product Portfolio
            19.3.11.3. Key Financials
            19.3.11.4. Sales Footprint
            19.3.11.5. SWOT Analysis
            19.3.11.6. Key Developments
            19.3.11.7. Strategy Overview
20. Assumptions & Acronyms Used
21. Research Methodology

Explore Process Automation Insights

View Reports
Future Market Insights

Egg Breaking Machine Market

Schedule a Call