Egg Stabilizer Market Forecast and Outlook 2025 to 2035

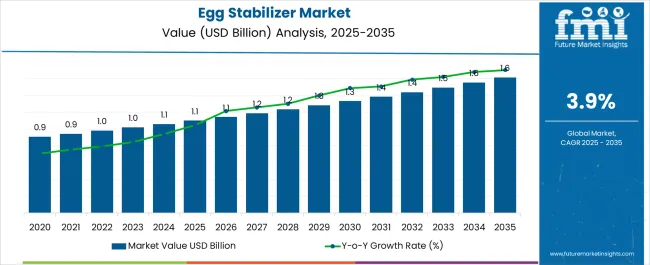
The egg stabilizer market is estimated to be valued at USD 1.1 billion in 2025 and is projected to reach USD 1.6 billion by 2035, registering a compound annual growth rate (CAGR) of 3.9% over the forecast period.
Quick Stats for Egg Stabilizer Market

  • Egg Stabilizer Market Value (2025): USD 1.1 billion
  • Egg Stabilizer Market Forecast Value (2035): USD 1.6 billion
  • Egg Stabilizer Market Forecast CAGR: 3.9%
  • Leading Segment in Egg Stabilizer Market in 2025: Wholesale(65% market share)
  • Key Growth Regions in Egg Stabilizer Market: Asia Pacific, North America, Europe
  • Top Key Players in Egg Stabilizer Market: Cargill Inc., Tate & Lyle, J&K Ingredients, Merck KGaA, Ingredion Incorporated, TIC Gums, Holton Food Products, McCormick and Company, Tártaros Gonzalo Castelló, SL

Egg Stabilizer Market

Metric Value
Estimated Size (2025E) USD 1.1 billion
Projected Value (2035F) USD 1.6 billion
CAGR (2025 to 2035) 3.9%

The egg stabilizer industry is expected to generate an absolute dollar opportunity of USD 500 million from 2025 to 2035. This translates to approximately 1.45x growth over the decade, driven by rising demand for processed food, especially in bakery and dessert segments, where stabilizers enhance texture, consistency, and shelf life.

By 2030, the market is likely to reach approximately USD 1.3 billion, accounting for USD 275 million in incremental value during the first half of the decade. The remaining USD 287 million is expected during the second half, suggesting a steady and balanced growth trend across the forecast period.

Leading players like Cargill, Ingredion, and Tate & Lyle are investing strategically in natural, allergen-free stabilizer solutions. By harnessing advanced emulsion technologies, they aim to improve stability in egg-based formulations. These initiatives align with growing clean-label trends, enabling companies to strengthen their market position and cater to evolving consumer demands for safer, more transparent ingredient profiles.

The egg stabilizer market holds a niche but increasingly vital share across its parent categories. Within the broader food additives market, it accounts for nearly 2.1%, driven by its critical role in emulsification and texture enhancement. In the bakery ingredients segment, it represents approximately 3.7%, supported by its widespread use in cakes, meringues, and desserts. It constitutes around 2.4% of the egg products market, especially in value-added formulations. Within food stabilizers and emulsifiers, its share is close to 2.9%. As clean-label trends gain traction, egg stabilizers are gradually expanding their footprint across functional and processed ingredient sectors.

Consumer preferences are increasingly favoring clean-label, low-allergen, and natural ingredient profiles, prompting a significant shift in stabilizer formulations. This shift is encouraging manufacturers to innovate by incorporating plant-based hydrocolloids, protein concentrates, and customized blends as alternatives to synthetic additives. These clean and functional ingredients are gaining traction, especially in bakery and confectionery products. At the same time, growing demand from ready-to-eat and frozen bakery categories is accelerating market expansion. This growth is further bolstered by improvements in supply chains, along with technological advances in microencapsulation, powder dispersion, and ingredient functionality optimization across diverse food processing applications.

Why is the Egg Stabilizer Market Growing?

The egg stabilizer market is witnessing steady growth due to increasing demand for consistent texture, extended shelf life, and enhanced product stability in processed foods. As the bakery, confectionery, and ready-to-eat food industries expand globally, stabilizers are becoming indispensable for maintaining quality during production, storage, and distribution. Consumer preference for visually appealing and uniform products has further intensified the need for advanced stabilizer systems.

The shift toward clean-label, allergen-free, and natural ingredient solutions is also accelerating innovation in egg stabilizer formulations. Manufacturers are actively replacing synthetic additives with plant-based or minimally processed alternatives to meet evolving regulatory and consumer expectations. Rising consumption of convenience foods, particularly in urban areas, continues to drive demand across commercial baking and dessert segments.

With food manufacturers increasingly focusing on formulation efficiency, quality control, and label transparency, egg stabilizers are emerging as essential components in modern food processing, supporting sustained market expansion over the coming decade.

Egg Stabilizer Market Analysis by Top Investment Segment

The market is segmented by type, distribution channel, and region. By type, the market includes cream of tartar, starch & derivatives, sugar, and gums. Based on distribution channels, the market is divided into wholesale, online retailers, supermarkets, and specialty stores. Regionally, the market is classified into North America, Latin America, Europe, East Asia, South Asia, Oceania, and the Middle East & Africa.

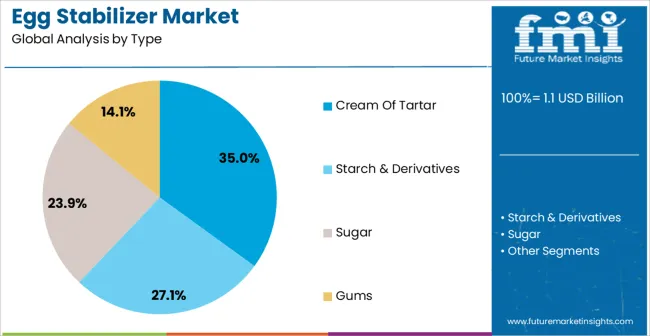
By Type, Starch & Derivatives Account for 42% of the Market Share

Egg Stabilizer Market By Type

Starch & derivatives hold the dominant 42% share in the type category, fueled by their multifunctional role in thickening, stabilizing, and texturizing across various food products. These ingredients are particularly favored in bakery and dessert formulations for their ability to create consistent viscosity and improve mouthfeel. Their affordability, compatibility with other ingredients, and ease of processing further elevate their appeal for large-scale food manufacturers. Modified starches, including pregelatinized and cross-linked variants, are increasingly used to withstand heat and shear during production processes.

The segment also benefits from its clean-label potential, especially as food-grade starches derived from corn, tapioca, and potato align with consumer demands for natural and familiar ingredients. Manufacturers are also investing in enzymatically processed starches and hybrid blends to meet specific performance and regulatory needs. With the rise of gluten-free, allergen-free, and plant-based formulations, starch & derivatives are expected to remain a cornerstone of innovation and volume-driven growth across the egg stabilizer landscape.

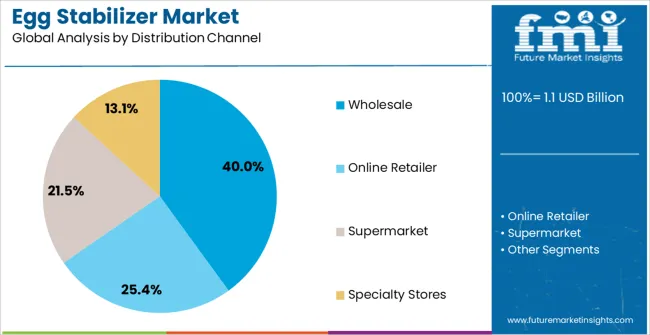
By Distribution Channel, Wholesale Accounts for 65% of the Market Share

Egg Stabilizer Market By Distribution

Wholesale distribution leads the channel segment with a commanding 65% market share, underpinned by its strong penetration into the B2B landscape. This includes bakery chains, commercial kitchens, food processors, and institutional buyers who purchase egg stabilizers in bulk for consistent and scalable food production. Wholesale allows for cost efficiencies, centralized procurement, and easier logistics integration, especially vital for manufacturers operating under high-volume and time-sensitive conditions.

The segment’s dominance is further reinforced by supplier partnerships, private labeling, and long-term contracts that ensure stability in pricing and supply. Wholesale distributors also serve as essential intermediaries for specialty stabilizer blends customized for specific food applications. While online and direct-to-store channels are growing, wholesale continues to capture the lion’s share due to its entrenched role in the commercial food supply chain. As industrial food production scales globally, wholesale distribution will remain a critical enabler of operational efficiency and consistent ingredient availability.

What are the Drivers, Restraints, and Key Trends of the Egg Stabilizer Market?

In 2024, global egg stabilizer consumption increased by 21% year-on-year, with Europe accounting for 36% of total demand. Applications span bakery, confectionery, sauces, and ready-to-eat meals, where stabilizers ensure consistent texture, aeration, and shelf life. Manufacturers are launching multifunctional stabilizer blends that combine hydrocolloids, proteins, and enzymes to deliver improved structural integrity and moisture retention. Clean-label solutions are being developed to support transparent ingredient lists in premium segments. Food processors are also sourcing pre-formulated stabilizer systems designed for high-output automated lines to reduce formulation complexity and production errors.

Functional and Quality Enhancement Benefits Fuel Egg Stabilizer Use

Bakery and processed food manufacturers are incorporating egg stabilizers to improve product volume, texture, and consistency across large-scale production runs. Testing shows that stabilizers can reduce sponge cake collapse by up to 42% and extend freshness retention by 2-3 days compared to non-stabilized versions. In mayonnaise and dessert applications, they enhance viscosity control and heat tolerance, ensuring stable emulsions under varied processing and storage conditions. Freeze-thaw stability improvements of up to 55% have expanded usage into frozen bakery and dessert lines. Adoption rates in industrial bakery applications grew 27% in 2024 across Europe and Asia, driven by demands for uniform quality and reduced wastage.

Price Volatility, Regulatory Barriers and Handling Requirements Restrain Growth

Expansion is hindered by egg powder price fluctuations, ranging from $4,200 to $5,800 per metric ton in 2024 due to seasonal supply variations and poultry disease outbreaks. These shifts can raise finished product costs by 8-12% for commercial bakery operations. Dosage optimization is product-specific, requiring extended R&D and testing cycles that slow commercialization timelines. Compliance with regional additive regulations, such as EU restrictions on certain hydrocolloids, can add up to 9 months for approval processes. Specialized storage, particularly for blends containing temperature-sensitive enzymes, increases logistics costs by 10-15% compared to standard bakery ingredients. Limited production capacity for custom formulations further constrains scalability in emerging markets.

Egg Stabilizer Market Analysis by Top Countries

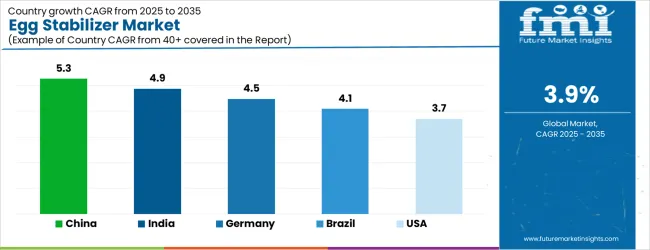
Egg Stabilizer Market By Country

Countries CAGR (2025 to 2035)
United Kingdom 4.1%
United States 3.8%
Germany 3.3%
France 3.1%
Japan 2.6%

Among the top five nations analyzed, the UK is forecast to lead the egg stabilizer market with a CAGR of 4.1%, reflecting strong innovation in bakery and clean-label food solutions. The USA follows closely at 3.8%, driven by its scale of industrial food production and rising demand for stabilizers in convenience foods. Germany (3.3%) and France (3.1%) demonstrate moderate growth amid well-regulated food industries and a high demand for consistency in bakery and confectionery products. Japan, with a more mature market, is projected to expand at 2.6%, supported by innovation in functional and compact food formulations.

The report covers an in-depth analysis of 40+ countries; five top-performing OECD countries are highlighted below.

Future Outlook of Egg Stabilizer Market in the United Kingdom

The revenue from egg stabilizers in the UK is projected to grow at a CAGR of 4.1%, the highest among the top five countries. The growth is supported by a dynamic food processing industry with a strong focus on clean-label trends, natural ingredients, and vegan-friendly formulations. The popularity of premium bakery products, combined with sustainability-driven consumer behavior, continues to boost the adoption of plant-based stabilizers. Regulatory alignment with EU standards also aids in uniform quality benchmarks and clean ingredient labeling.

  • Plant-based bakery trends drive demand for alternative stabilizers.
  • Premium bakery and patisserie sectors promote product differentiation.
  • Regulatory clarity supports the growth of clean-label stabilizer offerings.

Growth Analysis of Egg Stabilizer Market in the United States

The egg stabilizer market in the USA is anticipated to expand at a CAGR of 3.8% from 2025 to 2035. This growth is fueled by the booming bakery, dessert, and ready-to-eat food segments, where stabilizers are vital for maintaining structure and shelf life. Manufacturers are investing in natural and modified starch-based solutions to cater to clean-label and allergen-sensitive consumer groups. The expanding frozen food category also supports the uptake of stabilizers, particularly in large-scale food production chains.

  • Clean-label stabilizers cater to demand from health-conscious consumers.
  • High adoption in frozen and convenience food manufacturing.
  • R&D in plant-based stabilizers accelerates innovation in the USA market.

Demand Forecast for Egg Stabilizers in Germany

The sales of egg stabilizers in Germany are anticipated to flourish at a CAGR of 3.3%between 2025 and 2035. This growth is driven by Germany’s advanced bakery sector, which demands consistent quality and texture, particularly in organic and artisanal products. The strong emphasis on food safety and ingredient traceability also encourages the use of high-performance stabilizer systems. Rising consumer demand for functional bakery goods with natural additives is reshaping product development strategies.

  • Organic food processing drives innovation in clean stabilizer blends.
  • High-tech baking operations adopt stabilizers for consistent output.
  • Regulatory rigor boosts demand for traceable, certified additives.

Analysis of the Egg Stabilizer Market in France

The demand for egg stabilizers in France is set to expand at a CAGR of 3.1%, supported by the country’s gourmet food culture and premium pastry segment. French consumers value texture and sensory attributes in food, prompting strong demand for stabilizers that ensure product consistency. The growth of frozen and artisanal baked goods further necessitates the use of egg stabilizers to enhance shelf life and aesthetic appeal. Manufacturers are responding by formulating with natural thickeners and minimal processing methods.

  • Artisanal bakery trends enhance stabilizer usage in niche formats.
  • Frozen dessert and pastry products demand extended stability.
  • Clean-label innovation aligns with evolving consumer preferences.

Growth Outlook for Egg Stabilizer Market in Japan

The egg stabilizer market in Japan is forecast to strengthen at a CAGR of 2.6%, reflecting stable but slower growth due to market maturity. However, innovation in compact food formats, especially in confectionery and ready-to-eat meals, supports consistent demand. The preference for functional ingredients with subtle textural benefits aligns with the use of advanced stabilizer systems. Local producers are incorporating traditional Japanese ingredients with modern stabilizers for hybrid applications.

  • Compact, portion-controlled foods drive stabilizer use.
  • Hybrid blends integrate local flavors and modern texture agents.
  • Clean-label trends gradually influence mainstream formulations.

Competitive Landscape of Egg Stabilizer Market

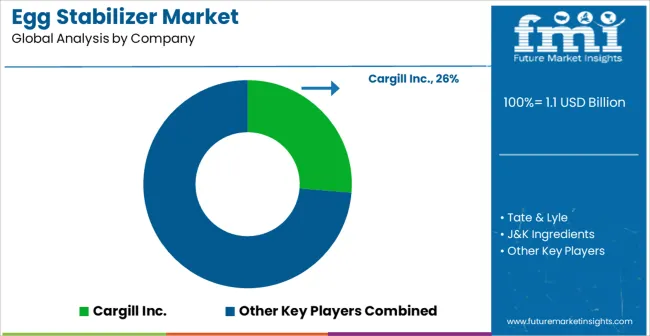
Egg Stabilizer Market By Company

The egg stabilizer industry is moderately consolidated, with global ingredient leaders setting the pace. Key players such as Cargill, Tate & Lyle, Ingredion, ADM, Kerry Group, J&K Ingredients, Holton Food Products, and T&E Prime Food dominate through broad portfolios and advanced technical capabilities. These firms leverage robust supply chains and in-house R&D to deliver tailored stabilizer systems for bakery, confectionery, dairy, and processed food applications.

Product differentiation is a major strategic lever. Companies like Ingredion focus on starch-based systems with improved heat, pH, and freeze-thaw stability, while others are shifting toward clean-label and natural formulations to meet rising consumer demand. Blends incorporating plant-based gums, enzymes, or hydrocolloids are gaining traction, offering both functional benefits and label-friendly claims.

Strategic collaborations, partnerships with food processors, and acquisitions of niche firms help incumbents expand their geographical footprint and strengthen innovation pipelines. Multinationals are actively investing in custom formulation labs and regional production hubs to serve localized needs with greater agility.

The market presents moderate entry barriers. Established brands benefit from technical know-how, global regulatory compliance, and long-standing relationships with food manufacturers. New entrants face the challenge of building formulation expertise and navigating complex food safety certifications, but demand for specialty blends and sustainable solutions is opening space for agile niche providers.

Competition increasingly hinges on the ability to combine stabilizing performance with transparency, traceability, and minimal processing. Players capable of offering high-functioning stabilizers aligned with evolving consumer expectations, such as vegan, non-GMO, and additive-free claims- are expected to outperform. As the food industry advances toward cleaner formulations without compromising functionality, innovation and agility will remain the cornerstones of competitive advantage.

Scope of Report

Item Value
Quantitative Units USD 1.1 Billion
Type Cream of Tartar, Starch & Derivatives, Sugar, Gums
Distribution Channel Wholesale, Online Retailer, Supermarket, Specialty Stores
Regions Covered North America, Latin America, Europe, East Asia, South Asia, Oceania, and the Middle East and Africa
Country Covered United States, Canada, United Kingdom, Germany, France, China, Japan, South Korea, Brazil, Australia and 40+ countries
Key Companies Profiled Cargill Inc., Tate & Lyle, J&K Ingredients, Merck KGaA, Ingredion Incorporated, TIC Gums, Holton Food Products, McCormick and Company, Tártaros Gonzalo Castelló, SL
Additional Attributes Dollar sales by application and purity grade, regional demand trends, competitive landscape, consumer preferences for natural versus synthetic alternatives, integration with sustainable sourcing practices, innovations in extraction technology and quality standardization for diverse industrial applications

Key Segments

By Type:

  • Cream of Tartar
  • Starch & Derivatives
  • Sugar
  • Gums

By Distribution Channel:

  • Wholesale
  • Online Retailer
  • Supermarket
  • Specialty Stores

By Region:

  • North America
  • Latin America
  • Western Europe
  • Eastern Europe
  • East Asia
  • South Asia & Pacific
  • Middle East and Africa

Table of Content

  1. Executive Summary
    • Global Market Outlook
    • Demand-side Trends
    • Supply-side Trends
    • Technology Roadmap Analysis
    • Analysis and Recommendations
  2. Market Overview
    • Market Coverage / Taxonomy
    • Market Definition / Scope / Limitations
  3. Market Background
    • Market Dynamics
      • Drivers
      • Restraints
      • Opportunity
      • Trends
    • Scenario Forecast
      • Demand in Optimistic Scenario
      • Demand in Likely Scenario
      • Demand in Conservative Scenario
    • Opportunity Map Analysis
    • Product Life Cycle Analysis
    • Supply Chain Analysis
      • Supply Side Participants and their Roles
        • Producers
        • Mid-Level Participants (Traders/ Agents/ Brokers)
        • Wholesalers and Distributors
      • Value Added and Value Created at Node in the Supply Chain
      • List of Raw Material Suppliers
      • List of Existing and Potential Buyer’s
    • Investment Feasibility Matrix
    • Value Chain Analysis
      • Profit Margin Analysis
      • Wholesalers and Distributors
      • Retailers
    • PESTLE and Porter’s Analysis
    • Regulatory Landscape
      • By Key Regions
      • By Key Countries
    • Regional Parent Market Outlook
    • Production and Consumption Statistics
    • Import and Export Statistics
  4. Global Market Analysis 2020 to 2024 and Forecast, 2025 to 2035
    • Historical Market Size Value (USD Billion) & Volume (Metric Tons) Analysis, 2020 to 2024
    • Current and Future Market Size Value (USD Billion) & Volume (Metric Tons) Projections, 2025 to 2035
      • Y-o-Y Growth Trend Analysis
      • Absolute $ Opportunity Analysis
  5. Global Market Pricing Analysis 2020 to 2024 and Forecast 2025 to 2035
  6. Global Market Analysis 2020 to 2024 and Forecast 2025 to 2035, By Type
    • Introduction / Key Findings
    • Historical Market Size Value (USD Billion) & Volume (Metric Tons) Analysis By Type, 2020 to 2024
    • Current and Future Market Size Value (USD Billion) & Volume (Metric Tons) Analysis and Forecast By Type, 2025 to 2035
      • Cream of Tartar
      • Starch & Derivatives
      • Sugar
      • Gums
    • Y-o-Y Growth Trend Analysis By Type, 2020 to 2024
    • Absolute $ Opportunity Analysis By Type, 2025 to 2035
  7. Global Market Analysis 2020 to 2024 and Forecast 2025 to 2035, By Distribution Channel
    • Introduction / Key Findings
    • Historical Market Size Value (USD Billion) & Volume (Metric Tons) Analysis By Distribution Channel, 2020 to 2024
    • Current and Future Market Size Value (USD Billion) & Volume (Metric Tons) Analysis and Forecast By Distribution Channel, 2025 to 2035
      • Wholesale
      • Online Retailer
      • Supermarket
      • Specialty Stores
    • Y-o-Y Growth Trend Analysis By Distribution Channel, 2020 to 2024
    • Absolute $ Opportunity Analysis By Distribution Channel, 2025 to 2035
  8. Global Market Analysis 2020 to 2024 and Forecast 2025 to 2035, By Region
    • Introduction
    • Historical Market Size Value (USD Billion) & Volume (Metric Tons) Analysis By Region, 2020 to 2024
    • Current Market Size Value (USD Billion) & Volume (Metric Tons) Analysis and Forecast By Region, 2025 to 2035
      • North America
      • Latin America
      • Western Europe
      • Eastern Europe
      • East Asia
      • South Asia & Pacific
      • Middle East and Africa
    • Market Attractiveness Analysis By Region
  9. North America Market Analysis 2020 to 2024 and Forecast 2025 to 2035, By Country
    • Historical Market Size Value (USD Billion) & Volume (Metric Tons) Trend Analysis By Market Taxonomy, 2020 to 2024
    • Market Size Value (USD Billion) & Volume (Metric Tons) Forecast By Market Taxonomy, 2025 to 2035
      • By Country
        • USA
        • Canada
        • Mexico
      • By Type
      • By Distribution Channel
    • Market Attractiveness Analysis
      • By Country
      • By Type
      • By Distribution Channel
    • Key Takeaways
  10. Latin America Market Analysis 2020 to 2024 and Forecast 2025 to 2035, By Country
    • Historical Market Size Value (USD Billion) & Volume (Metric Tons) Trend Analysis By Market Taxonomy, 2020 to 2024
    • Market Size Value (USD Billion) & Volume (Metric Tons) Forecast By Market Taxonomy, 2025 to 2035
      • By Country
        • Brazil
        • Argentina
        • Rest of LATAM
      • By Type
      • By Distribution Channel
    • Market Attractiveness Analysis
      • By Country
      • By Type
      • By Distribution Channel
    • Key Takeaways
  11. Western Market Analysis 2020 to 2024 and Forecast 2025 to 2035, By Country
    • Historical Market Size Value (USD Billion) & Volume (Metric Tons) Trend Analysis By Market Taxonomy, 2020 to 2024
    • Market Size Value (USD Billion) & Volume (Metric Tons) Forecast By Market Taxonomy, 2025 to 2035
      • By Country
        • Germany
        • Italy
        • France
        • UK
        • Spain
        • BENELUX
        • Nordic
        • Rest of W.Europe
      • By Type
      • By Distribution Channel
    • Market Attractiveness Analysis
      • By Country
      • By Type
      • By Distribution Channel
    • Key Takeaways
  12. Eastern Market Analysis 2020 to 2024 and Forecast 2025 to 2035, By Country
    • Historical Market Size Value (USD Billion) & Volume (Metric Tons) Trend Analysis By Market Taxonomy, 2020 to 2024
    • Market Size Value (USD Billion) & Volume (Metric Tons) Forecast By Market Taxonomy, 2025 to 2035
      • By Country
        • Russia
        • Hungary
        • Poland
        • Balkan & Baltics
        • Rest of E. Europe
      • By Type
      • By Distribution Channel
    • Market Attractiveness Analysis
      • By Country
      • By Type
      • By Distribution Channel
    • Key Takeaways
  13. East Asia Market Analysis 2020 to 2024 and Forecast 2025 to 2035, By Country
    • Historical Market Size Value (USD Billion) & Volume (Metric Tons) Trend Analysis By Market Taxonomy, 2020 to 2024
    • Market Size Value (USD Billion) & Volume (Metric Tons) Forecast By Market Taxonomy, 2025 to 2035
      • By Country
        • China
        • Japan
        • South Korea
      • By Type
      • By Distribution Channel
    • Market Attractiveness Analysis
      • By Country
      • By Type
      • By Distribution Channel
    • Key Takeaways
  14. South Asia & Pacific Market Analysis 2020 to 2024 and Forecast 2025 to 2035, By Country
    • Historical Market Size Value (USD Billion) & Volume (Metric Tons) Trend Analysis By Market Taxonomy, 2020 to 2024
    • Market Size Value (USD Billion) & Volume (Metric Tons) Forecast By Market Taxonomy, 2025 to 2035
      • By Country
        • India
        • Australia & New Zealand
        • ASEAN
        • Rest of SAP
      • By Type
      • By Distribution Channel
    • Market Attractiveness Analysis
      • By Country
      • By Type
      • By Distribution Channel
    • Key Takeaways
  15. Middle East and Africa Market Analysis 2020 to 2024 and Forecast 2025 to 2035, By Country
    • Historical Market Size Value (USD Billion) & Volume (Metric Tons) Trend Analysis By Market Taxonomy, 2020 to 2024
    • Market Size Value (USD Billion) & Volume (Metric Tons) Forecast By Market Taxonomy, 2025 to 2035
      • By Country
        • GCC Countries
        • Northern Africa
        • South Africa
        • Turkiye
        • Rest of MEA
      • By Type
      • By Distribution Channel
    • Market Attractiveness Analysis
      • By Country
      • By Type
      • By Distribution Channel
    • Key Takeaways
  16. Key Countries Market Analysis
    • USA
      • Pricing Analysis
      • Market Share Analysis, 2024
        • By Type
        • By Distribution Channel
    • Canada
      • Pricing Analysis
      • Market Share Analysis, 2024
        • By Type
        • By Distribution Channel
    • Brazil
      • Pricing Analysis
      • Market Share Analysis, 2024
        • By Type
        • By Distribution Channel
    • Mexico
      • Pricing Analysis
      • Market Share Analysis, 2024
        • By Type
        • By Distribution Channel
    • Argentina
      • Pricing Analysis
      • Market Share Analysis, 2024
        • By Type
        • By Distribution Channel
  17. Market Structure Analysis
    • Competition Dashboard
    • Competition Benchmarking
    • Market Share Analysis of Top Players
      • By Regional
      • By Type
      • By Distribution Channel
  18. Competition Analysis
    • Competition Deep Dive
      • Cargill Inc.
        • Overview
        • Product Portfolio
        • Profitability by Market Segments (Product/Age /Sales Channel/Region)
        • Sales Footprint
        • Strategy Overview
          • Marketing Strategy
          • Product Strategy
          • Channel Strategy
      • Tate & Lyle
        • Overview
        • Product Portfolio
        • Profitability by Market Segments (Product/Age /Sales Channel/Region)
        • Sales Footprint
        • Strategy Overview
          • Marketing Strategy
          • Product Strategy
          • Channel Strategy
      • J&K Ingredients
        • Overview
        • Product Portfolio
        • Profitability by Market Segments (Product/Age /Sales Channel/Region)
        • Sales Footprint
        • Strategy Overview
          • Marketing Strategy
          • Product Strategy
          • Channel Strategy
      • Merck KGaA
        • Overview
        • Product Portfolio
        • Profitability by Market Segments (Product/Age /Sales Channel/Region)
        • Sales Footprint
        • Strategy Overview
          • Marketing Strategy
          • Product Strategy
          • Channel Strategy
      • Ingredion Incorporated
        • Overview
        • Product Portfolio
        • Profitability by Market Segments (Product/Age /Sales Channel/Region)
        • Sales Footprint
        • Strategy Overview
          • Marketing Strategy
          • Product Strategy
          • Channel Strategy
      • TIC Gums
        • Overview
        • Product Portfolio
        • Profitability by Market Segments (Product/Age /Sales Channel/Region)
        • Sales Footprint
        • Strategy Overview
          • Marketing Strategy
          • Product Strategy
          • Channel Strategy
      • Holton Food Products
        • Overview
        • Product Portfolio
        • Profitability by Market Segments (Product/Age /Sales Channel/Region)
        • Sales Footprint
        • Strategy Overview
          • Marketing Strategy
          • Product Strategy
          • Channel Strategy
      • McCormick and Company
        • Overview
        • Product Portfolio
        • Profitability by Market Segments (Product/Age /Sales Channel/Region)
        • Sales Footprint
        • Strategy Overview
          • Marketing Strategy
          • Product Strategy
          • Channel Strategy
      • Tártaros Gonzalo Castelló, SL
        • Overview
        • Product Portfolio
        • Profitability by Market Segments (Product/Age /Sales Channel/Region)
        • Sales Footprint
        • Strategy Overview
          • Marketing Strategy
          • Product Strategy
          • Channel Strategy
  19. Assumptions & Acronyms Used
  20. Research Methodology

List of Tables

  • Table 1: Global Market Value (USD Billion) Forecast by Region, 2020-2035
  • Table 2: Global Market Volume (Metric Tons) Forecast by Region, 2020-2035
  • Table 3: Global Market Value (USD Billion) Forecast by Type, 2020-2035
  • Table 4: Global Market Volume (Metric Tons) Forecast by Type, 2020-2035
  • Table 5: Global Market Value (USD Billion) Forecast by Distribution Channel, 2020-2035
  • Table 6: Global Market Volume (Metric Tons) Forecast by Distribution Channel, 2020-2035
  • Table 7: North America Market Value (USD Billion) Forecast by Country, 2020-2035
  • Table 8: North America Market Volume (Metric Tons) Forecast by Country, 2020-2035
  • Table 9: North America Market Value (USD Billion) Forecast by Type, 2020-2035
  • Table 10: North America Market Volume (Metric Tons) Forecast by Type, 2020-2035
  • Table 11: North America Market Value (USD Billion) Forecast by Distribution Channel, 2020-2035
  • Table 12: North America Market Volume (Metric Tons) Forecast by Distribution Channel, 2020-2035
  • Table 13: Latin America Market Value (USD Billion) Forecast by Country, 2020-2035
  • Table 14: Latin America Market Volume (Metric Tons) Forecast by Country, 2020-2035
  • Table 15: Latin America Market Value (USD Billion) Forecast by Type, 2020-2035
  • Table 16: Latin America Market Volume (Metric Tons) Forecast by Type, 2020-2035
  • Table 17: Latin America Market Value (USD Billion) Forecast by Distribution Channel, 2020-2035
  • Table 18: Latin America Market Volume (Metric Tons) Forecast by Distribution Channel, 2020-2035
  • Table 19: Western Europe Market Value (USD Billion) Forecast by Country, 2020-2035
  • Table 20: Western Europe Market Volume (Metric Tons) Forecast by Country, 2020-2035
  • Table 21: Western Europe Market Value (USD Billion) Forecast by Type, 2020-2035
  • Table 22: Western Europe Market Volume (Metric Tons) Forecast by Type, 2020-2035
  • Table 23: Western Europe Market Value (USD Billion) Forecast by Distribution Channel, 2020-2035
  • Table 24: Western Europe Market Volume (Metric Tons) Forecast by Distribution Channel, 2020-2035
  • Table 25: Eastern Europe Market Value (USD Billion) Forecast by Country, 2020-2035
  • Table 26: Eastern Europe Market Volume (Metric Tons) Forecast by Country, 2020-2035
  • Table 27: Eastern Europe Market Value (USD Billion) Forecast by Type, 2020-2035
  • Table 28: Eastern Europe Market Volume (Metric Tons) Forecast by Type, 2020-2035
  • Table 29: Eastern Europe Market Value (USD Billion) Forecast by Distribution Channel, 2020-2035
  • Table 30: Eastern Europe Market Volume (Metric Tons) Forecast by Distribution Channel, 2020-2035
  • Table 31: East Asia Market Value (USD Billion) Forecast by Country, 2020-2035
  • Table 32: East Asia Market Volume (Metric Tons) Forecast by Country, 2020-2035
  • Table 33: East Asia Market Value (USD Billion) Forecast by Type, 2020-2035
  • Table 34: East Asia Market Volume (Metric Tons) Forecast by Type, 2020-2035
  • Table 35: East Asia Market Value (USD Billion) Forecast by Distribution Channel, 2020-2035
  • Table 36: East Asia Market Volume (Metric Tons) Forecast by Distribution Channel, 2020-2035
  • Table 37: South Asia & Pacific Market Value (USD Billion) Forecast by Country, 2020-2035
  • Table 38: South Asia & Pacific Market Volume (Metric Tons) Forecast by Country, 2020-2035
  • Table 39: South Asia & Pacific Market Value (USD Billion) Forecast by Type, 2020-2035
  • Table 40: South Asia & Pacific Market Volume (Metric Tons) Forecast by Type, 2020-2035
  • Table 41: South Asia & Pacific Market Value (USD Billion) Forecast by Distribution Channel, 2020-2035
  • Table 42: South Asia & Pacific Market Volume (Metric Tons) Forecast by Distribution Channel, 2020-2035
  • Table 43: Middle East and Africa Market Value (USD Billion) Forecast by Country, 2020-2035
  • Table 44: Middle East and Africa Market Volume (Metric Tons) Forecast by Country, 2020-2035
  • Table 45: Middle East and Africa Market Value (USD Billion) Forecast by Type, 2020-2035
  • Table 46: Middle East and Africa Market Volume (Metric Tons) Forecast by Type, 2020-2035
  • Table 47: Middle East and Africa Market Value (USD Billion) Forecast by Distribution Channel, 2020-2035
  • Table 48: Middle East and Africa Market Volume (Metric Tons) Forecast by Distribution Channel, 2020-2035

List of Figures

  • Figure 1: Global Market Volume (Metric Tons) Forecast 2020-2035
  • Figure 2: Global Market Pricing Analysis
  • Figure 3: Global Market Value (USD Billion) Forecast 2020-2035
  • Figure 4: Global Market Value Share and BPS Analysis by Type, 2025 and 2035
  • Figure 5: Global Market Y-o-Y Growth Comparison by Type, 2025-2035
  • Figure 6: Global Market Attractiveness Analysis by Type
  • Figure 7: Global Market Value Share and BPS Analysis by Distribution Channel, 2025 and 2035
  • Figure 8: Global Market Y-o-Y Growth Comparison by Distribution Channel, 2025-2035
  • Figure 9: Global Market Attractiveness Analysis by Distribution Channel
  • Figure 10: Global Market Value (USD Billion) Share and BPS Analysis by Region, 2025 and 2035
  • Figure 11: Global Market Y-o-Y Growth Comparison by Region, 2025-2035
  • Figure 12: Global Market Attractiveness Analysis by Region
  • Figure 13: North America Market Incremental $ Opportunity, 2025-2035
  • Figure 14: Latin America Market Incremental $ Opportunity, 2025-2035
  • Figure 15: Western Europe Market Incremental $ Opportunity, 2025-2035
  • Figure 16: Eastern Europe Market Incremental $ Opportunity, 2025-2035
  • Figure 17: East Asia Market Incremental $ Opportunity, 2025-2035
  • Figure 18: South Asia & Pacific Market Incremental $ Opportunity, 2025-2035
  • Figure 19: Middle East and Africa Market Incremental $ Opportunity, 2025-2035
  • Figure 20: North America Market Value Share and BPS Analysis by Country, 2025 and 2035
  • Figure 21: North America Market Value Share and BPS Analysis by Type, 2025 and 2035
  • Figure 22: North America Market Y-o-Y Growth Comparison by Type, 2025-2035
  • Figure 23: North America Market Attractiveness Analysis by Type
  • Figure 24: North America Market Value Share and BPS Analysis by Distribution Channel, 2025 and 2035
  • Figure 25: North America Market Y-o-Y Growth Comparison by Distribution Channel, 2025-2035
  • Figure 26: North America Market Attractiveness Analysis by Distribution Channel
  • Figure 27: Latin America Market Value Share and BPS Analysis by Country, 2025 and 2035
  • Figure 28: Latin America Market Value Share and BPS Analysis by Type, 2025 and 2035
  • Figure 29: Latin America Market Y-o-Y Growth Comparison by Type, 2025-2035
  • Figure 30: Latin America Market Attractiveness Analysis by Type
  • Figure 31: Latin America Market Value Share and BPS Analysis by Distribution Channel, 2025 and 2035
  • Figure 32: Latin America Market Y-o-Y Growth Comparison by Distribution Channel, 2025-2035
  • Figure 33: Latin America Market Attractiveness Analysis by Distribution Channel
  • Figure 34: Western Europe Market Value Share and BPS Analysis by Country, 2025 and 2035
  • Figure 35: Western Europe Market Value Share and BPS Analysis by Type, 2025 and 2035
  • Figure 36: Western Europe Market Y-o-Y Growth Comparison by Type, 2025-2035
  • Figure 37: Western Europe Market Attractiveness Analysis by Type
  • Figure 38: Western Europe Market Value Share and BPS Analysis by Distribution Channel, 2025 and 2035
  • Figure 39: Western Europe Market Y-o-Y Growth Comparison by Distribution Channel, 2025-2035
  • Figure 40: Western Europe Market Attractiveness Analysis by Distribution Channel
  • Figure 41: Eastern Europe Market Value Share and BPS Analysis by Country, 2025 and 2035
  • Figure 42: Eastern Europe Market Value Share and BPS Analysis by Type, 2025 and 2035
  • Figure 43: Eastern Europe Market Y-o-Y Growth Comparison by Type, 2025-2035
  • Figure 44: Eastern Europe Market Attractiveness Analysis by Type
  • Figure 45: Eastern Europe Market Value Share and BPS Analysis by Distribution Channel, 2025 and 2035
  • Figure 46: Eastern Europe Market Y-o-Y Growth Comparison by Distribution Channel, 2025-2035
  • Figure 47: Eastern Europe Market Attractiveness Analysis by Distribution Channel
  • Figure 48: East Asia Market Value Share and BPS Analysis by Country, 2025 and 2035
  • Figure 49: East Asia Market Value Share and BPS Analysis by Type, 2025 and 2035
  • Figure 50: East Asia Market Y-o-Y Growth Comparison by Type, 2025-2035
  • Figure 51: East Asia Market Attractiveness Analysis by Type
  • Figure 52: East Asia Market Value Share and BPS Analysis by Distribution Channel, 2025 and 2035
  • Figure 53: East Asia Market Y-o-Y Growth Comparison by Distribution Channel, 2025-2035
  • Figure 54: East Asia Market Attractiveness Analysis by Distribution Channel
  • Figure 55: South Asia & Pacific Market Value Share and BPS Analysis by Country, 2025 and 2035
  • Figure 56: South Asia & Pacific Market Value Share and BPS Analysis by Type, 2025 and 2035
  • Figure 57: South Asia & Pacific Market Y-o-Y Growth Comparison by Type, 2025-2035
  • Figure 58: South Asia & Pacific Market Attractiveness Analysis by Type
  • Figure 59: South Asia & Pacific Market Value Share and BPS Analysis by Distribution Channel, 2025 and 2035
  • Figure 60: South Asia & Pacific Market Y-o-Y Growth Comparison by Distribution Channel, 2025-2035
  • Figure 61: South Asia & Pacific Market Attractiveness Analysis by Distribution Channel
  • Figure 62: Middle East and Africa Market Value Share and BPS Analysis by Country, 2025 and 2035
  • Figure 63: Middle East and Africa Market Value Share and BPS Analysis by Type, 2025 and 2035
  • Figure 64: Middle East and Africa Market Y-o-Y Growth Comparison by Type, 2025-2035
  • Figure 65: Middle East and Africa Market Attractiveness Analysis by Type
  • Figure 66: Middle East and Africa Market Value Share and BPS Analysis by Distribution Channel, 2025 and 2035
  • Figure 67: Middle East and Africa Market Y-o-Y Growth Comparison by Distribution Channel, 2025-2035
  • Figure 68: Middle East and Africa Market Attractiveness Analysis by Distribution Channel
  • Figure 69: Global Market - Tier Structure Analysis
  • Figure 70: Global Market - Company Share Analysis

Frequently Asked Questions

How big is the egg stabilizer market in 2025?

The global egg stabilizer market is estimated to be valued at USD 1.1 billion in 2025.

What will be the size of the egg stabilizer market in 2035?

The market size for the egg stabilizer market is projected to reach USD 1.6 billion by 2035.

How much will be the egg stabilizer market growth between 2025 and 2035?

The egg stabilizer market is expected to grow at a 3.9% CAGR between 2025 and 2035.

Which type segment is projected to lead in the egg stabilizer market in 2025?

The starch & derivatives segment is projected to lead in the egg stabilizer market with 42% market share in 2025.

Which distribution channel is set to contribute significant share in the egg stabilizer market in 2025?

In terms of distribution channel, the wholesale segment is expected to command 65% share in the egg stabilizer market in 2025.

Explore Similar Insights

Future Market Insights

Egg Stabilizer Market