Reports
- Global Locations -
Headquarters
Future Market Insights, Inc.
Christiana Corporate, 200
Continental Drive, Suite 401,
Newark, Delaware - 19713,
United States
Americas
Future Market Insights, Inc.
616 Corporate Way, Suite 2-9018,
Valley Cottage, NY 10989, United States
MEA
Future Market Insights
1602-6 Jumeirah Bay X2 Tower, Plot No: JLT-PH2-X2A,
Jumeirah Lakes Towers, Dubai,
United Arab Emirates
Europe
Future Market Insights
3rd Floor, 207 Regent Street,
W1B 3HH London
United Kingdom
Asia Pacific
Future Market Insights
Office No. 401-A, 4th Floor,
VANTAGE 9, S.No. 36/1/1,
Baner, Pune 411045, India
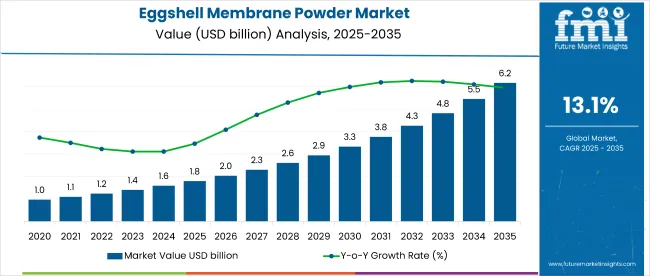
The eggshell membrane powder market is registering a valuation of US$ 1.4 billion in 2023. The market is rising to US$ 5.3 billion by 2033. The market is securing a CAGR of 13.1% during the forecast period.
The several driving factors in the market include:
Don't pay for what you don't need
Customize your report by selecting specific countries or regions and save 30%!
Along with the driving factors, several factors may restrain the growth of the eggshell membrane powder market, including:
Attributes | Details |
---|---|
Market CAGR (2023 to 2033) | 13.1% |
Market Valuation (2023) | US$ 1.4 billion |
Market Valuation (2033) | US$ 5.3 billion |
According to Future Market Insights, the market size was valued at US$ 1.2 million in 2022 and is expected to reach US$ 5.3 million by 2033. The market growth is attributed to the increasing demand for natural and organic food, cosmetics, and nutraceutical ingredients.
The report also highlights the growing popularity of eggshell membrane powder in sports nutrition and pet food applications. However, as previously mentioned, there may be challenges to the market's expansion due to factors such as high production costs and regulatory hurdles.
The market is estimated to capture a CAGR of 13.1% during the forecast period. Historically, the market registered a CAGR of 7.6% from 2018 to 2022.
Eggshell Membrane Powder Market:
Attributes | Eggshell Membrane Powder Market |
---|---|
CAGR (2023 to 2033) | 13.1% |
Value (2023) | US$ 1.4 billion |
Value (2033) | US$ 5.3 billion |
Trends | Rising demand for functional food, dietary supplements, and cosmetic products is fueling the market size. |
Opportunities | Rising government initiatives, market players, and research & development activities. |
Dietary Supplements Market:
Attributes | Dietary Supplements Market |
---|---|
CAGR (2023 to 2033) | 7.3% |
Value (2023) | US$ 166.53 billion |
Value (2033) | US$ 336.87 billion |
Trends | Increasing consumption of dietary supplements by fitness freak consumers and rising demand for high-quality multivitamin supplements are driving the market trends. |
Opportunities | Growing new technologies, research & development activities, and innovation of products are propelling market opportunities. |
Wellness Supplements Market:
Attributes | Wellness Supplements Market |
---|---|
CAGR (2023 to 2033) | 6.4% |
Value (2023) | US$ 282.34 billion |
Value (2033) | US$ 525.04 billion |
Trends | Growing chronic diseases, wellness products, rising infrastructure, and population drive the market size. |
Opportunities | Growing huge investments, emerging key players, government support, and research & development activities are propelling the market. |
Eggshell membrane powder has gained popularity as an ingredient in cosmetics and personal care products, driving demand in the market. The cosmetic & personal care sector is securing a CAGR of 12.2% in the market during the forecast period.
Cosmetics and personal care products, such as anti-aging creams, serums, and shampoos, often incorporate eggshell membrane powder due to its beneficial properties. The collagen and elastin in the powder can help to improve skin elasticity and reduce the appearance of fine lines and wrinkles. The powder's amino acids and other nutrients can nourish and strengthen hair, leading to healthier-looking locks.
Furthermore, consumers are increasingly looking for natural and organic ingredients in their beauty products. Eggshell membrane powder is a natural ingredient that is sustainably sourced and contains no synthetic additives, making it an attractive option for consumers.
Overall, the cosmetics and personal care industry's use of eggshell membrane powder has played a significant role in the market. Historically, the market captured a CAGR of 6.9% between 2018 and 2022.
The conventional category refers to using traditional, non-organic farming practices to produce eggshell membrane powder. Due to the widespread adoption of conventional farming methods in the egg industry, the demand for the conventional category is flourishing. The conventional category dominates the global market by securing a CAGR of 13.0% during the forecast period.
Conventional eggshell membrane powder is produced using eggs from hens raised in conventional, non-organic farming systems. These hens are typically kept in cages and fed a diet of commercial feed that may contain antibiotics and other additives.
The conventional category dominates the market due to the high volume of eggs produced using conventional farming methods. This results in a massive supply of eggshell membranes, which can be processed into powder at a lower cost than organic methods.
Conventional eggshell membrane powder has a longer shelf life than organic powder due to the use of preservatives in the production process. It makes it more appealing to manufacturers who need to ensure a longer product shelf life. Historically, the market secured a CAGR of 8.3% between 2018 and 2022.
Get the data you need at a Fraction of the cost
Personalize your report by choosing insights you need
and save 40%!
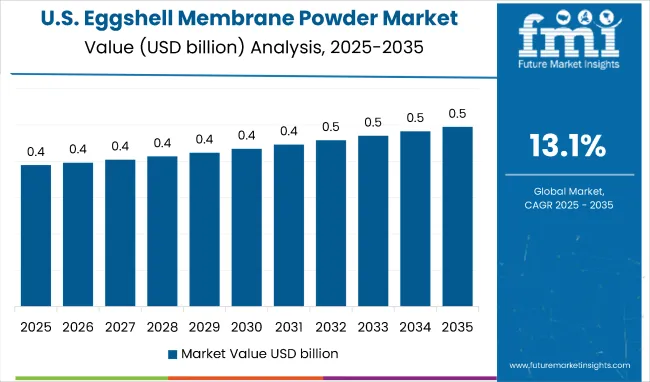
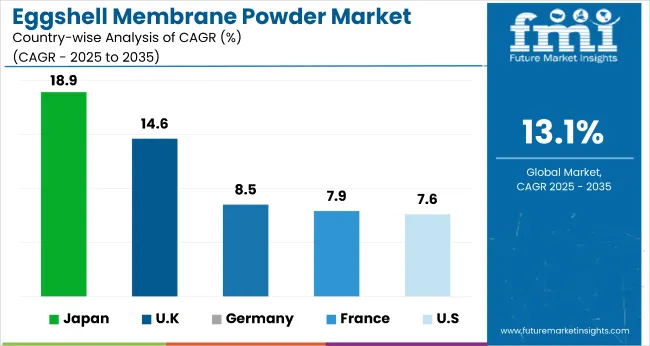
The United States is one of the leading markets in eggshell membrane powder globally. The increasing consumer awareness about the health benefits of eggshell membrane powder has driven the growth of this market in the United States. During the forecast period, the United States registered a CAGR of 7.6% with a valuation of US$ 612.4 million in the global market.
In the United States, eggshell membrane powder is primarily used as a nutritional supplement due to its high content of collagen, elastin, and other nutrients. The growing demand for dietary supplements helps with joint health, skin health, and other wellness concerns. Eggshell membrane powder has become a natural and effective solution for these issues.
Furthermore, the cosmetics and personal care industry in the United States has also contributed to the growth of the eggshell membrane powder market. The use of eggshell membrane powder in anti-aging creams, serums, and other beauty products has increased due to its ability to improve skin elasticity and reduce the appearance of fine lines and wrinkles.
The United States is also a hub for research and development in the eggshell membrane powder market. Historically, the United States eggshell membrane powder market captured a CAGR of 3.3% between 2018 to 2022.
The United Kingdom is a significantly growing global market registering a CAGR of 14.6% with a valuation of US$ 133.5 million by 2033.
In the United Kingdom, eggshell membrane powder is primarily used in the dietary supplement industry. The supplement market in the country has witnessed significant growth due to the increasing awareness of the health benefits of natural products.
Consumers in the United Kingdom are increasingly seeking natural and organic dietary supplements that can help support their overall health and well-being. The eggshell membrane powder has emerged as a popular option due to its high content of collagen, elastin, and other nutrients.
The cosmetics and personal care industry in the United Kingdom has also contributed to the growth of the eggshell membrane powder market. Furthermore, eggshell membrane powder is a functional ingredient in various food products, such as sports nutrition bars and drinks.
The United Kingdom eggshell membrane powder market is expected to grow in the coming years due to increasing consumer demand for organic products. The growing health consciousness and the emergence of innovative applications of eggshell membrane powder in various industries. Historically, the United Kingdom secured a CAGR of 8.0% between 2018 and 2022.
China is one of the prominent markets for eggshell membrane powder globally, with a rapidly growing demand for this natural ingredient in various industries. China is likely to capture a CAGR of 18.9% with a valuation of US$ 602.8 million during the forecast period.
The growing aging population and increasing consumer health consciousness have increased the demand for dietary supplements. These help to reduce joint health, skin health, and other wellness concerns. Eggshell membrane powder has become a natural and effective solution for these issues.
China's cosmetics and personal care industry has also contributed to the growth of China's eggshell membrane powder market. Using eggshell membrane powder in anti-aging creams, serums, and other beauty products improves skin elasticity and reduces the appearance of fine lines and wrinkles.
China is a significant producer of eggs as it supplies eggshells for processing into eggshell membrane powder. Historically, China secured a CAGR of 9.5% between 2018 to 2022.
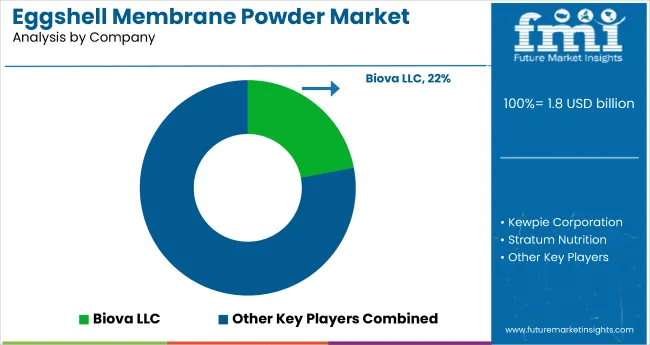
The global market is highly competitive, with several key players operating. These companies focus on expanding their product portfolio, increasing their production capacity, and establishing a strong distribution network to gain a competitive edge in the market. A few of the market players are as follows:
These key players continuously innovate and invest in research and development activities to expand their product portfolio globally. Moreover, these companies are focusing on strategic partnerships and collaborations with other industry players to gain a competitive advantage in the market.
Recent Developments in the Eggshell Membrane Powder Market are:
Attribute | Details |
---|---|
Forecast Period | 2023 to 2033 |
Historical Data Available for | 2018 to 2022 |
Market Analysis | US$ billion for Value |
Key Countries Covered | United States, Canada, Germany, United Kingdom, France, Italy, Spain, Russia, China, Japan, South Korea, India, Thailand, Malaysia, Indonesia, Australia, New Zealand, GCC Countries, Türkiye, Northern Africa, and South Africa |
Key Segments Covered |
|
Key Companies Profiled |
|
Report Coverage | Market Forecast, Company Share Analysis, Competition Intelligence, DROT Analysis, Market Dynamics and Challenges, and Strategic Growth Initiatives |
Customization & Pricing | Available upon Request |
1. Executive Summary | Eggshell Membrane Powder Market 1.1. Global Market Outlook 1.2. Demand-side Trends 1.3. Supply-side Trends 1.4. Technology Roadmap Analysis 1.5. Analysis and Recommendations 2. Market Overview 2.1. Market Coverage / Taxonomy 2.2. Market Definition / Scope / Limitations 3. Market Background 3.1. Market Dynamics 3.1.1. Drivers 3.1.2. Restraints 3.1.3. Opportunity 3.1.4. Trends 3.2. Scenario Forecast 3.2.1. Demand in Optimistic Scenario 3.2.2. Demand in Likely Scenario 3.2.3. Demand in Conservative Scenario 3.3. Opportunity Map Analysis 3.4. Product Life Cycle Analysis 3.5. Supply Chain Analysis 3.5.1. Supply Side Participants and their Roles 3.5.1.1. Producers 3.5.1.2. Mid-Level Participants (Traders/ Agents/ Brokers) 3.5.1.3. Wholesalers and Distributors 3.5.2. Value Added and Value Created at Node in the Supply Chain 3.5.3. List of Raw Material Suppliers 3.5.4. List of Existing and Potential Buyer’s 3.6. Investment Feasibility Matrix 3.7. Value Chain Analysis 3.7.1. Profit Margin Analysis 3.7.2. Wholesalers and Distributors 3.7.3. Retailers 3.8. PESTLE and Porter’s Analysis 3.9. Regulatory Landscape 3.9.1. By Key Regions 3.9.2. By Key Countries 3.10. Regional Parent Market Outlook 3.11. Production and Consumption Statistics 3.12. Import and Export Statistics 4. Global Market Analysis 2018 to 2022 and Forecast, 2023 to 2033 4.1. Historical Market Size Value (US$ Million) & Volume (Tons) Analysis, 2018 to 2022 4.2. Current and Future Market Size Value (US$ Million) & Volume (Tons) Projections, 2023 to 2033 4.2.1. Y-o-Y Growth Trend Analysis 4.2.2. Absolute $ Opportunity Analysis 5. Global Market Analysis 2018 to 2022 and Forecast 2023 to 2033, By Type 5.1. Introduction / Key Findings 5.2. Historical Market Size Value (US$ Million) & Volume (Tons) Analysis By Type, 2018 to 2022 5.3. Current and Future Market Size Value (US$ Million) & Volume (Tons) Analysis and Forecast By Type, 2023 to 2033 5.3.1. Powdered Eggshell Membrane 5.3.2. Concentrated Eggshell Membrane 5.3.3. Other Eggshell Membranes 5.4. Y-o-Y Growth Trend Analysis By Type, 2018 to 2022 5.5. Absolute $ Opportunity Analysis By Type, 2023 to 2033 6. Global Market Analysis 2018 to 2022 and Forecast 2023 to 2033, By Application 6.1. Introduction / Key Findings 6.2. Historical Market Size Value (US$ Million) & Volume (Tons) Analysis By Application, 2018 to 2022 6.3. Current and Future Market Size Value (US$ Million) & Volume (Tons) Analysis and Forecast By Application, 2023 to 2033 6.3.1. Nutraceuticals 6.3.2. Food & Beverages 6.3.3. Pet Food Industry 6.3.4. Cosmetic & Personal Care 6.3.5. Other Applications 6.4. Y-o-Y Growth Trend Analysis By Application, 2018 to 2022 6.5. Absolute $ Opportunity Analysis By Application, 2023 to 2033 7. Global Market Analysis 2018 to 2022 and Forecast 2023 to 2033, By Region 7.1. Introduction 7.2. Historical Market Size Value (US$ Million) & Volume (Tons) Analysis By Region, 2018 to 2022 7.3. Current Market Size Value (US$ Million) & Volume (Tons) Analysis and Forecast By Region, 2023 to 2033 7.3.1. North America 7.3.2. Latin America 7.3.3. Europe 7.3.4. East Asia 7.3.5. South Asia 7.3.6. Oceania 7.3.7. Middle East and Africa 7.4. Market Attractiveness Analysis By Region 8. North America Market Analysis 2018 to 2022 and Forecast 2023 to 2033, By Country 8.1. Historical Market Size Value (US$ Million) & Volume (Tons) Trend Analysis By Market Taxonomy, 2018 to 2022 8.2. Market Size Value (US$ Million) & Volume (Tons) Forecast By Market Taxonomy, 2023 to 2033 8.2.1. By Country 8.2.1.1. USA 8.2.1.2. Canada 8.2.2. By Type 8.2.3. By Application 8.3. Market Attractiveness Analysis 8.3.1. By Country 8.3.2. By Type 8.3.3. By Application 8.4. Key Takeaways 9. Latin America Market Analysis 2018 to 2022 and Forecast 2023 to 2033, By Country 9.1. Historical Market Size Value (US$ Million) & Volume (Tons) Trend Analysis By Market Taxonomy, 2018 to 2022 9.2. Market Size Value (US$ Million) & Volume (Tons) Forecast By Market Taxonomy, 2023 to 2033 9.2.1. By Country 9.2.1.1. Brazil 9.2.1.2. Mexico 9.2.1.3. Rest of Latin America 9.2.2. By Type 9.2.3. By Application 9.3. Market Attractiveness Analysis 9.3.1. By Country 9.3.2. By Type 9.3.3. By Application 9.4. Key Takeaways 10. Europe Market Analysis 2018 to 2022 and Forecast 2023 to 2033, By Country 10.1. Historical Market Size Value (US$ Million) & Volume (Tons) Trend Analysis By Market Taxonomy, 2018 to 2022 10.2. Market Size Value (US$ Million) & Volume (Tons) Forecast By Market Taxonomy, 2023 to 2033 10.2.1. By Country 10.2.1.1. Germany 10.2.1.2. Italy 10.2.1.3. France 10.2.1.4. United Kingdom 10.2.1.5. Spain 10.2.1.6. BENELUX 10.2.1.7. Russia 10.2.1.8. Rest of Europe 10.2.2. By Type 10.2.3. By Application 10.3. Market Attractiveness Analysis 10.3.1. By Country 10.3.2. By Type 10.3.3. By Application 10.4. Key Takeaways 11. East Asia Market Analysis 2018 to 2022 and Forecast 2023 to 2033, By Country 11.1. Historical Market Size Value (US$ Million) & Volume (Tons) Trend Analysis By Market Taxonomy, 2018 to 2022 11.2. Market Size Value (US$ Million) & Volume (Tons) Forecast By Market Taxonomy, 2023 to 2033 11.2.1. By Country 11.2.1.1. China 11.2.1.2. Japan 11.2.1.3. South Korea 11.2.2. By Type 11.2.3. By Application 11.3. Market Attractiveness Analysis 11.3.1. By Country 11.3.2. By Type 11.3.3. By Application 11.4. Key Takeaways 12. South Asia Market Analysis 2018 to 2022 and Forecast 2023 to 2033, By Country 12.1. Historical Market Size Value (US$ Million) & Volume (Tons) Trend Analysis By Market Taxonomy, 2018 to 2022 12.2. Market Size Value (US$ Million) & Volume (Tons) Forecast By Market Taxonomy, 2023 to 2033 12.2.1. By Country 12.2.1.1. Malaysia 12.2.1.2. Thailand 12.2.1.3. India 12.2.1.4. Rest of South Asia 12.2.2. By Type 12.2.3. By Application 12.3. Market Attractiveness Analysis 12.3.1. By Country 12.3.2. By Type 12.3.3. By Application 12.4. Key Takeaways 13. Oceania Market Analysis 2018 to 2022 and Forecast 2023 to 2033, By Country 13.1. Historical Market Size Value (US$ Million) & Volume (Tons) Trend Analysis By Market Taxonomy, 2018 to 2022 13.2. Market Size Value (US$ Million) & Volume (Tons) Forecast By Market Taxonomy, 2023 to 2033 13.2.1. By Country 13.2.1.1. Australia 13.2.1.2. New Zealand 13.2.2. By Type 13.2.3. By Application 13.3. Market Attractiveness Analysis 13.3.1. By Country 13.3.2. By Type 13.3.3. By Application 13.4. Key Takeaways 14. Middle East and Africa Market Analysis 2018 to 2022 and Forecast 2023 to 2033, By Country 14.1. Historical Market Size Value (US$ Million) & Volume (Tons) Trend Analysis By Market Taxonomy, 2018 to 2022 14.2. Market Size Value (US$ Million) & Volume (Tons) Forecast By Market Taxonomy, 2023 to 2033 14.2.1. By Country 14.2.1.1. GCC Countries 14.2.1.2. South Africa 14.2.1.3. Türkiye 14.2.1.4. Rest of Middle East and Africa 14.2.2. By Type 14.2.3. By Application 14.3. Market Attractiveness Analysis 14.3.1. By Country 14.3.2. By Type 14.3.3. By Application 14.4. Key Takeaways 15. Key Countries Market Analysis 15.1. USA 15.1.1. Pricing Analysis 15.1.2. Market Share Analysis, 2022 15.1.2.1. By Type 15.1.2.2. By Application 15.2. Canada 15.2.1. Pricing Analysis 15.2.2. Market Share Analysis, 2022 15.2.2.1. By Type 15.2.2.2. By Application 15.3. Brazil 15.3.1. Pricing Analysis 15.3.2. Market Share Analysis, 2022 15.3.2.1. By Type 15.3.2.2. By Application 15.4. Mexico 15.4.1. Pricing Analysis 15.4.2. Market Share Analysis, 2022 15.4.2.1. By Type 15.4.2.2. By Application 15.5. Germany 15.5.1. Pricing Analysis 15.5.2. Market Share Analysis, 2022 15.5.2.1. By Type 15.5.2.2. By Application 15.6. Italy 15.6.1. Pricing Analysis 15.6.2. Market Share Analysis, 2022 15.6.2.1. By Type 15.6.2.2. By Application 15.7. France 15.7.1. Pricing Analysis 15.7.2. Market Share Analysis, 2022 15.7.2.1. By Type 15.7.2.2. By Application 15.8. United Kingdom 15.8.1. Pricing Analysis 15.8.2. Market Share Analysis, 2022 15.8.2.1. By Type 15.8.2.2. By Application 15.9. Spain 15.9.1. Pricing Analysis 15.9.2. Market Share Analysis, 2022 15.9.2.1. By Type 15.9.2.2. By Application 15.10. BENELUX 15.10.1. Pricing Analysis 15.10.2. Market Share Analysis, 2022 15.10.2.1. By Type 15.10.2.2. By Application 15.11. Russia 15.11.1. Pricing Analysis 15.11.2. Market Share Analysis, 2022 15.11.2.1. By Type 15.11.2.2. By Application 15.12. China 15.12.1. Pricing Analysis 15.12.2. Market Share Analysis, 2022 15.12.2.1. By Type 15.12.2.2. By Application 15.13. Japan 15.13.1. Pricing Analysis 15.13.2. Market Share Analysis, 2022 15.13.2.1. By Type 15.13.2.2. By Application 15.14. South Korea 15.14.1. Pricing Analysis 15.14.2. Market Share Analysis, 2022 15.14.2.1. By Type 15.14.2.2. By Application 15.15. Malaysia 15.15.1. Pricing Analysis 15.15.2. Market Share Analysis, 2022 15.15.2.1. By Type 15.15.2.2. By Application 15.16. Thailand 15.16.1. Pricing Analysis 15.16.2. Market Share Analysis, 2022 15.16.2.1. By Type 15.16.2.2. By Application 15.17. India 15.17.1. Pricing Analysis 15.17.2. Market Share Analysis, 2022 15.17.2.1. By Type 15.17.2.2. By Application 15.18. Australia 15.18.1. Pricing Analysis 15.18.2. Market Share Analysis, 2022 15.18.2.1. By Type 15.18.2.2. By Application 15.19. New Zealand 15.19.1. Pricing Analysis 15.19.2. Market Share Analysis, 2022 15.19.2.1. By Type 15.19.2.2. By Application 15.20. GCC Countries 15.20.1. Pricing Analysis 15.20.2. Market Share Analysis, 2022 15.20.2.1. By Type 15.20.2.2. By Application 15.21. South Africa 15.21.1. Pricing Analysis 15.21.2. Market Share Analysis, 2022 15.21.2.1. By Type 15.21.2.2. By Application 15.22. Türkiye 15.22.1. Pricing Analysis 15.22.2. Market Share Analysis, 2022 15.22.2.1. By Type 15.22.2.2. By Application 16. Market Structure Analysis 16.1. Competition Dashboard 16.2. Competition Benchmarking 16.3. Market Share Analysis of Top Players 16.3.1. By Regional 16.3.2. By Type 16.3.3. By Application 17. Competition Analysis 17.1. Competition Deep Dive 17.1.1. Biova LLC 17.1.1.1. Overview 17.1.1.2. Product Portfolio 17.1.1.3. Profitability by Market Segments 17.1.1.4. Sales Footprint 17.1.1.5. Strategy Overview 17.1.1.5.1. Marketing Strategy 17.1.1.5.2. Product Strategy 17.1.1.5.3. Channel Strategy 17.1.2. Microcore Research Laboratories 17.1.2.1. Overview 17.1.2.2. Product Portfolio 17.1.2.3. Profitability by Market Segments 17.1.2.4. Sales Footprint 17.1.2.5. Strategy Overview 17.1.2.5.1. Marketing Strategy 17.1.2.5.2. Product Strategy 17.1.2.5.3. Channel Strategy 17.1.3. Ecovatec Solutions 17.1.3.1. Overview 17.1.3.2. Product Portfolio 17.1.3.3. Profitability by Market Segments 17.1.3.4. Sales Footprint 17.1.3.5. Strategy Overview 17.1.3.5.1. Marketing Strategy 17.1.3.5.2. Product Strategy 17.1.3.5.3. Channel Strategy 17.1.4. Eggnovo SL 17.1.4.1. Overview 17.1.4.2. Product Portfolio 17.1.4.3. Profitability by Market Segments 17.1.4.4. Sales Footprint 17.1.4.5. Strategy Overview 17.1.4.5.1. Marketing Strategy 17.1.4.5.2. Product Strategy 17.1.4.5.3. Channel Strategy 17.1.5. Eggbrane 17.1.5.1. Overview 17.1.5.2. Product Portfolio 17.1.5.3. Profitability by Market Segments 17.1.5.4. Sales Footprint 17.1.5.5. Strategy Overview 17.1.5.5.1. Marketing Strategy 17.1.5.5.2. Product Strategy 17.1.5.5.3. Channel Strategy 17.1.6. Stratum Nutrition 17.1.6.1. Overview 17.1.6.2. Product Portfolio 17.1.6.3. Profitability by Market Segments 17.1.6.4. Sales Footprint 17.1.6.5. Strategy Overview 17.1.6.5.1. Marketing Strategy 17.1.6.5.2. Product Strategy 17.1.6.5.3. Channel Strategy 17.1.7. Certified Nutraceutical Inc 17.1.7.1. Overview 17.1.7.2. Product Portfolio 17.1.7.3. Profitability by Market Segments 17.1.7.4. Sales Footprint 17.1.7.5. Strategy Overview 17.1.7.5.1. Marketing Strategy 17.1.7.5.2. Product Strategy 17.1.7.5.3. Channel Strategy 17.1.8. Bolise Co. Ltd. 17.1.8.1. Overview 17.1.8.2. Product Portfolio 17.1.8.3. Profitability by Market Segments 17.1.8.4. Sales Footprint 17.1.8.5. Strategy Overview 17.1.8.5.1. Marketing Strategy 17.1.8.5.2. Product Strategy 17.1.8.5.3. Channel Strategy 17.1.9. Mitushi Biopharma 17.1.9.1. Overview 17.1.9.2. Product Portfolio 17.1.9.3. Profitability by Market Segments 17.1.9.4. Sales Footprint 17.1.9.5. Strategy Overview 17.1.9.5.1. Marketing Strategy 17.1.9.5.2. Product Strategy 17.1.9.5.3. Channel Strategy 17.1.10. Kewpie Corporation 17.1.10.1. Overview 17.1.10.2. Product Portfolio 17.1.10.3. Profitability by Market Segments 17.1.10.4. Sales Footprint 17.1.10.5. Strategy Overview 17.1.10.5.1. Marketing Strategy 17.1.10.5.2. Product Strategy 17.1.10.5.3. Channel Strategy 18. Assumptions & Acronyms Used 19. Research Methodology
Don't pay for what you don't need
Customize your report by selecting specific countries or regions and save 30%!
Table 1: Global Market Value (US$ Million) Forecast by Region, 2018 to 2033 Table 2: Global Market Volume (Tons) Forecast by Region, 2018 to 2033 Table 3: Global Market Value (US$ Million) Forecast by Type, 2018 to 2033 Table 4: Global Market Volume (Tons) Forecast by Type, 2018 to 2033 Table 5: Global Market Value (US$ Million) Forecast by Application, 2018 to 2033 Table 6: Global Market Volume (Tons) Forecast by Application, 2018 to 2033 Table 7: North America Market Value (US$ Million) Forecast by Country, 2018 to 2033 Table 8: North America Market Volume (Tons) Forecast by Country, 2018 to 2033 Table 9: North America Market Value (US$ Million) Forecast by Type, 2018 to 2033 Table 10: North America Market Volume (Tons) Forecast by Type, 2018 to 2033 Table 11: North America Market Value (US$ Million) Forecast by Application, 2018 to 2033 Table 12: North America Market Volume (Tons) Forecast by Application, 2018 to 2033 Table 13: Latin America Market Value (US$ Million) Forecast by Country, 2018 to 2033 Table 14: Latin America Market Volume (Tons) Forecast by Country, 2018 to 2033 Table 15: Latin America Market Value (US$ Million) Forecast by Type, 2018 to 2033 Table 16: Latin America Market Volume (Tons) Forecast by Type, 2018 to 2033 Table 17: Latin America Market Value (US$ Million) Forecast by Application, 2018 to 2033 Table 18: Latin America Market Volume (Tons) Forecast by Application, 2018 to 2033 Table 19: Europe Market Value (US$ Million) Forecast by Country, 2018 to 2033 Table 20: Europe Market Volume (Tons) Forecast by Country, 2018 to 2033 Table 21: Europe Market Value (US$ Million) Forecast by Type, 2018 to 2033 Table 22: Europe Market Volume (Tons) Forecast by Type, 2018 to 2033 Table 23: Europe Market Value (US$ Million) Forecast by Application, 2018 to 2033 Table 24: Europe Market Volume (Tons) Forecast by Application, 2018 to 2033 Table 25: East Asia Market Value (US$ Million) Forecast by Country, 2018 to 2033 Table 26: East Asia Market Volume (Tons) Forecast by Country, 2018 to 2033 Table 27: East Asia Market Value (US$ Million) Forecast by Type, 2018 to 2033 Table 28: East Asia Market Volume (Tons) Forecast by Type, 2018 to 2033 Table 29: East Asia Market Value (US$ Million) Forecast by Application, 2018 to 2033 Table 30: East Asia Market Volume (Tons) Forecast by Application, 2018 to 2033 Table 31: South Asia Market Value (US$ Million) Forecast by Country, 2018 to 2033 Table 32: South Asia Market Volume (Tons) Forecast by Country, 2018 to 2033 Table 33: South Asia Market Value (US$ Million) Forecast by Type, 2018 to 2033 Table 34: South Asia Market Volume (Tons) Forecast by Type, 2018 to 2033 Table 35: South Asia Market Value (US$ Million) Forecast by Application, 2018 to 2033 Table 36: South Asia Market Volume (Tons) Forecast by Application, 2018 to 2033 Table 37: Oceania Market Value (US$ Million) Forecast by Country, 2018 to 2033 Table 38: Oceania Market Volume (Tons) Forecast by Country, 2018 to 2033 Table 39: Oceania Market Value (US$ Million) Forecast by Type, 2018 to 2033 Table 40: Oceania Market Volume (Tons) Forecast by Type, 2018 to 2033 Table 41: Oceania Market Value (US$ Million) Forecast by Application, 2018 to 2033 Table 42: Oceania Market Volume (Tons) Forecast by Application, 2018 to 2033 Table 43: Middle East and Africa Market Value (US$ Million) Forecast by Country, 2018 to 2033 Table 44: Middle East and Africa Market Volume (Tons) Forecast by Country, 2018 to 2033 Table 45: Middle East and Africa Market Value (US$ Million) Forecast by Type, 2018 to 2033 Table 46: Middle East and Africa Market Volume (Tons) Forecast by Type, 2018 to 2033 Table 47: Middle East and Africa Market Value (US$ Million) Forecast by Application, 2018 to 2033 Table 48: Middle East and Africa Market Volume (Tons) Forecast by Application, 2018 to 2033
Figure 1: Global Market Value (US$ Million) by Type, 2023 to 2033 Figure 2: Global Market Value (US$ Million) by Application, 2023 to 2033 Figure 3: Global Market Value (US$ Million) by Region, 2023 to 2033 Figure 4: Global Market Value (US$ Million) Analysis by Region, 2018 to 2033 Figure 5: Global Market Volume (Tons) Analysis by Region, 2018 to 2033 Figure 6: Global Market Value Share (%) and BPS Analysis by Region, 2023 to 2033 Figure 7: Global Market Y-o-Y Growth (%) Projections by Region, 2023 to 2033 Figure 8: Global Market Value (US$ Million) Analysis by Type, 2018 to 2033 Figure 9: Global Market Volume (Tons) Analysis by Type, 2018 to 2033 Figure 10: Global Market Value Share (%) and BPS Analysis by Type, 2023 to 2033 Figure 11: Global Market Y-o-Y Growth (%) Projections by Type, 2023 to 2033 Figure 12: Global Market Value (US$ Million) Analysis by Application, 2018 to 2033 Figure 13: Global Market Volume (Tons) Analysis by Application, 2018 to 2033 Figure 14: Global Market Value Share (%) and BPS Analysis by Application, 2023 to 2033 Figure 15: Global Market Y-o-Y Growth (%) Projections by Application, 2023 to 2033 Figure 16: Global Market Attractiveness by Type, 2023 to 2033 Figure 17: Global Market Attractiveness by Application, 2023 to 2033 Figure 18: Global Market Attractiveness by Region, 2023 to 2033 Figure 19: North America Market Value (US$ Million) by Type, 2023 to 2033 Figure 20: North America Market Value (US$ Million) by Application, 2023 to 2033 Figure 21: North America Market Value (US$ Million) by Country, 2023 to 2033 Figure 22: North America Market Value (US$ Million) Analysis by Country, 2018 to 2033 Figure 23: North America Market Volume (Tons) Analysis by Country, 2018 to 2033 Figure 24: North America Market Value Share (%) and BPS Analysis by Country, 2023 to 2033 Figure 25: North America Market Y-o-Y Growth (%) Projections by Country, 2023 to 2033 Figure 26: North America Market Value (US$ Million) Analysis by Type, 2018 to 2033 Figure 27: North America Market Volume (Tons) Analysis by Type, 2018 to 2033 Figure 28: North America Market Value Share (%) and BPS Analysis by Type, 2023 to 2033 Figure 29: North America Market Y-o-Y Growth (%) Projections by Type, 2023 to 2033 Figure 30: North America Market Value (US$ Million) Analysis by Application, 2018 to 2033 Figure 31: North America Market Volume (Tons) Analysis by Application, 2018 to 2033 Figure 32: North America Market Value Share (%) and BPS Analysis by Application, 2023 to 2033 Figure 33: North America Market Y-o-Y Growth (%) Projections by Application, 2023 to 2033 Figure 34: North America Market Attractiveness by Type, 2023 to 2033 Figure 35: North America Market Attractiveness by Application, 2023 to 2033 Figure 36: North America Market Attractiveness by Country, 2023 to 2033 Figure 37: Latin America Market Value (US$ Million) by Type, 2023 to 2033 Figure 38: Latin America Market Value (US$ Million) by Application, 2023 to 2033 Figure 39: Latin America Market Value (US$ Million) by Country, 2023 to 2033 Figure 40: Latin America Market Value (US$ Million) Analysis by Country, 2018 to 2033 Figure 41: Latin America Market Volume (Tons) Analysis by Country, 2018 to 2033 Figure 42: Latin America Market Value Share (%) and BPS Analysis by Country, 2023 to 2033 Figure 43: Latin America Market Y-o-Y Growth (%) Projections by Country, 2023 to 2033 Figure 44: Latin America Market Value (US$ Million) Analysis by Type, 2018 to 2033 Figure 45: Latin America Market Volume (Tons) Analysis by Type, 2018 to 2033 Figure 46: Latin America Market Value Share (%) and BPS Analysis by Type, 2023 to 2033 Figure 47: Latin America Market Y-o-Y Growth (%) Projections by Type, 2023 to 2033 Figure 48: Latin America Market Value (US$ Million) Analysis by Application, 2018 to 2033 Figure 49: Latin America Market Volume (Tons) Analysis by Application, 2018 to 2033 Figure 50: Latin America Market Value Share (%) and BPS Analysis by Application, 2023 to 2033 Figure 51: Latin America Market Y-o-Y Growth (%) Projections by Application, 2023 to 2033 Figure 52: Latin America Market Attractiveness by Type, 2023 to 2033 Figure 53: Latin America Market Attractiveness by Application, 2023 to 2033 Figure 54: Latin America Market Attractiveness by Country, 2023 to 2033 Figure 55: Europe Market Value (US$ Million) by Type, 2023 to 2033 Figure 56: Europe Market Value (US$ Million) by Application, 2023 to 2033 Figure 57: Europe Market Value (US$ Million) by Country, 2023 to 2033 Figure 58: Europe Market Value (US$ Million) Analysis by Country, 2018 to 2033 Figure 59: Europe Market Volume (Tons) Analysis by Country, 2018 to 2033 Figure 60: Europe Market Value Share (%) and BPS Analysis by Country, 2023 to 2033 Figure 61: Europe Market Y-o-Y Growth (%) Projections by Country, 2023 to 2033 Figure 62: Europe Market Value (US$ Million) Analysis by Type, 2018 to 2033 Figure 63: Europe Market Volume (Tons) Analysis by Type, 2018 to 2033 Figure 64: Europe Market Value Share (%) and BPS Analysis by Type, 2023 to 2033 Figure 65: Europe Market Y-o-Y Growth (%) Projections by Type, 2023 to 2033 Figure 66: Europe Market Value (US$ Million) Analysis by Application, 2018 to 2033 Figure 67: Europe Market Volume (Tons) Analysis by Application, 2018 to 2033 Figure 68: Europe Market Value Share (%) and BPS Analysis by Application, 2023 to 2033 Figure 69: Europe Market Y-o-Y Growth (%) Projections by Application, 2023 to 2033 Figure 70: Europe Market Attractiveness by Type, 2023 to 2033 Figure 71: Europe Market Attractiveness by Application, 2023 to 2033 Figure 72: Europe Market Attractiveness by Country, 2023 to 2033 Figure 73: East Asia Market Value (US$ Million) by Type, 2023 to 2033 Figure 74: East Asia Market Value (US$ Million) by Application, 2023 to 2033 Figure 75: East Asia Market Value (US$ Million) by Country, 2023 to 2033 Figure 76: East Asia Market Value (US$ Million) Analysis by Country, 2018 to 2033 Figure 77: East Asia Market Volume (Tons) Analysis by Country, 2018 to 2033 Figure 78: East Asia Market Value Share (%) and BPS Analysis by Country, 2023 to 2033 Figure 79: East Asia Market Y-o-Y Growth (%) Projections by Country, 2023 to 2033 Figure 80: East Asia Market Value (US$ Million) Analysis by Type, 2018 to 2033 Figure 81: East Asia Market Volume (Tons) Analysis by Type, 2018 to 2033 Figure 82: East Asia Market Value Share (%) and BPS Analysis by Type, 2023 to 2033 Figure 83: East Asia Market Y-o-Y Growth (%) Projections by Type, 2023 to 2033 Figure 84: East Asia Market Value (US$ Million) Analysis by Application, 2018 to 2033 Figure 85: East Asia Market Volume (Tons) Analysis by Application, 2018 to 2033 Figure 86: East Asia Market Value Share (%) and BPS Analysis by Application, 2023 to 2033 Figure 87: East Asia Market Y-o-Y Growth (%) Projections by Application, 2023 to 2033 Figure 88: East Asia Market Attractiveness by Type, 2023 to 2033 Figure 89: East Asia Market Attractiveness by Application, 2023 to 2033 Figure 90: East Asia Market Attractiveness by Country, 2023 to 2033 Figure 91: South Asia Market Value (US$ Million) by Type, 2023 to 2033 Figure 92: South Asia Market Value (US$ Million) by Application, 2023 to 2033 Figure 93: South Asia Market Value (US$ Million) by Country, 2023 to 2033 Figure 94: South Asia Market Value (US$ Million) Analysis by Country, 2018 to 2033 Figure 95: South Asia Market Volume (Tons) Analysis by Country, 2018 to 2033 Figure 96: South Asia Market Value Share (%) and BPS Analysis by Country, 2023 to 2033 Figure 97: South Asia Market Y-o-Y Growth (%) Projections by Country, 2023 to 2033 Figure 98: South Asia Market Value (US$ Million) Analysis by Type, 2018 to 2033 Figure 99: South Asia Market Volume (Tons) Analysis by Type, 2018 to 2033 Figure 100: South Asia Market Value Share (%) and BPS Analysis by Type, 2023 to 2033 Figure 101: South Asia Market Y-o-Y Growth (%) Projections by Type, 2023 to 2033 Figure 102: South Asia Market Value (US$ Million) Analysis by Application, 2018 to 2033 Figure 103: South Asia Market Volume (Tons) Analysis by Application, 2018 to 2033 Figure 104: South Asia Market Value Share (%) and BPS Analysis by Application, 2023 to 2033 Figure 105: South Asia Market Y-o-Y Growth (%) Projections by Application, 2023 to 2033 Figure 106: South Asia Market Attractiveness by Type, 2023 to 2033 Figure 107: South Asia Market Attractiveness by Application, 2023 to 2033 Figure 108: South Asia Market Attractiveness by Country, 2023 to 2033 Figure 109: Oceania Market Value (US$ Million) by Type, 2023 to 2033 Figure 110: Oceania Market Value (US$ Million) by Application, 2023 to 2033 Figure 111: Oceania Market Value (US$ Million) by Country, 2023 to 2033 Figure 112: Oceania Market Value (US$ Million) Analysis by Country, 2018 to 2033 Figure 113: Oceania Market Volume (Tons) Analysis by Country, 2018 to 2033 Figure 114: Oceania Market Value Share (%) and BPS Analysis by Country, 2023 to 2033 Figure 115: Oceania Market Y-o-Y Growth (%) Projections by Country, 2023 to 2033 Figure 116: Oceania Market Value (US$ Million) Analysis by Type, 2018 to 2033 Figure 117: Oceania Market Volume (Tons) Analysis by Type, 2018 to 2033 Figure 118: Oceania Market Value Share (%) and BPS Analysis by Type, 2023 to 2033 Figure 119: Oceania Market Y-o-Y Growth (%) Projections by Type, 2023 to 2033 Figure 120: Oceania Market Value (US$ Million) Analysis by Application, 2018 to 2033 Figure 121: Oceania Market Volume (Tons) Analysis by Application, 2018 to 2033 Figure 122: Oceania Market Value Share (%) and BPS Analysis by Application, 2023 to 2033 Figure 123: Oceania Market Y-o-Y Growth (%) Projections by Application, 2023 to 2033 Figure 124: Oceania Market Attractiveness by Type, 2023 to 2033 Figure 125: Oceania Market Attractiveness by Application, 2023 to 2033 Figure 126: Oceania Market Attractiveness by Country, 2023 to 2033 Figure 127: Middle East and Africa Market Value (US$ Million) by Type, 2023 to 2033 Figure 128: Middle East and Africa Market Value (US$ Million) by Application, 2023 to 2033 Figure 129: Middle East and Africa Market Value (US$ Million) by Country, 2023 to 2033 Figure 130: Middle East and Africa Market Value (US$ Million) Analysis by Country, 2018 to 2033 Figure 131: Middle East and Africa Market Volume (Tons) Analysis by Country, 2018 to 2033 Figure 132: Middle East and Africa Market Value Share (%) and BPS Analysis by Country, 2023 to 2033 Figure 133: Middle East and Africa Market Y-o-Y Growth (%) Projections by Country, 2023 to 2033 Figure 134: Middle East and Africa Market Value (US$ Million) Analysis by Type, 2018 to 2033 Figure 135: Middle East and Africa Market Volume (Tons) Analysis by Type, 2018 to 2033 Figure 136: Middle East and Africa Market Value Share (%) and BPS Analysis by Type, 2023 to 2033 Figure 137: Middle East and Africa Market Y-o-Y Growth (%) Projections by Type, 2023 to 2033 Figure 138: Middle East and Africa Market Value (US$ Million) Analysis by Application, 2018 to 2033 Figure 139: Middle East and Africa Market Volume (Tons) Analysis by Application, 2018 to 2033 Figure 140: Middle East and Africa Market Value Share (%) and BPS Analysis by Application, 2023 to 2033 Figure 141: Middle East and Africa Market Y-o-Y Growth (%) Projections by Application, 2023 to 2033 Figure 142: Middle East and Africa Market Attractiveness by Type, 2023 to 2033 Figure 143: Middle East and Africa Market Attractiveness by Application, 2023 to 2033 Figure 144: Middle East and Africa Market Attractiveness by Country, 2023 to 2033
Recommendations
Explore Food and Beverage Insights
View Reports