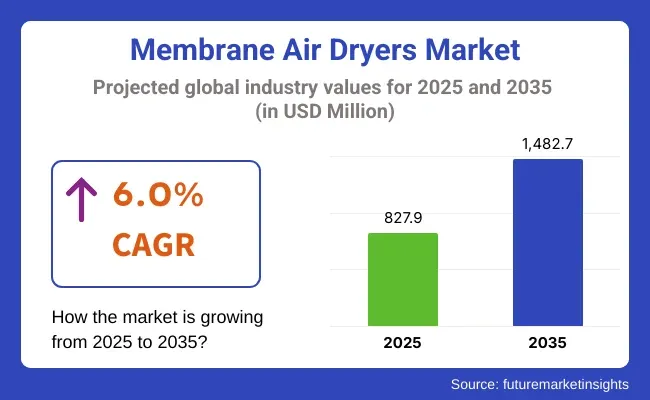
The Market is anticipated to reach USD 1,482.7 Million by 2035, from USD 827.9 Million in 2025, at a CAGR of 6.0% during a forecast period. The increasing automation, strict air quality regulations, and new production facilities in industries such as food & beverage, pharmaceuticals, and semiconductors where moisture-free air is crucial for the integrity of operations and quality of the products drive growth.
| Metric | Value |
|---|---|
| Market Size (2025E) | USD 827.9 Million |
| Market Value (2035F) | USD 1,482.7 Million |
| CAGR (2025 to 2035) | 6.0% |
From 2025 to 2035, the Membrane Air Dryers Market is forecast to have a robust growth, due to the increasing availability of clean and dry compressed air in industrial, healthcare, and electronics manufacturing applications.
Selective membrane dryer systems operator by removing water vapour from compressed air by passing it through a selective membrane, and are becoming increasingly popular in the industry due to space-saving designs, low maintenance needs, and energy efficiency over refrigeration or desiccant dryers.
| By Product Type | Market Share (2025) |
|---|---|
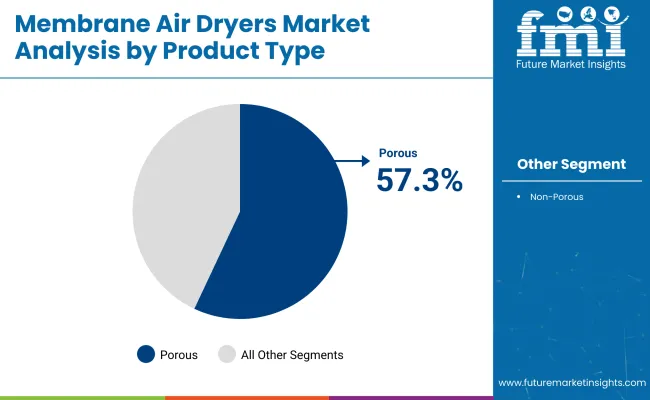
| Porous | 57.3% |
The porous membrane air dryers lead the overall market for membrane air dryers on account of high efficiency in moisture removal and flexibility in various industries. These dryers use microporous membranes for selective permittivity; water vapour can flow through this type of membrane but compressed air cannot. Their construction allows for constant drying without electricity, which is perfect for those installations where energy efficiency and small footprint are important.
Porous membrane dryers remain preferable among manufacturers overall, as they are low maintenance and provide consistent dew point control across varying operating conditions. Industries demand for these systems grows due to their performance capabilities without leaking oil or other contaminants making them a highly desired option for particular production lines like pharmaceutical, electronics, and laboratory applications.
Operational flexibility is also achieved with porous membrane air dryers to accommodate changing flow rates and extreme operating environments without compromising drying performance. They are silent (operating without vibration) and can thus be integrated into cleanrooms, food packaging units and automated manufacturing systems.
Due to the ever-growing demand, especially from advanced manufacturing and processing facilities, for oil-free and moisture-free compressed air systems, the porous membrane segment is projected to continue experiencing significant growth. Increased regulatory scrutiny in food-grade and medical facilities of equipment hygiene and compressed air quality has also reinforced widespread adoption.
| By Application | Market Share (2025) |
|---|---|
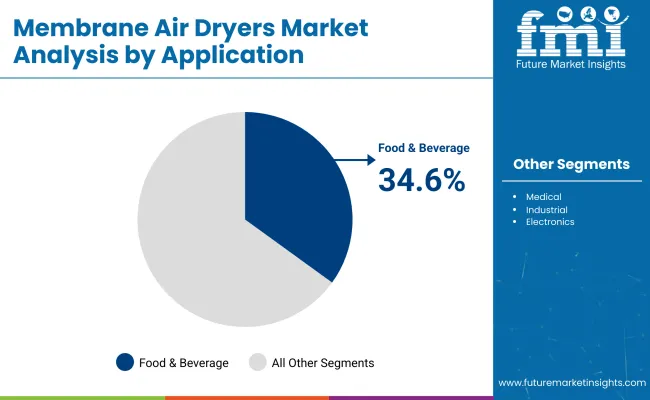
| Food & Beverage | 34.6% |
Rising hygiene requirements across the food & beverage sector, as well as the demand for dry, contaminant-free compressed air, makes it the largest application segment for membrane air dryers. By preventing moisture intrusion, which can affect product shelf life and safety, high-quality air is crucial for packaging, bottling, and food processing systems, and this is where membrane air dryers come into play.
Compressors use these dryers to remove water vapour from pneumatic controls, blow-off applications, and direct food-contact processes in team-compressed air lines. Instead, since membrane air dryers work with no oil or refrigerants at all, they make good sense in compliance with clean air requirements stated by the global food safety governing bodies. In food-grade settings, it is necessary to ensure consistent air quality with high humidity and temperature variations.
Another factor for membrane dryers are their compact configuration and modular design, which are two very important properties in terms of confinement of installation space in food production facilities. They also provide point-of-use drying systems to control localized moisture in key areas like packaging lines or ingredient dispensing stations.
The growing demand for packaged foods, ready-to-eat meals, and frozen products will continue to drive the adoption of membrane dryers. As manufacturers work to increase production capacity and automation in their processing lines food & beverage industry is expected to be one of the primary drivers for growth within the membrane air dryers market.
Limitations in High-Flow and High-Humidity Applications
Air dryers that operate on the membrane principle are simple and compact, but struggle with high-capacity high-humidity air streams. At higher inlet pressure dew points they become less effective and for some heavy duty industrial processes are less effective. Moreover, the finite lifespan of membrane cartridges also contributes to the recurring costs of replacement.
By doing this manufacturers are developing hybrid models which include membrane and desiccant or refrigeration systems; this will provide better drying performance without changing the energy efficiency or footprint.
Rising Demand in Medical and Cleanroom Environments
Membrane air dryers are thus being increasingly used in medical gas systems, dental clinics and laboratory environments requiring oil- and moisture-free air. Literally silent, compact and oil-free, these dryers are most suitable for crowded and hygiene-sensitive areas.
The increasing global emphasis on medical-grade compressed air and cleanroom environments, especially in the wake of healthcare infrastructure expansion, will open up new opportunities for manufacturers offering high-purity membrane drying systems that are specifically designed for these market segments.
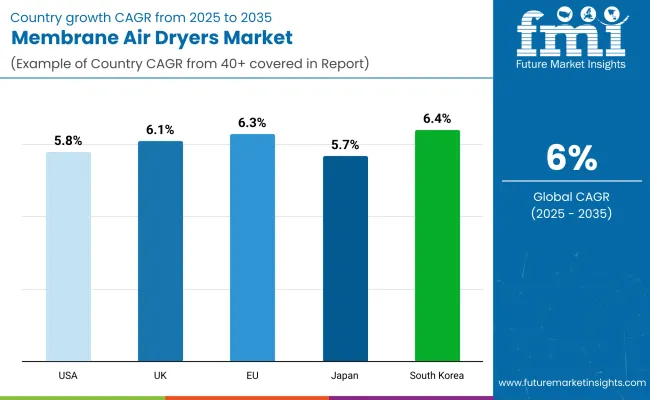
Almost all advents are taking place when the overall membrane air dryers market in the United States is forecast to grow at a CAGR of 5.8% through 2025 to 2035. The rising demand for dry, clean compressed air across vital industries, including, pharmaceuticals, electronics, food processing, etc., is driving growth for membrane-based drying solutions.
This type of system provides a small footprint, low power consumption, and low maintenance compared to traditional refrigerant or desiccant dryers. Furthermore, the rising number of small-to-medium -size manufacturing plants who are likely to opt for affordable air treatment systems, has also accelerated the market growth in the country.
| Country | CAGR (2025 to 2035) |
|---|---|
| United States | 5.8% |
Growing industrial automation trend, and increasing demand for contamination-free compressed air systems in industries like healthcare, chemical processing, and aerospace, are expected to drive the adoption.
Driven by the need for increased efficiency and reduced carbon emissions, membrane dryers based on energy-saving benefits are becoming more favourable in comparison to conventional technologies. The shift and motion towards oil-free and dry air systems is also aided with government regulations that revolve towards reduction in emissions.
| Country | CAGR (2025 to 2035) |
|---|---|
| United Kingdom | 6.1% |
The membrane air dryers market in Europe is expected to expand at a CAGR of 6.3% by 2035. Tough air quality and environment regulations have resulted in the increased adoption of advanced compressed air treatment systems.
This trend is reinforced through the continued evolution of the industrial sector towards sustainable manufacturing and a growing demand from high-precision sectors including optics and semiconductors. Furthermore, rising trend of automotive production hubs along with food-grade manufacturing facilities in Germany, France and Italy is supporting wide scale deployment of membrane dryers.
| Region | CAGR (2025 to 2035) |
|---|---|
| European Union | 6.3% |
The membrane air dryers market in Japan is expected to grow at a rate of 5.7% during the forecast period of 2025 to 2035. With the country's increasing focus on automation, robotics, and smart manufacturing systems, the demand for uninterrupted, moisture-free compressed air has also increased.
Cleanroom environments and exact manufacturing processes are built on humidity control, and as such, membrane air dryers are held in great esteem in these industries. Also, the minimization of size in membrane dryers meets the space-saving objectives of many Japanese production units.
| Country | CAGR (2025 to 2035) |
|---|---|
| Japan | 5.7% |
The membrane air dryers market in South Korea is projected to register a CAGR of 6.4% through the forecast period. The primary driver of growth is the rapid expansion in semiconductor and electronics manufacturing industries. These industries need ultra-dry and oil-free compressed air systems, which is exactly what membrane dryer’s supply.
Moreover, the government’s initiatives for factory automation and industrial modernization further boost the market outlook. Ongoing technological advances and increasing air treatment system exports further augment South Korea’s place in the global supply chain.
| Country | CAGR (2025 to 2035) |
|---|---|
| South Korea | 6.4% |
The Membrane Air Dryers Market has been increasing steadily due to rapid adoption in areas of industrial automation, medical air systems, and instrumentation. Energy efficiency, small footprint, and maintenance-free operation are key offerings of leading manufacturers to cater take up demand coming from end-use industries such as food & beverage, pharmaceuticals, and electronics. Companies also invest in low dew point technology and modular systems to address specific requirements.
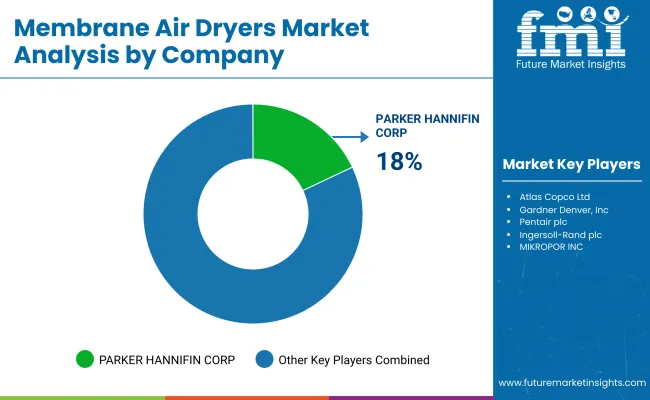
PARKER HANNIFIN CORP (18-20%)
Parker Hannifin leads the membrane air dryers market with energy-efficient and compact systems that require minimal maintenance. The company focuses on critical industries such as healthcare and analytical labs.
Atlas Copco Ltd. (15-17%)
Atlas Copco delivers high-capacity membrane dryers with modular integration for flexible manufacturing setups. The firm’s R&D drives innovations that enhance moisture separation and energy optimization.
Gardner Denver, Inc.
Gardner Denver strengthens its presence in portable and mobile air solutions. Its latest dryers cater to field-based tools and mobile compressor units, especially in construction and maintenance sectors.
Pentair plc
Pentair differentiates with hybrid systems that combine filtration and drying in one unit. Their solutions are popular in hygiene-sensitive sectors like beverages and food packaging.
Donaldson Company, Inc.
Donaldson targets high-purity applications with membrane dryers that incorporate advanced filtration layers, making them suitable for electronics and pharmaceutical manufacturing.
Ingersoll-Rand plc
Ingersoll-Rand integrates IoT into membrane dryer systems to enable remote diagnostics and energy tracking, appealing to industrial users seeking smart factory compatibility.
MIKROPOR INC.
MIKROPOR offers customized membrane air dryers for niche users in biotech and medical device assembly, ensuring silent operation and stable dew point control.
Graco Inc.
Graco focuses on precision-demanding sectors like painting and coating systems, ensuring stable airflow and minimal moisture contamination through its compact dryers.
Wilkerson Corp.
Wilkerson enhances value with efficient, small-form dryers that are easy to retrofit in existing automation setups, particularly within OEM and control systems.
Sullair, LLC.
Sullair emphasizes durability and continuous uptime, designing robust membrane air dryers for extreme-duty applications in mining, oil & gas, and heavy manufacturing.
The overall market size for the Membrane Air Dryers Market was approximately USD 827.9 Million in 2025.
The Membrane Air Dryers Market is expected to reach approximately USD 1,482.7 Million in 2035.
The demand is driven by increasing industrial automation, stringent environmental regulations, and the growing need for energy-efficient compressed air systems across various industries.
The top 5 countries driving market growth are the USA, UK, Europe, Japan and South Korea.
The Food & Beverage segment is expected to command a significant share over the assessment period.


Full Research Suite comprises of:
Market outlook & trends analysis
Interviews & case studies
Strategic recommendations
Vendor profiles & capabilities analysis
5-year forecasts
8 regions and 60+ country-level data splits
Market segment data splits
12 months of continuous data updates
DELIVERED AS:
PDF EXCEL ONLINE
Membrane Filter Press Solutions Market Size and Share Forecast Outlook 2025 to 2035
Membrane Filter Press Machines Market Size and Share Forecast Outlook 2025 to 2035
Membrane Separation Ammonia Cracker Market Size and Share Forecast Outlook 2025 to 2035
Membrane Separation Technology Market Size and Share Forecast Outlook 2025 to 2035
Membrane Switch Market Size and Share Forecast Outlook 2025 to 2035
Membrane Filtration Systems Market Size and Share Forecast Outlook 2025 to 2035
Membrane Microfiltration Market Size and Share Forecast Outlook 2025 to 2035
Membrane Filter Cartridge Market Size and Share Forecast Outlook 2025 to 2035
Membrane Boxes Market Size and Share Forecast Outlook 2025 to 2035
Membrane Chemicals Market Growth - Trends & Forecast 2025 to 2035
Market Leaders & Share in Membrane Boxes Manufacturing
Geomembrane Market Strategic Growth 2024-2034
Egg Membrane Powder Market
PTFE Membrane Market
Metal Membrane Ammonia Cracker Market Size and Share Forecast Outlook 2025 to 2035
Mucous Membrane Pemphigoid Treatment Market
Medical Membrane Market Size and Share Forecast Outlook 2025 to 2035
Ceramic Membranes Market Analysis - Size, Share and Forecast Outlook 2025 to 2035
Amniotic Membrane Market Size and Share Forecast Outlook 2025 to 2035
Eggshell Membrane Powder Market Size and Share Forecast Outlook 2025 to 2035

Thank you!
You will receive an email from our Business Development Manager. Please be sure to check your SPAM/JUNK folder too.
Chat With
MaRIA