Ultrafiltration Membranes Market Size and Share Forecast Outlook 2025 to 2035

The global ultrafiltration membranes market is anticipated to reach USD 5,865.3 million in 2025 and is further projected to expand to USD 12,563.8 million by 2035, registering a compound annual growth rate (CAGR) of 8.3% during the forecast period.
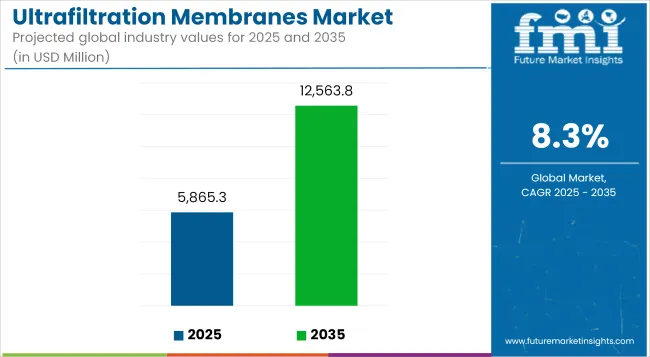
Quick Stats for the Ultrafiltration Membranes Market

  • Industry Value (2025): USD 5,865.3 million
  • Forecast Value (2035): USD 12,563.8 million
  • Forecast CAGR: 8.3%
  • Leading Segment in 2025: Polymeric Membranes (65%)
  • Key Growth Region: Asia-Pacific and the Middle East
  • Top Key Players: DuPont, Asahi Kasei Corp., Toray Industries Inc., Alfa Laval, Pentair, 3M, SUEZ

Ultrafiltration Membranes Market   Industry Value Analysis

Metric Value
Market Size in 2025 USD 5,865.3 million
Projected Market Size in 2035 USD 12,563.8 million
CAGR (2025 to 2035) 8.3%

This growth is being supported by rising demand for clean water, increasing enforcement of wastewater treatment regulations, and expanding use in food processing, pharmaceutical, and municipal sectors.

Ultrafiltration membranes are semipermeable materials used to remove suspended solids, bacteria, and high molecular weight compounds from liquids. Polymeric membrane materials such as polyvinylidene fluoride (PVDF), polyethersulfone (PES), and polyacrylonitrile (PAN) are expected to account for a significant share of the market in 2025. These materials are commonly selected due to their affordability, mechanical strength, and adaptability to conventional filtration systems.

The adoption of decentralized and modular ultrafiltration systems is becoming increasingly prevalent, particularly in regions with limited access to centralized water treatment infrastructure. Municipal utilities, industrial operators, and remote communities are turning to compact and mobile UF systems to treat water on-site. This helps reduce transportation costs, enables rapid deployment in emergencies, and facilitates compliance with environmental discharge norms.

Product development is focused on improving energy efficiency and addressing membrane fouling, which are key challenges in long-term ultrafiltration performance. Modified PVDF membranes and hydrophilic surface coatings are being used to reduce biofouling and scaling.

These innovations help extend membrane life, lower the frequency of cleaning, and reduce operating expenses. In addition, energy-efficient backwashing technologies and chemically enhanced cleaning protocols are gaining adoption in critical industries such as pharmaceuticals and food production, where consistent filtration quality is required.

A key trend in the market is the integration of digital monitoring and smart maintenance systems. Ultrafiltration systems are increasingly being equipped with sensors that track flow rate, pressure, and membrane performance in real time. These data streams support predictive maintenance through artificial intelligence-based analysis, helping operators reduce downtime and optimize replacement schedules. The transition to data-driven water infrastructure is enabling improved reliability and efficiency while aligning with stricter water quality and environmental compliance standards.

Analyzing Global Ultrafiltration Membranes Market by Top Investing Segments

Polymeric Membranes to Dominate Material Type Segment in Ultrafiltration Membranes Market

Polymeric ultrafiltration membranes are expected to hold the largest share of the global market in 2025, accounting for approximately 65%, and are projected to grow at a CAGR of 7.6% through 2035. Materials such as polyvinylidene fluoride (PVDF), polyethersulfone (PES), and polysulfone (PS) are widely used due to their cost-effectiveness, ease of fabrication, chemical resistance, and high permeability.

These membranes are extensively deployed across municipal water treatment, industrial effluent management, food & beverage filtration, and healthcare sectors. In contrast, ceramic membranes (~20-25% share) are used in niche, high-temperature or aggressive environments due to their durability and fouling resistance, while other materials account for a minor share focused on specialized or emerging applications.
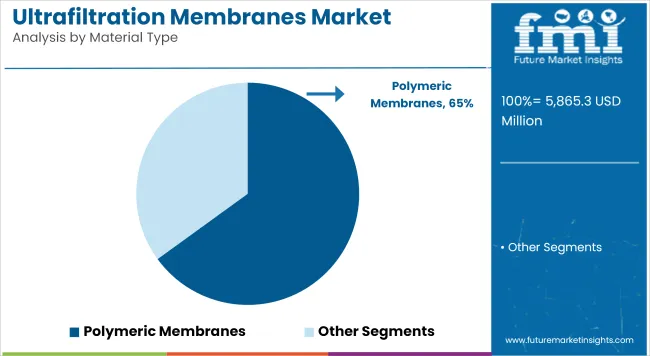
Ultrafiltration Membranes Market   Analysis By Material Type

Wastewater Treatment to Dominate End-Use Segment in Ultrafiltration Membranes Market

Wastewater treatment is projected to hold the largest share of the global ultrafiltration membranes market in 2025, accounting for approximately 33%, and is expected to grow at a CAGR of 7.9% through 2035. The rising global emphasis on water reuse, industrial discharge regulations, and zero-liquid discharge (ZLD) policies is driving large-scale adoption of ultrafiltration systems in municipal and industrial wastewater treatment.

Ultrafiltration membranes offer superior removal of suspended solids, bacteria, and viruses, making them ideal for tertiary treatment and reuse applications. Asia-Pacific and the Middle East are leading in investment due to water scarcity and growing urban populations, while developed regions focus on upgrading aging water infrastructure with membrane technologies.
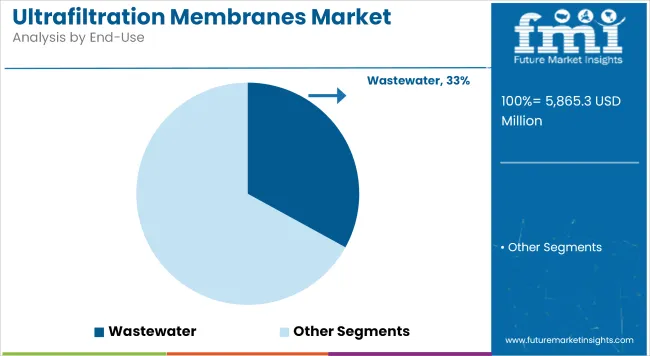
Ultrafiltration Membranes Market   Analysis By End Use

End-User Industry Adoption Trends

The ultrafiltration membranes market is driven by several factors affecting water treatment plants, industrial customers, municipalities, and equipment manufacturers. Filtration performance and longevity are of great concern in all segments, highlighting the demand for dependable and long-lasting membrane products. Cost and value are a medium concern, indicating the trade-off between price and quality. Energy efficiency is a top priority for industrial customers and water treatment facilities, where operating expenses need to be minimized.

Operation and maintenance simplicity is important to all parties, providing seamless operation and little downtime. Compliance with regulations is an area of utmost importance, especially for municipalities and water treatment plants, due to strict environmental laws requiring high-performing filtration systems. Equipment suppliers face medium-level issues in the majority of the criteria, which mirrors the need for innovation in low-cost and environmentally friendly filtration technology. As markets advance, efficiency, durability, and compliance are at the top of industry innovations, driving investments in high-performing membrane technologies.

Risk Assessment for the Ultrafiltration Membranes Market

Dependency on raw materials is one of the major threats in the ultrafiltration (UF) membrane business. UF membranes are made from polymeric materials such as polyethersulfone (PES), polyvinylidene fluoride (PVDF), and polysulfone (PS), as well as ceramic alternatives. Disruptions in the supply chain, geopolitical tensions, or fluctuations in the cost of petrochemical-based raw materials can lead to increased production costs and supply shortages.

Technological risks related to future advances and product innovation need to be adequately addressed. The UF membranes domain is experiencing rapid advances, mainly due to regular improvements in membrane permeability, fouling resistance, and durability. Thus, firms that don’t invest in the development of new technology may find it hard to hold ground against their competitors, who offer better performances, prolonged operational life, and more efficient energy use.

The industry faces strong competition, as the global and regional players are offering both polymeric and ceramic UF membranes. Price wars, mainly in sectors that are sensitive to cost, such as municipal water treatment, can take a toll on profit margins. Companies that do not have the right differentiation strategies might see a fall in their industry share.

Country-wise Analysis

Country CAGR (2025 to 2035)
USA 8.3%
UK 9.2%
China 8.8%
Japan 9.4%
South Korea 9.7%

USA

The ultrafiltration membrane market in the USA is being driven by the demand for clean and safe water owing to surging industrialization, increasing levels of water pollution, and growing government regulations. The expanding application of advanced water treatment technologies in municipal and industrial sectors is influencing the growth rate of the industry.

The rising utilization of ultrafiltration membranes across healthcare, food & beverage, and pharmaceutical industries is also contributing toward augmenting demand. Emphasis on wastewater recycling and desalination ventures, alongside technological improvement in the shape of membrane filtration, also aids the growth of the industry. The increasing demand for sustainable and energy-efficient water purification solutions also drives growth. The USA ultrafiltration membrane market is expected to expand at 8.3% CAGR during the forecast period, according to FMI.

Growth Factors in the USA

Key Drivers Details
The Trade Demand for Clean & Safe Water Rising water pollution and contamination concerns are creating the need for advanced filtration systems.
Strict government regulations Rigorous Environmental Laws on Water Treatment and Industrial Discharge

UK

The UK ultrafiltration membrane market is growing owing to rising worries regarding water contamination, higher demand for improved water treatment technologies, and stringent government regulations on water quality. Industrial and municipal sectors are increasingly adopting sustainable and energy-efficient filtration technologies, driving growth.

Also, the growing need for wastewater recycling and desalination projects and growth in the pharmaceutical, food, and healthcare industries are further supporting industry demand. Membrane filtration system advancements and the growing transition toward more eco-sustainable water purification methods also help expedite industry growth. The UK industry will grow at a 9.2% CAGR during the forecast period, according to FMI.

Growth Factors in the UK

Key Drivers Details
Growing Concerns About Water Pollution Increasing contamination levels increase demand for permeable membrane technologies.
Strict Government Regulations Strict laws on water quality and treatment of wastewater.

China

Chinese ultrafiltration membranes market is growing significantly because of fast industrialization, urbanization, and increasing water pollution threats. The need for stringent government regulations associated with water treatment and the aspect of environmental sustainability are fueling the demand for advanced filtration techniques.

The growing number of industrial and municipal water treatment facilities combined with the increasing use of wastewater recycling and desalination projects are acting as drivers for the industry. Also, rapidly growing pharmaceutical, food, and beverage sectors are driving the demand for good-quality water filtration. Industry expansion is also aided by technological advancements in membrane filtration systems and a move toward energy-efficient, sustainable water purification solutions. FMI anticipates China's industry to grow at an 8.8% CAGR during the study period.

Growth Factors in China

Key Drivers Details
Fast Industrialization & Urbanization Rising industrial activities and increasing population are other factors.
Tight Environmental Regulations Government policies require strict water quality and wastewater treatment standards.

Japan

Growing concerns regarding water pollution, stringent government regulations on the quality of water, and advancements in water treatment technologies are driving the ultrafiltration membrane market in Japan. The leading focus on environmental protection and sustainability in Japan has driven the country's adoption of ultrafiltration membrane systems in wastewater recycling and desalination projects.

Furthermore, the rising demand for high-purity water in the pharmaceutical, food & beverage, and healthcare industries, among others, is also contributing to the industry's growth. The expansion of the industry further extends due to technological innovations in energy-efficient and high-performance filtration systems as well as investments in municipal and industrial water treatment. FMI anticipates Japan’s industry to grow at 9.4% CAGR during the study period.

Growth Factors in Japan

Key Drivers Details
Several Strict Water Quality Regulations Low government regulations establish stringent criteria for water treatment and waste management policies.
Growing Concerns About Water Pollution Growing need for high-level filtration systems to remove contamination.

South Korea

The country’s emphasis on the sustainable management of water resources has led to the implementation of advanced membrane filtration technologies. Moreover, the growing pharmaceutical, biotechnology, and food & beverage sectors relying on high-purity water are also impacting demand. Growing government investments in modernized water infrastructure and desirable continuous developments of energy-efficient and high-performance filtration systems by the technological vendors are expected to boost the industry over the stipulated period. The South Korean industry will expand at 9.7% CAGR during the study period, according to FMI.

Growth Factors in South Korea

Key Drivers Details
Strict Water Quality Rules Waste water management and water purification-government regulations
Emerging Water Pollution Threats Expansion in innovation in zones, for example, nanotechnology or biomedicine

Competitive Outlook

The global ultrafiltration membranes market is increasingly technology-driven and highly competitive, with manufacturers emphasizing innovations in modular system design, process automation, and high-recovery membrane configurations. There is a growing focus on developing low-energy, high-selectivity ultrafiltration modules to enhance operational efficiency while meeting the evolving demands of industries such as food processing, pharmaceutical water purification, and industrial brine treatment. The increasing demand for decentralized, sustainable water treatment infrastructure is creating significant opportunities across developing economies and industrial sectors seeking reliable, long-term filtration solutions.
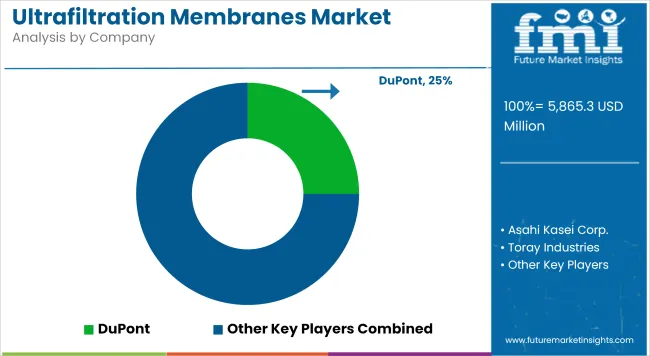
  • In March 2024, DuPont introduced its Multibore PRO PES ultrafiltration module, a multi-capillary design engineered to reduce the number of required modules in applications like desalination, municipal drinking water, and industrial water systems. This design improves membrane packing efficiency and simplifies system layout, underscoring a trend toward higher throughput and space efficiency.
  • In September 2023, PPG debuted a high-performance ultrafiltration membrane and filter components tailored for process and wastewater treatment in industrial settings pristinemarketinsights.com. The launch reflects growing demand for robust, industrial-grade UF solutions focused on resilience, fouling resistance, and ease of integration into existing treatment plants.

Ultrafiltration Membranes Market   Analysis By Company

Companies

  • DuPont
  • Asahi Kasei Corp.
  • Toray Industries Inc.
  • Alfa Laval
  • Pentair
  • 3M
  • Dow Chemical Co.
  • Fresenius Medical Care
  • GE
  • NX Filtration
  • SUEZ
  • PPG

Top Segments Studied in the Ultrafiltration Membranes Market Research Report

By Material Type:

The segmentation is as ceramics, polymers, and other material types.

By End-Use:

The segmentation is as hemodialysis, industrial processes, food & beverage, potable water, biopharmaceuticals, and wastewater.

By Region:

The market is divided into North America, Europe, the Middle East & Africa, Latin America, and Asia Pacific.

Table of Content

  1. Executive Summary
  2. Market Overview
  3. Market Background
  4. Global Market Analysis 2020 to 2024 and Forecast, 2025 to 2035
  5. Global Market Analysis 2020 to 2024 and Forecast 2025 to 2035, By Material Type
    • Ceramics
    • Polymers
    • Other Material Types
  6. Global Market Analysis 2020 to 2024 and Forecast 2025 to 2035, By End-Use
    • Hemodialysis
    • Industrial Processes
    • Food & Beverage
    • Potable Water
    • Biopharmaceuticals
    • Wastewater
  7. Global Market Analysis 2020 to 2024 and Forecast 2025 to 2035, By Region
    • North America
    • Latin America
    • Western Europe
    • Eastern Europe
    • South Asia and Pacific
    • East Asia
    • Middle East and Africa
  8. North America Market Analysis 2020 to 2024 and Forecast 2025 to 2035, By Country
  9. Latin America Market Analysis 2020 to 2024 and Forecast 2025 to 2035, By Country
  10. Western Europe Market Analysis 2020 to 2024 and Forecast 2025 to 2035, By Country
  11. Eastern Europe Market Analysis 2020 to 2024 and Forecast 2025 to 2035, By Country
  12. South Asia and Pacific Market Analysis 2020 to 2024 and Forecast 2025 to 2035, By Country
  13. East Asia Market Analysis 2020 to 2024 and Forecast 2025 to 2035, By Country
  14. Middle East and Africa Market Analysis 2020 to 2024 and Forecast 2025 to 2035, By Country
  15. Key Countries Market Analysis
  16. Market Structure Analysis
  17. Competition Analysis
    • DuPont
    • Asahi Kasei Corp.
    • Toray Industries Inc.
    • Alfa Laval
    • Pentair
    • 3M
    • BASF SE (Inge AG)
    • Baxter International
    • Dow Chemical Co.
    • Fresenius Medical Care
    • GE
    • Cantel Medical
    • Entegris Inc.
    • Corning Inc.
    • GEA Westfalia Separator Inc.
  18. Assumptions & Acronyms Used
  19. Research Methodology

List of Tables

  • Table 1: Global Market Value (USD million) Forecast by Region, 2020 to 2035
  • Table 2: Global Market Volume (Units) Forecast by Region, 2020 to 2035
  • Table 3: Global Market Value (USD million) Forecast by Material Type, 2020 to 2035
  • Table 4: Global Market Volume (Units) Forecast by Material Type, 2020 to 2035
  • Table 5: Global Market Value (USD million) Forecast by End-Use, 2020 to 2035
  • Table 6: Global Market Volume (Units) Forecast by End-Use, 2020 to 2035
  • Table 7: North America Market Value (USD million) Forecast by Country, 2020 to 2035
  • Table 8: North America Market Volume (Units) Forecast by Country, 2020 to 2035
  • Table 9: North America Market Value (USD million) Forecast by Material Type, 2020 to 2035
  • Table 10: North America Market Volume (Units) Forecast by Material Type, 2020 to 2035
  • Table 11: North America Market Value (USD million) Forecast by End-Use, 2020 to 2035
  • Table 12: North America Market Volume (Units) Forecast by End-Use, 2020 to 2035
  • Table 13: Latin America Market Value (USD million) Forecast by Country, 2020 to 2035
  • Table 14: Latin America Market Volume (Units) Forecast by Country, 2020 to 2035
  • Table 15: Latin America Market Value (USD million) Forecast by Material Type, 2020 to 2035
  • Table 16: Latin America Market Volume (Units) Forecast by Material Type, 2020 to 2035
  • Table 17: Latin America Market Value (USD million) Forecast by End-Use, 2020 to 2035
  • Table 18: Latin America Market Volume (Units) Forecast by End-Use, 2020 to 2035
  • Table 19: Western Europe Market Value (USD million) Forecast by Country, 2020 to 2035
  • Table 20: Western Europe Market Volume (Units) Forecast by Country, 2020 to 2035
  • Table 21: Western Europe Market Value (USD million) Forecast by Material Type, 2020 to 2035
  • Table 22: Western Europe Market Volume (Units) Forecast by Material Type, 2020 to 2035
  • Table 23: Western Europe Market Value (USD million) Forecast by End-Use, 2020 to 2035
  • Table 24: Western Europe Market Volume (Units) Forecast by End-Use, 2020 to 2035
  • Table 25: Eastern Europe Market Value (USD million) Forecast by Country, 2020 to 2035
  • Table 26: Eastern Europe Market Volume (Units) Forecast by Country, 2020 to 2035
  • Table 27: Eastern Europe Market Value (USD million) Forecast by Material Type, 2020 to 2035
  • Table 28: Eastern Europe Market Volume (Units) Forecast by Material Type, 2020 to 2035
  • Table 29: Eastern Europe Market Value (USD million) Forecast by End-Use, 2020 to 2035
  • Table 30: Eastern Europe Market Volume (Units) Forecast by End-Use, 2020 to 2035
  • Table 31: South Asia and Pacific Market Value (USD million) Forecast by Country, 2020 to 2035
  • Table 32: South Asia and Pacific Market Volume (Units) Forecast by Country, 2020 to 2035
  • Table 33: South Asia and Pacific Market Value (USD million) Forecast by Material Type, 2020 to 2035
  • Table 34: South Asia and Pacific Market Volume (Units) Forecast by Material Type, 2020 to 2035
  • Table 35: South Asia and Pacific Market Value (USD million) Forecast by End-Use, 2020 to 2035
  • Table 36: South Asia and Pacific Market Volume (Units) Forecast by End-Use, 2020 to 2035
  • Table 37: East Asia Market Value (USD million) Forecast by Country, 2020 to 2035
  • Table 38: East Asia Market Volume (Units) Forecast by Country, 2020 to 2035
  • Table 39: East Asia Market Value (USD million) Forecast by Material Type, 2020 to 2035
  • Table 40: East Asia Market Volume (Units) Forecast by Material Type, 2020 to 2035
  • Table 41: East Asia Market Value (USD million) Forecast by End-Use, 2020 to 2035
  • Table 42: East Asia Market Volume (Units) Forecast by End-Use, 2020 to 2035
  • Table 43: Middle East and Africa Market Value (USD million) Forecast by Country, 2020 to 2035
  • Table 44: Middle East and Africa Market Volume (Units) Forecast by Country, 2020 to 2035
  • Table 45: Middle East and Africa Market Value (USD million) Forecast by Material Type, 2020 to 2035
  • Table 46: Middle East and Africa Market Volume (Units) Forecast by Material Type, 2020 to 2035
  • Table 47: Middle East and Africa Market Value (USD million) Forecast by End-Use, 2020 to 2035
  • Table 48: Middle East and Africa Market Volume (Units) Forecast by End-Use, 2020 to 2035

List of Figures

  • Figure 1: Global Market Value (USD million) by Material Type, 2025 to 2035
  • Figure 2: Global Market Value (USD million) by End-Use, 2025 to 2035
  • Figure 3: Global Market Value (USD million) by Region, 2025 to 2035
  • Figure 4: Global Market Value (USD million) Analysis by Region, 2020 to 2035
  • Figure 5: Global Market Volume (Units) Analysis by Region, 2020 to 2035
  • Figure 6: Global Market Value Share (%) and BPS Analysis by Region, 2025 to 2035
  • Figure 7: Global Market Y-o-Y Growth (%) Projections by Region, 2025 to 2035
  • Figure 8: Global Market Value (USD million) Analysis by Material Type, 2020 to 2035
  • Figure 9: Global Market Volume (Units) Analysis by Material Type, 2020 to 2035
  • Figure 10: Global Market Value Share (%) and BPS Analysis by Material Type, 2025 to 2035
  • Figure 11: Global Market Y-o-Y Growth (%) Projections by Material Type, 2025 to 2035
  • Figure 12: Global Market Value (USD million) Analysis by End-Use, 2020 to 2035
  • Figure 13: Global Market Volume (Units) Analysis by End-Use, 2020 to 2035
  • Figure 14: Global Market Value Share (%) and BPS Analysis by End-Use, 2025 to 2035
  • Figure 15: Global Market Y-o-Y Growth (%) Projections by End-Use, 2025 to 2035
  • Figure 16: Global Market Attractiveness by Material Type, 2025 to 2035
  • Figure 17: Global Market Attractiveness by End-Use, 2025 to 2035
  • Figure 18: Global Market Attractiveness by Region, 2025 to 2035
  • Figure 19: North America Market Value (USD million) by Material Type, 2025 to 2035
  • Figure 20: North America Market Value (USD million) by End-Use, 2025 to 2035
  • Figure 21: North America Market Value (USD million) by Country, 2025 to 2035
  • Figure 22: North America Market Value (USD million) Analysis by Country, 2020 to 2035
  • Figure 23: North America Market Volume (Units) Analysis by Country, 2020 to 2035
  • Figure 24: North America Market Value Share (%) and BPS Analysis by Country, 2025 to 2035
  • Figure 25: North America Market Y-o-Y Growth (%) Projections by Country, 2025 to 2035
  • Figure 26: North America Market Value (USD million) Analysis by Material Type, 2020 to 2035
  • Figure 27: North America Market Volume (Units) Analysis by Material Type, 2020 to 2035
  • Figure 28: North America Market Value Share (%) and BPS Analysis by Material Type, 2025 to 2035
  • Figure 29: North America Market Y-o-Y Growth (%) Projections by Material Type, 2025 to 2035
  • Figure 30: North America Market Value (USD million) Analysis by End-Use, 2020 to 2035
  • Figure 31: North America Market Volume (Units) Analysis by End-Use, 2020 to 2035
  • Figure 32: North America Market Value Share (%) and BPS Analysis by End-Use, 2025 to 2035
  • Figure 33: North America Market Y-o-Y Growth (%) Projections by End-Use, 2025 to 2035
  • Figure 34: North America Market Attractiveness by Material Type, 2025 to 2035
  • Figure 35: North America Market Attractiveness by End-Use, 2025 to 2035
  • Figure 36: North America Market Attractiveness by Country, 2025 to 2035
  • Figure 37: Latin America Market Value (USD million) by Material Type, 2025 to 2035
  • Figure 38: Latin America Market Value (USD million) by End-Use, 2025 to 2035
  • Figure 39: Latin America Market Value (USD million) by Country, 2025 to 2035
  • Figure 40: Latin America Market Value (USD million) Analysis by Country, 2020 to 2035
  • Figure 41: Latin America Market Volume (Units) Analysis by Country, 2020 to 2035
  • Figure 42: Latin America Market Value Share (%) and BPS Analysis by Country, 2025 to 2035
  • Figure 43: Latin America Market Y-o-Y Growth (%) Projections by Country, 2025 to 2035
  • Figure 44: Latin America Market Value (USD million) Analysis by Material Type, 2020 to 2035
  • Figure 45: Latin America Market Volume (Units) Analysis by Material Type, 2020 to 2035
  • Figure 46: Latin America Market Value Share (%) and BPS Analysis by Material Type, 2025 to 2035
  • Figure 47: Latin America Market Y-o-Y Growth (%) Projections by Material Type, 2025 to 2035
  • Figure 48: Latin America Market Value (USD million) Analysis by End-Use, 2020 to 2035
  • Figure 49: Latin America Market Volume (Units) Analysis by End-Use, 2020 to 2035
  • Figure 50: Latin America Market Value Share (%) and BPS Analysis by End-Use, 2025 to 2035
  • Figure 51: Latin America Market Y-o-Y Growth (%) Projections by End-Use, 2025 to 2035
  • Figure 52: Latin America Market Attractiveness by Material Type, 2025 to 2035
  • Figure 53: Latin America Market Attractiveness by End-Use, 2025 to 2035
  • Figure 54: Latin America Market Attractiveness by Country, 2025 to 2035
  • Figure 55: Western Europe Market Value (USD million) by Material Type, 2025 to 2035
  • Figure 56: Western Europe Market Value (USD million) by End-Use, 2025 to 2035
  • Figure 57: Western Europe Market Value (USD million) by Country, 2025 to 2035
  • Figure 58: Western Europe Market Value (USD million) Analysis by Country, 2020 to 2035
  • Figure 59: Western Europe Market Volume (Units) Analysis by Country, 2020 to 2035
  • Figure 60: Western Europe Market Value Share (%) and BPS Analysis by Country, 2025 to 2035
  • Figure 61: Western Europe Market Y-o-Y Growth (%) Projections by Country, 2025 to 2035
  • Figure 62: Western Europe Market Value (USD million) Analysis by Material Type, 2020 to 2035
  • Figure 63: Western Europe Market Volume (Units) Analysis by Material Type, 2020 to 2035
  • Figure 64: Western Europe Market Value Share (%) and BPS Analysis by Material Type, 2025 to 2035
  • Figure 65: Western Europe Market Y-o-Y Growth (%) Projections by Material Type, 2025 to 2035
  • Figure 66: Western Europe Market Value (USD million) Analysis by End-Use, 2020 to 2035
  • Figure 67: Western Europe Market Volume (Units) Analysis by End-Use, 2020 to 2035
  • Figure 68: Western Europe Market Value Share (%) and BPS Analysis by End-Use, 2025 to 2035
  • Figure 69: Western Europe Market Y-o-Y Growth (%) Projections by End-Use, 2025 to 2035
  • Figure 70: Western Europe Market Attractiveness by Material Type, 2025 to 2035
  • Figure 71: Western Europe Market Attractiveness by End-Use, 2025 to 2035
  • Figure 72: Western Europe Market Attractiveness by Country, 2025 to 2035
  • Figure 73: Eastern Europe Market Value (USD million) by Material Type, 2025 to 2035
  • Figure 74: Eastern Europe Market Value (USD million) by End-Use, 2025 to 2035
  • Figure 75: Eastern Europe Market Value (USD million) by Country, 2025 to 2035
  • Figure 76: Eastern Europe Market Value (USD million) Analysis by Country, 2020 to 2035
  • Figure 77: Eastern Europe Market Volume (Units) Analysis by Country, 2020 to 2035
  • Figure 78: Eastern Europe Market Value Share (%) and BPS Analysis by Country, 2025 to 2035
  • Figure 79: Eastern Europe Market Y-o-Y Growth (%) Projections by Country, 2025 to 2035
  • Figure 80: Eastern Europe Market Value (USD million) Analysis by Material Type, 2020 to 2035
  • Figure 81: Eastern Europe Market Volume (Units) Analysis by Material Type, 2020 to 2035
  • Figure 82: Eastern Europe Market Value Share (%) and BPS Analysis by Material Type, 2025 to 2035
  • Figure 83: Eastern Europe Market Y-o-Y Growth (%) Projections by Material Type, 2025 to 2035
  • Figure 84: Eastern Europe Market Value (USD million) Analysis by End-Use, 2020 to 2035
  • Figure 85: Eastern Europe Market Volume (Units) Analysis by End-Use, 2020 to 2035
  • Figure 86: Eastern Europe Market Value Share (%) and BPS Analysis by End-Use, 2025 to 2035
  • Figure 87: Eastern Europe Market Y-o-Y Growth (%) Projections by End-Use, 2025 to 2035
  • Figure 88: Eastern Europe Market Attractiveness by Material Type, 2025 to 2035
  • Figure 89: Eastern Europe Market Attractiveness by End-Use, 2025 to 2035
  • Figure 90: Eastern Europe Market Attractiveness by Country, 2025 to 2035
  • Figure 91: South Asia and Pacific Market Value (USD million) by Material Type, 2025 to 2035
  • Figure 92: South Asia and Pacific Market Value (USD million) by End-Use, 2025 to 2035
  • Figure 93: South Asia and Pacific Market Value (USD million) by Country, 2025 to 2035
  • Figure 94: South Asia and Pacific Market Value (USD million) Analysis by Country, 2020 to 2035
  • Figure 95: South Asia and Pacific Market Volume (Units) Analysis by Country, 2020 to 2035
  • Figure 96: South Asia and Pacific Market Value Share (%) and BPS Analysis by Country, 2025 to 2035
  • Figure 97: South Asia and Pacific Market Y-o-Y Growth (%) Projections by Country, 2025 to 2035
  • Figure 98: South Asia and Pacific Market Value (USD million) Analysis by Material Type, 2020 to 2035
  • Figure 99: South Asia and Pacific Market Volume (Units) Analysis by Material Type, 2020 to 2035
  • Figure 100: South Asia and Pacific Market Value Share (%) and BPS Analysis by Material Type, 2025 to 2035
  • Figure 101: South Asia and Pacific Market Y-o-Y Growth (%) Projections by Material Type, 2025 to 2035
  • Figure 102: South Asia and Pacific Market Value (USD million) Analysis by End-Use, 2020 to 2035
  • Figure 103: South Asia and Pacific Market Volume (Units) Analysis by End-Use, 2020 to 2035
  • Figure 104: South Asia and Pacific Market Value Share (%) and BPS Analysis by End-Use, 2025 to 2035
  • Figure 105: South Asia and Pacific Market Y-o-Y Growth (%) Projections by End-Use, 2025 to 2035
  • Figure 106: South Asia and Pacific Market Attractiveness by Material Type, 2025 to 2035
  • Figure 107: South Asia and Pacific Market Attractiveness by End-Use, 2025 to 2035
  • Figure 108: South Asia and Pacific Market Attractiveness by Country, 2025 to 2035
  • Figure 109: East Asia Market Value (USD million) by Material Type, 2025 to 2035
  • Figure 110: East Asia Market Value (USD million) by End-Use, 2025 to 2035
  • Figure 111: East Asia Market Value (USD million) by Country, 2025 to 2035
  • Figure 112: East Asia Market Value (USD million) Analysis by Country, 2020 to 2035
  • Figure 113: East Asia Market Volume (Units) Analysis by Country, 2020 to 2035
  • Figure 114: East Asia Market Value Share (%) and BPS Analysis by Country, 2025 to 2035
  • Figure 115: East Asia Market Y-o-Y Growth (%) Projections by Country, 2025 to 2035
  • Figure 116: East Asia Market Value (USD million) Analysis by Material Type, 2020 to 2035
  • Figure 117: East Asia Market Volume (Units) Analysis by Material Type, 2020 to 2035
  • Figure 118: East Asia Market Value Share (%) and BPS Analysis by Material Type, 2025 to 2035
  • Figure 119: East Asia Market Y-o-Y Growth (%) Projections by Material Type, 2025 to 2035
  • Figure 120: East Asia Market Value (USD million) Analysis by End-Use, 2020 to 2035
  • Figure 121: East Asia Market Volume (Units) Analysis by End-Use, 2020 to 2035
  • Figure 122: East Asia Market Value Share (%) and BPS Analysis by End-Use, 2025 to 2035
  • Figure 123: East Asia Market Y-o-Y Growth (%) Projections by End-Use, 2025 to 2035
  • Figure 124: East Asia Market Attractiveness by Material Type, 2025 to 2035
  • Figure 125: East Asia Market Attractiveness by End-Use, 2025 to 2035
  • Figure 126: East Asia Market Attractiveness by Country, 2025 to 2035
  • Figure 127: Middle East and Africa Market Value (USD million) by Material Type, 2025 to 2035
  • Figure 128: Middle East and Africa Market Value (USD million) by End-Use, 2025 to 2035
  • Figure 129: Middle East and Africa Market Value (USD million) by Country, 2025 to 2035
  • Figure 130: Middle East and Africa Market Value (USD million) Analysis by Country, 2020 to 2035
  • Figure 131: Middle East and Africa Market Volume (Units) Analysis by Country, 2020 to 2035
  • Figure 132: Middle East and Africa Market Value Share (%) and BPS Analysis by Country, 2025 to 2035
  • Figure 133: Middle East and Africa Market Y-o-Y Growth (%) Projections by Country, 2025 to 2035
  • Figure 134: Middle East and Africa Market Value (USD million) Analysis by Material Type, 2020 to 2035
  • Figure 135: Middle East and Africa Market Volume (Units) Analysis by Material Type, 2020 to 2035
  • Figure 136: Middle East and Africa Market Value Share (%) and BPS Analysis by Material Type, 2025 to 2035
  • Figure 137: Middle East and Africa Market Y-o-Y Growth (%) Projections by Material Type, 2025 to 2035
  • Figure 138: Middle East and Africa Market Value (USD million) Analysis by End-Use, 2020 to 2035
  • Figure 139: Middle East and Africa Market Volume (Units) Analysis by End-Use, 2020 to 2035
  • Figure 140: Middle East and Africa Market Value Share (%) and BPS Analysis by End-Use, 2025 to 2035
  • Figure 141: Middle East and Africa Market Y-o-Y Growth (%) Projections by End-Use, 2025 to 2035
  • Figure 142: Middle East and Africa Market Attractiveness by Material Type, 2025 to 2035
  • Figure 143: Middle East and Africa Market Attractiveness by End-Use, 2025 to 2035
  • Figure 144: Middle East and Africa Market Attractiveness by Country, 2025 to 2035

Frequently Asked Questions

How big is the ultrafiltration membranes market?

The industry is set to hit USD 5.8 billion in 2025.

What is the outlook on ultrafiltration membrane sales?

The market is projected to reach USD 12.5 billion by 2035.

Who are the major ultrafiltration membrane companies?

Key companies include DuPont, Asahi Kasei Corp., Toray Industries Inc., Alfa Laval, Pentair, 3M, BASF SE (Inge AG), Baxter International, Dow Chemical Co., Fresenius Medical Care, GE, Cantel Medical, Entegris Inc., Corning Inc., and GEA Westfalia Separator Inc.

Which country is set to witness fastest growth in ultrafiltration membranes market?

South Korean industry, set to witness 9.7% CAGR during the study period, is slated to experience fastest growth.

Which material is widely used to develop ultrafiltration membranes?

Polymers are being widely used.

Explore Similar Insights

Future Market Insights

Ultrafiltration Membranes Market