Aircraft Textile Market Size, Share, and Forecast Outlook 2025 to 2035

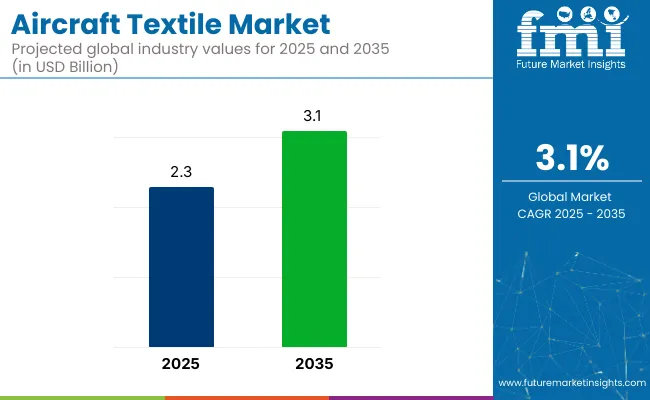
The aircraft textile market is anticipated to expand from USD 2.3 billion in 2025 to USD 3.1 billion by 2035, reflecting a CAGR of 3.1% over the forecast period. The demand is expected to be driven by evolving airline cabin aesthetics, growing emphasis on passenger comfort, and stringent safety regulations that govern material selection. North America and Western Europe are projected to remain the leading markets, owing to fleet modernization and premium cabin refurbishments.
Quick Stats in Aircraft Textile Market

  • Market Value (2025): USD 2.3 billion
  • Forecast Value (2035): USD 3.1 billion
  • Forecast CAGR: 3.1%
  • Top Product Type: Woven Fabrics (58% market share in 2025)
  • Leading Application Segment: Seat Fabrics (65% market share in 2025)
  • Key Growth Country: China (5.0% CAGR)

Aircraft Textile Market

As of 2025, the aircraft textile market maintains a niche yet essential share across several broader parent markets. Within the global aerospace interior market, it holds an estimated 6-8% share, as textiles play a critical role in passenger seating, carpeting, and cabin paneling.

In the technical textiles market, aircraft textiles account for around 2-3%, given their use in high-performance applications requiring fire resistance and durability. Within the aircraft components market, its contribution is approximately 1-2%, due to its role in non-structural interior parts.

In the aviation supply chain market, the share stands at about 0.5-1%, as textiles represent a smaller but necessary category. In the transportation textiles market, aircraft textiles contribute around 3-5%, reflecting aviation’s share within overall transit-focused textile demand.

Innovation is being seen in antimicrobial coatings, stain-resistant fabrics, and 3D-knitted textiles that reduce waste during production. Manufacturers are also focusing on customizability to cater to both commercial and private aviation interiors. As the aviation industry recovers and airlines compete on passenger experience, aircraft textiles are being reimagined as key differentiators in cabin design and operational efficiency.

Analyzing Aircraft Textile Market by Top Investment Segments

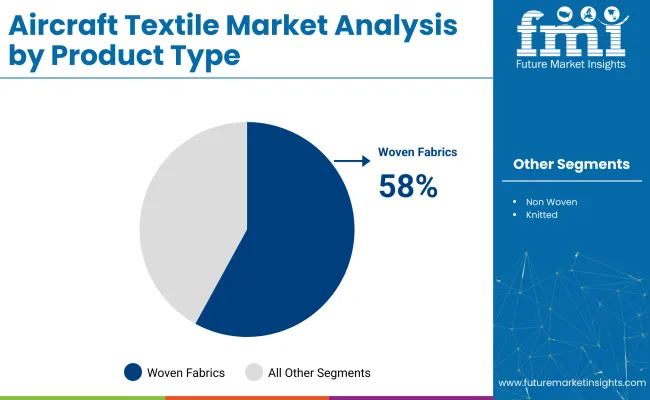
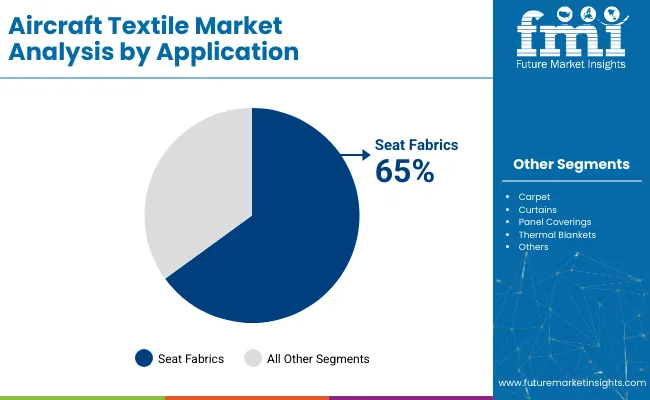
Woven fabrics are projected to dominate the product type segment with a 58% market share by 2025, while seat fabrics applications are expected to lead the application segment with a 65% share, driven by rising demand for lightweight and flame-retardant materials in aircraft interiors.

Woven Aviation Fabrics to Dominate Product Type Segment with 58% Market Share

Woven aviation fabrics are projected to dominate the product type segment, accounting for 58% of the global market share by 2025. These materials are preferred for their durability, safety compliance, and lightweight nature in aviation interiors.
  • Aircraft manufacturers and airlines are increasingly relying on woven textiles for seat covers, curtains, and wall linings due to their resistance to wear, fire-retardant properties, and aesthetic appeal.
  • The growing focus on fuel efficiency and cabin modernization has further accelerated the adoption of high-performance woven materials. Leading textile manufacturers are developing innovative fabric blends to meet regulatory and passenger comfort demands in both commercial and private aircraft.

Aircraft Textile Market Analysis By Product Type

Seat Fabrics to Lead Application Segment with 65% Market Share

Seat fabrics are expected to lead the application segment, accounting for 65% of the global market share by 2025. Demand is being propelled by greater emphasis on passenger comfort and regulatory compliance in cabin interiors.
  • Advanced textile technologies are being adopted for seat coverings that offer stain resistance, UV stability, and enhanced cushioning for long-haul travel.
  • OEMs and retrofit service providers are collaborating with textile manufacturers to develop flame-retardant and eco-friendly fabrics. Lightweight properties, cost-effectiveness, and FAA-certified standards have become essential for seat fabric procurement across new aircraft and cabin refurbishment projects.

Aircraft Textile Market Analysis By Application

First Fit (OEM) to Lead Sales Channel Segment with 70% Market Share

The first fit (OEM) segment is projected to capture approximately 70% of the market share by 2025. Aircraft manufacturers are incorporating premium textile materials into cabins during initial assembly to meet evolving passenger and airline expectations.

  • OEM suppliers are investing in lightweight and compliant materials to reduce cabin weight and enhance aesthetic appeal. Textile materials used in OEM installation must meet strict industry certifications regarding flammability, durability, and environmental impact.
  • Collaboration between OEM cabin interior specialists and textile developers has been intensified to ensure seamless integration of performance fabrics. The growing commercial aircraft backlog continues to boost OEM-centric textile procurement.

Top Aircraft Textile Market Dynamics

The industry is evolving rapidly due to increased air travel, rising demand for lightweight and durable materials, and a focus on passenger comfort and cabin aesthetics. Airlines and aircraft OEMs are working with textile suppliers to develop flame-retardant, low-weight, and customizable fabrics that meet strict regulatory and design standards.

High Demand for Seating Upholstery and Cabin Interior Applications

Aircraft textiles are extensively used in seat covers, headrests, carpets, curtains, and wall panels to enhance cabin ambiance and passenger comfort. Airlines are selecting materials that offer durability, stain resistance, and ease of maintenance. Lightweight textiles are preferred to support fuel efficiency goals, while fabric color and texture are tailored to airline branding and premium cabin differentiation.

  • Used in seats, carpets, and dividers to improve comfort and cabin aesthetics.
  • Airlines prefer lightweight, stain-resistant, and durable upholstery materials.
  • Customized textures and colors are aligned with airline branding strategies.

Emphasis on Fire Safety, Compliance, and Regulatory Standards

Strict fire safety regulations in aviation are driving the adoption of flame-retardant textiles that comply with FAA and EASA standards. Materials are engineered to withstand ignition, reduce smoke emission, and limit toxic gas release during emergencies. Textile suppliers are investing in advanced coatings and fiber blends to meet evolving safety benchmarks and certification requirements.
  • Flame-retardant fabrics are essential to meet aviation fire safety regulations.
  • Textiles are engineered to reduce smoke and toxic emissions in emergencies.
  • Compliance with FAA and EASA standards is a critical factor for market approval.

Analysis of Top Countries Supplying, Designing, and Customizing Aircraft Textile Solutions Globally

Country Wise Analysis Of Aircraft Textile Market Cagr 2025 To 2035

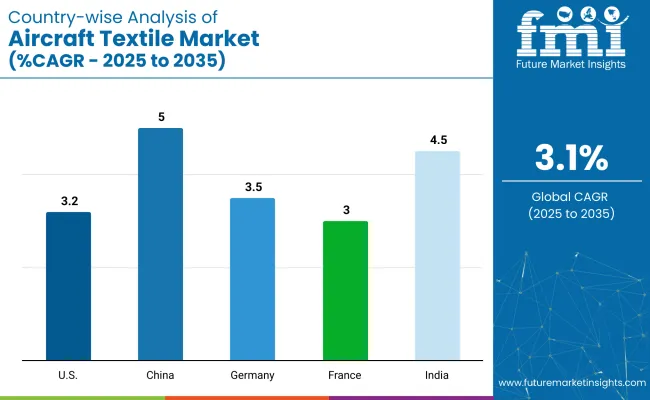
Countries CAGR (2025 to 2035)
China 5.0%
India 4.5%
Germany 3.5%
United States 3.2%
France 3.0%

The global market is projected to grow at a CAGR of 3.1% from 2025 to 2035, fueled by increasing aircraft deliveries, cabin refurbishments, and regulatory shifts toward lighter, safer cabin materials. China leads the top five countries with a CAGR of 5.0%, supported by aggressive airline expansion and growing domestic supply capabilities.

India follows with a 4.5% CAGR, driven by low-cost carriers and regional aircraft demand. Mature aviation hubs such as Germany (3.5%), the USA (3.2%), and France (3.0%) are prioritizing in-cabin comfort, textile sustainability, and refurbishment cycles.

While BRICS nations like China and India focus on capacity-building and local sourcing, OECD members such as Germany, France, and the USA are driving innovation in flame-retardant, eco-certified, and aesthetic-centric cabin textiles.

The report provides insights across 40+ countries. The five below are highlighted for their strategic influence and growth trajectory.

Demand Forecast for Aircraft Textile Market in China

China’s market is forecast to grow at a CAGR of 5.0%, the highest among the five, reflecting rapid domestic airline fleet expansion and airport infrastructure growth across Tier 2 and Tier 3 cities. The country is investing in vertically integrated cabin interior supply chains, including synthetic and blended fabric production for seat covers and flooring.

Regional OEMs such as COMAC are adopting localized textile sourcing to reduce cost and comply with safety standards for narrow-body jets. Demand is particularly high for durable, low-weight seat upholstery in fast-turnaround domestic carriers.

  • COMAC and regional OEMs are sourcing cabin fabrics locally.
  • Tier 2 airports are driving procurement of short-haul interior materials.
  • High turnover LCCs require wear-resistant, easy-clean seat fabrics.

Growth Outlook for Aircraft Textile Market in India

Indian market is projected to expand at a CAGR of 4.5%, driven by the surge in domestic air travel and ongoing fleet acquisitions by budget carriers. A notable differentiator is India’s growing reliance on retrofit solutions for aging aircraft interiors, especially among legacy carriers.

The demand is skewed toward low-maintenance materials such as synthetic leather seat covers, antimicrobial curtains, and stain-resistant carpets. Domestic textile firms are entering the aerospace sector via public-private partnerships and DGCA-certified production hubs focused on flame-retardant weaves.

  • Retrofit demand is high among legacy carriers upgrading cabin interiors.
  • Public-private investment is fostering DGCA-certified textile manufacturing.
  • Airlines favor cost-effective synthetics for high-use domestic routes.

Analysis of Aircraft Textile Market in Germany

Germany is forecast to grow at a CAGR of 3.5%, supported by strong demand from its embedded aerospace manufacturing sector and premium airline refurbishment cycles. A defining characteristic of the German market is its focus on recyclable and low-smoke emission textiles in line with EU aviation material directives.

German suppliers are leading in developing eco-engineered wool blends and technical textiles with integrated temperature regulation for business and first-class cabins. Innovations in antimicrobial coatings and biodegradable yarns are gaining traction in VIP and charter jet interiors.

  • Germany prioritizes EU-compliant recyclable and low-smoke textiles.
  • Cabin comfort enhanced through phase-change textile technologies.
  • Biodegradable materials gaining adoption in charter and VIP jets.

Future Trends in Aircraft Textile Market in the United States

The USA market is expanding at a CAGR of 3.2%, underpinned by high aircraft replacement rates and a mature MRO ecosystem. What differentiates the USA is its emphasis on multifunctional textiles-materials that combine flame retardancy with anti-static, stain resistance, and moisture-wicking capabilities.

USA-based MRO facilities and cabin suppliers are innovating with modular textile systems that simplify installation and reduce maintenance time. Demand is especially high in regional and private aviation, where branding, comfort, and rapid refurb cycles intersect.

  • Modular textile systems reduce installation and servicing time.
  • Private and regional aviation sectors drive premium textile demand.
  • Multifunctional fabrics combine safety and operational convenience.

Aircraft Textile Market Expansion Overview in France

France is projected to grow at a CAGR of 3.0%, reflecting a stable outlook driven by its deep integration into Airbus supply chains and sustainable aviation goals. The French market is unique for its focus on aesthetics and brand personalization in cabin textiles.

Airlines and OEMs are collaborating with design studios to customize seating fabrics, wall panels, and curtains to align with cabin ambience themes. France is also investing in closed-loop textile recycling models for cabin interiors, especially for short-haul aircraft, aligning with national green aviation targets.

  • Textile customization is closely tied to airline cabin branding strategy.
  • Closed-loop recycling trials underway in cabin materials for narrow-body jets.
  • Design firms collaborate with OEMs on bespoke fabric aesthetics.

Leading Aircraft Textile Companies

The industry is moderately consolidated, with prominent players such as Lantal, Tapis Corporation, and Tex Tech Industries leading the segment through specialized innovations in flame-retardant, lightweight, and durable fabrics. Lantal is recognized for its complete aircraft textile solutions including seat covers, carpets, and curtains, offering both design customization and technical compliance. Tapis Corporation specializes in eco-friendly synthetic leather and soft goods tailored for premium cabin interiors.

Other active players such as Tisca Tiara and DIATEX SAS provide woven and nonwoven technical fabrics for both commercial and military aircraft. Companies like Belgraver Aircraft Interiors and Acme Mills focus on refurbishments and aftermarket solutions, while SNT Group and NIEMLA enhance their footprint through regional contracts and customized offerings for emerging airlines.

Recent Aircraft Textile Industry News

In April 2025, a consortium comprising Studio ID, TrendWorks, Sabeti Wain Aerospace and Botany Weaving launched Monova PE, the world’s first fully recyclable mono-material laminated aircraft seat cover. Made entirely of polyester, Monova PE supports closed-loop recycling, reduces cabin weight and aligns with growing sustainability goals in aviation interior design.

Report Coverage and Scope Summary

Report Attributes Details
Market Size (2025) USD 2.3 billion
Projected Market Size (2035) USD 3.1 billion
CAGR (2025 to 2035) 3.1%
Base Year for Estimation 2024
Historical Period 2020 to 2024
Projections Period 2025 to 2035
Quantitative Units USD billion for market value
Product Types Analyzed (Segment 1) Woven, Non-Woven, Knitted Fabrics
Applications Analyzed (Segment 2) Seat Fabrics, Carpet, Curtains, Panel Coverings, Thermal Blankets
Sales Channels Analyzed (Segment 3) First Fit, Aftermarket
Regions Covered North America, Latin America, Eastern Europe, Western Europe, South Asia & Pacific, East Asia, Middle East & Africa
Countries Covered United States, Canada, Germany, United Kingdom, France, Japan, China, India, South Korea, Brazil
Key Players Tex Tech Industries, Tisca Tiara, Tapis Corporation, Acme Mills, Belgraver Aircraft Interiors, Lantal, DIATEX SAS, NIEMLA, SNT Group
Additional Attributes Dollar sales by application and sales channel, growing aircraft fleet size, emphasis on lightweight and fire-retardant materials, and steady demand in both commercial and defense aviation sectors.

Leading Players in Aircraft Textile Industry

  • Tex Tech Industries
  • Tisca Tiara
  • Tapis Corporation
  • Acme Mills
  • Belgraver Aircraft Interiors
  • Lantal
  • DIATEX SAS
  • NIEMLA
  • SNT Group

Aircraft Textile Market Analyzed by Key Investment Segments

By Product Type:

The market is segmented by product type into woven, non-woven, and knitted fabrics.

By Application:

Key applications include seat fabrics, carpet, curtains, panel coverings, and thermal blankets.

By Sales Channel:

Based on the sales channel, the market is divided into first fit and aftermarket segments.

By Region:

Regionally, the market spans North America, Latin America, Eastern Europe, Western Europe, South Asia & Pacific, East Asia, and the Middle East & Africa.

Table of Content

  1. Executive Summary
    • Global Market Outlook
    • Demand-side Trends
    • Supply-side Trends
    • Technology Roadmap Analysis
    • Analysis and Recommendations
  2. Market Overview
    • Market Coverage / Taxonomy
    • Market Definition / Scope / Limitations
  3. Market Background
    • Market Dynamics
      • Drivers
      • Restraints
      • Opportunity
      • Trends
    • Scenario Forecast
      • Demand in Optimistic Scenario
      • Demand in Likely Scenario
      • Demand in Conservative Scenario
    • Opportunity Map Analysis
    • Product Life Cycle Analysis
    • Supply Chain Analysis
      • Supply Side Participants and their Roles
        • Producers
        • Mid-Level Participants (Traders/ Agents/ Brokers)
        • Wholesalers and Distributors
      • Value Added and Value Created at Node in the Supply Chain
      • List of Raw Material Suppliers
      • List of Existing and Potential Buyer’s
    • Investment Feasibility Matrix
    • Value Chain Analysis
      • Profit Margin Analysis
      • Wholesalers and Distributors
      • Retailers
    • PESTLE and Porter’s Analysis
    • Regulatory Landscape
      • By Key Regions
      • By Key Countries
    • Regional Parent Market Outlook
    • Production and Consumption Statistics
    • Import and Export Statistics
  4. Global Market Analysis 2020 to 2024 and Forecast, 2025 to 2035
    • Historical Market Size Value (USD Billion) & Volume (Metric tons) Analysis, 2020 to 2024
    • Current and Future Market Size Value (USD Billion) & Volume (Metric tons) Projections, 2025 to 2035
      • Y-o-Y Growth Trend Analysis
      • Absolute $ Opportunity Analysis
  5. Global Market Pricing Analysis 2020 to 2024 and Forecast 2025 to 2035
  6. Global Market Analysis 2020 to 2024 and Forecast 2025 to 2035, By Product Type
    • Introduction / Key Findings
    • Historical Market Size Value (USD Billion) & Volume (Metric tons) Analysis By Product Type, 2020 to 2024
    • Current and Future Market Size Value (USD Billion) & Volume (Metric tons) Analysis and Forecast By Product Type, 2025 to 2035
      • Woven
      • Non-Woven
      • Knitted Fabrics
    • Y-o-Y Growth Trend Analysis By Product Type, 2020 to 2024
    • Absolute $ Opportunity Analysis By Product Type, 2025 to 2035
  7. Global Market Analysis 2020 to 2024 and Forecast 2025 to 2035, By Application
    • Introduction / Key Findings
    • Historical Market Size Value (USD Billion) & Volume (Metric tons) Analysis By Application, 2020 to 2024
    • Current and Future Market Size Value (USD Billion) & Volume (Metric tons) Analysis and Forecast By Application, 2025 to 2035
      • Seat Fabrics
      • Carpet
      • Curtains
      • Panel Coverings
      • Thermal Blankets
    • Y-o-Y Growth Trend Analysis By Application, 2020 to 2024
    • Absolute $ Opportunity Analysis By Application, 2025 to 2035
  8. Global Market Analysis 2020 to 2024 and Forecast 2025 to 2035, By Sales Channel
    • Introduction / Key Findings
    • Historical Market Size Value (USD Billion) & Volume (Metric tons) Analysis By Sales Channel, 2020 to 2024
    • Current and Future Market Size Value (USD Billion) & Volume (Metric tons) Analysis and Forecast By Sales Channel, 2025 to 2035
      • First Fit
      • Aftermarket
    • Y-o-Y Growth Trend Analysis By Sales Channel, 2020 to 2024
    • Absolute $ Opportunity Analysis By Sales Channel, 2025 to 2035
  9. Global Market Analysis 2020 to 2024 and Forecast 2025 to 2035, By Region
    • Introduction
    • Historical Market Size Value (USD Billion) & Volume (Metric tons) Analysis By Region, 2020 to 2024
    • Current Market Size Value (USD Billion) & Volume (Metric tons) Analysis and Forecast By Region, 2025 to 2035
      • North America
      • Latin America
      • Western Europe
      • Eastern Europe
      • East Asia
      • South Asia & Pacific
      • Middle East and Africa
    • Market Attractiveness Analysis By Region
  10. North America Market Analysis 2020 to 2024 and Forecast 2025 to 2035, By Country
    • Historical Market Size Value (USD Billion) & Volume (Metric tons) Trend Analysis By Market Taxonomy, 2020 to 2024
    • Market Size Value (USD Billion) & Volume (Metric tons) Forecast By Market Taxonomy, 2025 to 2035
      • By Country
        • USA
        • Canada
        • Mexico
      • By Product Type
      • By Application
      • By Sales Channel
    • Market Attractiveness Analysis
      • By Country
      • By Product Type
      • By Application
      • By Sales Channel
    • Key Takeaways
  11. Latin America Market Analysis 2020 to 2024 and Forecast 2025 to 2035, By Country
    • Historical Market Size Value (USD Billion) & Volume (Metric tons) Trend Analysis By Market Taxonomy, 2020 to 2024
    • Market Size Value (USD Billion) & Volume (Metric tons) Forecast By Market Taxonomy, 2025 to 2035
      • By Country
        • Brazil
        • Argentina
        • Rest of LATAM
      • By Product Type
      • By Application
      • By Sales Channel
    • Market Attractiveness Analysis
      • By Country
      • By Product Type
      • By Application
      • By Sales Channel
    • Key Takeaways
  12. Western Europe Market Analysis 2020 to 2024 and Forecast 2025 to 2035, By Country
    • Historical Market Size Value (USD Billion) & Volume (Metric tons) Trend Analysis By Market Taxonomy, 2020 to 2024
    • Market Size Value (USD Billion) & Volume (Metric tons) Forecast By Market Taxonomy, 2025 to 2035
      • By Country
        • Germany
        • Italy
        • France
        • UK
        • Spain
        • BENELUX
        • Nordic
        • Rest of W.Europe
      • By Product Type
      • By Application
      • By Sales Channel
    • Market Attractiveness Analysis
      • By Country
      • By Product Type
      • By Application
      • By Sales Channel
    • Key Takeaways
  13. Eastern Europe Market Analysis 2020 to 2024 and Forecast 2025 to 2035, By Country
    • Historical Market Size Value (USD Billion) & Volume (Metric tons) Trend Analysis By Market Taxonomy, 2020 to 2024
    • Market Size Value (USD Billion) & Volume (Metric tons) Forecast By Market Taxonomy, 2025 to 2035
      • By Country
        • Russia
        • Hungary
        • Poland
        • Balkan & Baltics
        • Rest of E. Europe
      • By Product Type
      • By Application
      • By Sales Channel
    • Market Attractiveness Analysis
      • By Country
      • By Product Type
      • By Application
      • By Sales Channel
    • Key Takeaways
  14. East Asia Market Analysis 2020 to 2024 and Forecast 2025 to 2035, By Country
    • Historical Market Size Value (USD Billion) & Volume (Metric tons) Trend Analysis By Market Taxonomy, 2020 to 2024
    • Market Size Value (USD Billion) & Volume (Metric tons) Forecast By Market Taxonomy, 2025 to 2035
      • By Country
        • China
        • Japan
        • South Korea
      • By Product Type
      • By Application
      • By Sales Channel
    • Market Attractiveness Analysis
      • By Country
      • By Product Type
      • By Application
      • By Sales Channel
    • Key Takeaways
  15. South Asia & Pacific Market Analysis 2020 to 2024 and Forecast 2025 to 2035, By Country
    • Historical Market Size Value (USD Billion) & Volume (Metric tons) Trend Analysis By Market Taxonomy, 2020 to 2024
    • Market Size Value (USD Billion) & Volume (Metric tons) Forecast By Market Taxonomy, 2025 to 2035
      • By Country
        • India
        • Australia & New Zealand
        • ASEAN
        • Rest of SAP
      • By Product Type
      • By Application
      • By Sales Channel
    • Market Attractiveness Analysis
      • By Country
      • By Product Type
      • By Application
      • By Sales Channel
    • Key Takeaways
  16. Middle East and Africa Market Analysis 2020 to 2024 and Forecast 2025 to 2035, By Country
    • Historical Market Size Value (USD Billion) & Volume (Metric tons) Trend Analysis By Market Taxonomy, 2020 to 2024
    • Market Size Value (USD Billion) & Volume (Metric tons) Forecast By Market Taxonomy, 2025 to 2035
      • By Country
        • GCC Countries
        • Northern Africa
        • South Africa
        • Turkiye
        • Rest of MEA
      • By Product Type
      • By Application
      • By Sales Channel
    • Market Attractiveness Analysis
      • By Country
      • By Product Type
      • By Application
      • By Sales Channel
    • Key Takeaways
  17. Key Countries Market Analysis
    • USA
      • Pricing Analysis
      • Market Share Analysis, 2024
        • By Product Type
        • By Application
        • By Sales Channel
    • Canada
      • Pricing Analysis
      • Market Share Analysis, 2024
        • By Product Type
        • By Application
        • By Sales Channel
    • Brazil
      • Pricing Analysis
      • Market Share Analysis, 2024
        • By Product Type
        • By Application
        • By Sales Channel
    • Mexico
      • Pricing Analysis
      • Market Share Analysis, 2024
        • By Product Type
        • By Application
        • By Sales Channel
    • Argentina
      • Pricing Analysis
      • Market Share Analysis, 2024
        • By Product Type
        • By Application
        • By Sales Channel
  18. Market Structure Analysis
    • Competition Dashboard
    • Competition Benchmarking
    • Market Share Analysis of Top Players
      • By Regional
      • By Product Type
      • By Application
      • By Sales Channel
  19. Competition Analysis
    • Competition Deep Dive
      • Tex Tech Industries
        • Overview
        • Product Portfolio
        • Profitability by Market Segments (Product/Age /Sales Channel/Region)
        • Sales Footprint
        • Strategy Overview
          • Marketing Strategy
          • Product Strategy
          • Channel Strategy
      • Tisca Tiara
        • Overview
        • Product Portfolio
        • Profitability by Market Segments (Product/Age /Sales Channel/Region)
        • Sales Footprint
        • Strategy Overview
          • Marketing Strategy
          • Product Strategy
          • Channel Strategy
      • Tapis Corporation
        • Overview
        • Product Portfolio
        • Profitability by Market Segments (Product/Age /Sales Channel/Region)
        • Sales Footprint
        • Strategy Overview
          • Marketing Strategy
          • Product Strategy
          • Channel Strategy
      • Acme Mills
        • Overview
        • Product Portfolio
        • Profitability by Market Segments (Product/Age /Sales Channel/Region)
        • Sales Footprint
        • Strategy Overview
          • Marketing Strategy
          • Product Strategy
          • Channel Strategy
      • Belgraver Aircraft Interiors
        • Overview
        • Product Portfolio
        • Profitability by Market Segments (Product/Age /Sales Channel/Region)
        • Sales Footprint
        • Strategy Overview
          • Marketing Strategy
          • Product Strategy
          • Channel Strategy
      • Lantal
        • Overview
        • Product Portfolio
        • Profitability by Market Segments (Product/Age /Sales Channel/Region)
        • Sales Footprint
        • Strategy Overview
          • Marketing Strategy
          • Product Strategy
          • Channel Strategy
      • DIATEX SAS
        • Overview
        • Product Portfolio
        • Profitability by Market Segments (Product/Age /Sales Channel/Region)
        • Sales Footprint
        • Strategy Overview
          • Marketing Strategy
          • Product Strategy
          • Channel Strategy
      • NIEMLA
        • Overview
        • Product Portfolio
        • Profitability by Market Segments (Product/Age /Sales Channel/Region)
        • Sales Footprint
        • Strategy Overview
          • Marketing Strategy
          • Product Strategy
          • Channel Strategy
      • SNT Group
        • Overview
        • Product Portfolio
        • Profitability by Market Segments (Product/Age /Sales Channel/Region)
        • Sales Footprint
        • Strategy Overview
          • Marketing Strategy
          • Product Strategy
          • Channel Strategy
  20. Assumptions & Acronyms Used
  21. Research Methodology

List of Tables

  • Table 1: Global Market Value (USD Billion) Forecast by Region, 2020 to 2035
  • Table 2: Global Market Volume (Metric tons) Forecast by Region, 2020 to 2035
  • Table 3: Global Market Value (USD Billion) Forecast by Product Type, 2020 to 2035
  • Table 4: Global Market Volume (Metric tons) Forecast by Product Type, 2020 to 2035
  • Table 5: Global Market Value (USD Billion) Forecast by Application, 2020 to 2035
  • Table 6: Global Market Volume (Metric tons) Forecast by Application, 2020 to 2035
  • Table 7: Global Market Value (USD Billion) Forecast by Sales Channel, 2020 to 2035
  • Table 8: Global Market Volume (Metric tons) Forecast by Sales Channel, 2020 to 2035
  • Table 9: North America Market Value (USD Billion) Forecast by Country, 2020 to 2035
  • Table 10: North America Market Volume (Metric tons) Forecast by Country, 2020 to 2035
  • Table 11: North America Market Value (USD Billion) Forecast by Product Type, 2020 to 2035
  • Table 12: North America Market Volume (Metric tons) Forecast by Product Type, 2020 to 2035
  • Table 13: North America Market Value (USD Billion) Forecast by Application, 2020 to 2035
  • Table 14: North America Market Volume (Metric tons) Forecast by Application, 2020 to 2035
  • Table 15: North America Market Value (USD Billion) Forecast by Sales Channel, 2020 to 2035
  • Table 16: North America Market Volume (Metric tons) Forecast by Sales Channel, 2020 to 2035
  • Table 17: Latin America Market Value (USD Billion) Forecast by Country, 2020 to 2035
  • Table 18: Latin America Market Volume (Metric tons) Forecast by Country, 2020 to 2035
  • Table 19: Latin America Market Value (USD Billion) Forecast by Product Type, 2020 to 2035
  • Table 20: Latin America Market Volume (Metric tons) Forecast by Product Type, 2020 to 2035
  • Table 21: Latin America Market Value (USD Billion) Forecast by Application, 2020 to 2035
  • Table 22: Latin America Market Volume (Metric tons) Forecast by Application, 2020 to 2035
  • Table 23: Latin America Market Value (USD Billion) Forecast by Sales Channel, 2020 to 2035
  • Table 24: Latin America Market Volume (Metric tons) Forecast by Sales Channel, 2020 to 2035
  • Table 25: Western Europe Market Value (USD Billion) Forecast by Country, 2020 to 2035
  • Table 26: Western Europe Market Volume (Metric tons) Forecast by Country, 2020 to 2035
  • Table 27: Western Europe Market Value (USD Billion) Forecast by Product Type, 2020 to 2035
  • Table 28: Western Europe Market Volume (Metric tons) Forecast by Product Type, 2020 to 2035
  • Table 29: Western Europe Market Value (USD Billion) Forecast by Application, 2020 to 2035
  • Table 30: Western Europe Market Volume (Metric tons) Forecast by Application, 2020 to 2035
  • Table 31: Western Europe Market Value (USD Billion) Forecast by Sales Channel, 2020 to 2035
  • Table 32: Western Europe Market Volume (Metric tons) Forecast by Sales Channel, 2020 to 2035
  • Table 33: Eastern Europe Market Value (USD Billion) Forecast by Country, 2020 to 2035
  • Table 34: Eastern Europe Market Volume (Metric tons) Forecast by Country, 2020 to 2035
  • Table 35: Eastern Europe Market Value (USD Billion) Forecast by Product Type, 2020 to 2035
  • Table 36: Eastern Europe Market Volume (Metric tons) Forecast by Product Type, 2020 to 2035
  • Table 37: Eastern Europe Market Value (USD Billion) Forecast by Application, 2020 to 2035
  • Table 38: Eastern Europe Market Volume (Metric tons) Forecast by Application, 2020 to 2035
  • Table 39: Eastern Europe Market Value (USD Billion) Forecast by Sales Channel, 2020 to 2035
  • Table 40: Eastern Europe Market Volume (Metric tons) Forecast by Sales Channel, 2020 to 2035
  • Table 41: East Asia Market Value (USD Billion) Forecast by Country, 2020 to 2035
  • Table 42: East Asia Market Volume (Metric tons) Forecast by Country, 2020 to 2035
  • Table 43: East Asia Market Value (USD Billion) Forecast by Product Type, 2020 to 2035
  • Table 44: East Asia Market Volume (Metric tons) Forecast by Product Type, 2020 to 2035
  • Table 45: East Asia Market Value (USD Billion) Forecast by Application, 2020 to 2035
  • Table 46: East Asia Market Volume (Metric tons) Forecast by Application, 2020 to 2035
  • Table 47: East Asia Market Value (USD Billion) Forecast by Sales Channel, 2020 to 2035
  • Table 48: East Asia Market Volume (Metric tons) Forecast by Sales Channel, 2020 to 2035
  • Table 49: South Asia & Pacific Market Value (USD Billion) Forecast by Country, 2020 to 2035
  • Table 50: South Asia & Pacific Market Volume (Metric tons) Forecast by Country, 2020 to 2035
  • Table 51: South Asia & Pacific Market Value (USD Billion) Forecast by Product Type, 2020 to 2035
  • Table 52: South Asia & Pacific Market Volume (Metric tons) Forecast by Product Type, 2020 to 2035
  • Table 53: South Asia & Pacific Market Value (USD Billion) Forecast by Application, 2020 to 2035
  • Table 54: South Asia & Pacific Market Volume (Metric tons) Forecast by Application, 2020 to 2035
  • Table 55: South Asia & Pacific Market Value (USD Billion) Forecast by Sales Channel, 2020 to 2035
  • Table 56: South Asia & Pacific Market Volume (Metric tons) Forecast by Sales Channel, 2020 to 2035
  • Table 57: Middle East and Africa Market Value (USD Billion) Forecast by Country, 2020 to 2035
  • Table 58: Middle East and Africa Market Volume (Metric tons) Forecast by Country, 2020 to 2035
  • Table 59: Middle East and Africa Market Value (USD Billion) Forecast by Product Type, 2020 to 2035
  • Table 60: Middle East and Africa Market Volume (Metric tons) Forecast by Product Type, 2020 to 2035
  • Table 61: Middle East and Africa Market Value (USD Billion) Forecast by Application, 2020 to 2035
  • Table 62: Middle East and Africa Market Volume (Metric tons) Forecast by Application, 2020 to 2035
  • Table 63: Middle East and Africa Market Value (USD Billion) Forecast by Sales Channel, 2020 to 2035
  • Table 64: Middle East and Africa Market Volume (Metric tons) Forecast by Sales Channel, 2020 to 2035

List of Figures

  • Figure 1: Global Market Volume (Metric tons) Forecast 2020 to 2035
  • Figure 2: Global Market Pricing Analysis
  • Figure 3: Global Market Value (USD Billion) Forecast 2020 to 2035
  • Figure 4: Global Market Value Share and BPS Analysis by Product Type, 2025 and 2035
  • Figure 5: Global Market Y-o-Y Growth Comparison by Product Type, 2025 to 2035
  • Figure 6: Global Market Attractiveness Analysis by Product Type
  • Figure 7: Global Market Value Share and BPS Analysis by Application, 2025 and 2035
  • Figure 8: Global Market Y-o-Y Growth Comparison by Application, 2025 to 2035
  • Figure 9: Global Market Attractiveness Analysis by Application
  • Figure 10: Global Market Value Share and BPS Analysis by Sales Channel, 2025 and 2035
  • Figure 11: Global Market Y-o-Y Growth Comparison by Sales Channel, 2025 to 2035
  • Figure 12: Global Market Attractiveness Analysis by Sales Channel
  • Figure 13: Global Market Value (USD Billion) Share and BPS Analysis by Region, 2025 and 2035
  • Figure 14: Global Market Y-o-Y Growth Comparison by Region, 2025 to 2035
  • Figure 15: Global Market Attractiveness Analysis by Region
  • Figure 16: North America Market Incremental $ Opportunity, 2025 to 2035
  • Figure 17: Latin America Market Incremental $ Opportunity, 2025 to 2035
  • Figure 18: Western Europe Market Incremental $ Opportunity, 2025 to 2035
  • Figure 19: Eastern Europe Market Incremental $ Opportunity, 2025 to 2035
  • Figure 20: East Asia Market Incremental $ Opportunity, 2025 to 2035
  • Figure 21: South Asia & Pacific Market Incremental $ Opportunity, 2025 to 2035
  • Figure 22: Middle East and Africa Market Incremental $ Opportunity, 2025 to 2035
  • Figure 23: North America Market Value Share and BPS Analysis by Country, 2025 and 2035
  • Figure 24: North America Market Value Share and BPS Analysis by Product Type, 2025 and 2035
  • Figure 25: North America Market Y-o-Y Growth Comparison by Product Type, 2025 to 2035
  • Figure 26: North America Market Attractiveness Analysis by Product Type
  • Figure 27: North America Market Value Share and BPS Analysis by Application, 2025 and 2035
  • Figure 28: North America Market Y-o-Y Growth Comparison by Application, 2025 to 2035
  • Figure 29: North America Market Attractiveness Analysis by Application
  • Figure 30: North America Market Value Share and BPS Analysis by Sales Channel, 2025 and 2035
  • Figure 31: North America Market Y-o-Y Growth Comparison by Sales Channel, 2025 to 2035
  • Figure 32: North America Market Attractiveness Analysis by Sales Channel
  • Figure 33: Latin America Market Value Share and BPS Analysis by Country, 2025 and 2035
  • Figure 34: Latin America Market Value Share and BPS Analysis by Product Type, 2025 and 2035
  • Figure 35: Latin America Market Y-o-Y Growth Comparison by Product Type, 2025 to 2035
  • Figure 36: Latin America Market Attractiveness Analysis by Product Type
  • Figure 37: Latin America Market Value Share and BPS Analysis by Application, 2025 and 2035
  • Figure 38: Latin America Market Y-o-Y Growth Comparison by Application, 2025 to 2035
  • Figure 39: Latin America Market Attractiveness Analysis by Application
  • Figure 40: Latin America Market Value Share and BPS Analysis by Sales Channel, 2025 and 2035
  • Figure 41: Latin America Market Y-o-Y Growth Comparison by Sales Channel, 2025 to 2035
  • Figure 42: Latin America Market Attractiveness Analysis by Sales Channel
  • Figure 43: Western Europe Market Value Share and BPS Analysis by Country, 2025 and 2035
  • Figure 44: Western Europe Market Value Share and BPS Analysis by Product Type, 2025 and 2035
  • Figure 45: Western Europe Market Y-o-Y Growth Comparison by Product Type, 2025 to 2035
  • Figure 46: Western Europe Market Attractiveness Analysis by Product Type
  • Figure 47: Western Europe Market Value Share and BPS Analysis by Application, 2025 and 2035
  • Figure 48: Western Europe Market Y-o-Y Growth Comparison by Application, 2025 to 2035
  • Figure 49: Western Europe Market Attractiveness Analysis by Application
  • Figure 50: Western Europe Market Value Share and BPS Analysis by Sales Channel, 2025 and 2035
  • Figure 51: Western Europe Market Y-o-Y Growth Comparison by Sales Channel, 2025 to 2035
  • Figure 52: Western Europe Market Attractiveness Analysis by Sales Channel
  • Figure 53: Eastern Europe Market Value Share and BPS Analysis by Country, 2025 and 2035
  • Figure 54: Eastern Europe Market Value Share and BPS Analysis by Product Type, 2025 and 2035
  • Figure 55: Eastern Europe Market Y-o-Y Growth Comparison by Product Type, 2025 to 2035
  • Figure 56: Eastern Europe Market Attractiveness Analysis by Product Type
  • Figure 57: Eastern Europe Market Value Share and BPS Analysis by Application, 2025 and 2035
  • Figure 58: Eastern Europe Market Y-o-Y Growth Comparison by Application, 2025 to 2035
  • Figure 59: Eastern Europe Market Attractiveness Analysis by Application
  • Figure 60: Eastern Europe Market Value Share and BPS Analysis by Sales Channel, 2025 and 2035
  • Figure 61: Eastern Europe Market Y-o-Y Growth Comparison by Sales Channel, 2025 to 2035
  • Figure 62: Eastern Europe Market Attractiveness Analysis by Sales Channel
  • Figure 63: East Asia Market Value Share and BPS Analysis by Country, 2025 and 2035
  • Figure 64: East Asia Market Value Share and BPS Analysis by Product Type, 2025 and 2035
  • Figure 65: East Asia Market Y-o-Y Growth Comparison by Product Type, 2025 to 2035
  • Figure 66: East Asia Market Attractiveness Analysis by Product Type
  • Figure 67: East Asia Market Value Share and BPS Analysis by Application, 2025 and 2035
  • Figure 68: East Asia Market Y-o-Y Growth Comparison by Application, 2025 to 2035
  • Figure 69: East Asia Market Attractiveness Analysis by Application
  • Figure 70: East Asia Market Value Share and BPS Analysis by Sales Channel, 2025 and 2035
  • Figure 71: East Asia Market Y-o-Y Growth Comparison by Sales Channel, 2025 to 2035
  • Figure 72: East Asia Market Attractiveness Analysis by Sales Channel
  • Figure 73: South Asia & Pacific Market Value Share and BPS Analysis by Country, 2025 and 2035
  • Figure 74: South Asia & Pacific Market Value Share and BPS Analysis by Product Type, 2025 and 2035
  • Figure 75: South Asia & Pacific Market Y-o-Y Growth Comparison by Product Type, 2025 to 2035
  • Figure 76: South Asia & Pacific Market Attractiveness Analysis by Product Type
  • Figure 77: South Asia & Pacific Market Value Share and BPS Analysis by Application, 2025 and 2035
  • Figure 78: South Asia & Pacific Market Y-o-Y Growth Comparison by Application, 2025 to 2035
  • Figure 79: South Asia & Pacific Market Attractiveness Analysis by Application
  • Figure 80: South Asia & Pacific Market Value Share and BPS Analysis by Sales Channel, 2025 and 2035
  • Figure 81: South Asia & Pacific Market Y-o-Y Growth Comparison by Sales Channel, 2025 to 2035
  • Figure 82: South Asia & Pacific Market Attractiveness Analysis by Sales Channel
  • Figure 83: Middle East and Africa Market Value Share and BPS Analysis by Country, 2025 and 2035
  • Figure 84: Middle East and Africa Market Value Share and BPS Analysis by Product Type, 2025 and 2035
  • Figure 85: Middle East and Africa Market Y-o-Y Growth Comparison by Product Type, 2025 to 2035
  • Figure 86: Middle East and Africa Market Attractiveness Analysis by Product Type
  • Figure 87: Middle East and Africa Market Value Share and BPS Analysis by Application, 2025 and 2035
  • Figure 88: Middle East and Africa Market Y-o-Y Growth Comparison by Application, 2025 to 2035
  • Figure 89: Middle East and Africa Market Attractiveness Analysis by Application
  • Figure 90: Middle East and Africa Market Value Share and BPS Analysis by Sales Channel, 2025 and 2035
  • Figure 91: Middle East and Africa Market Y-o-Y Growth Comparison by Sales Channel, 2025 to 2035
  • Figure 92: Middle East and Africa Market Attractiveness Analysis by Sales Channel
  • Figure 93: Global Market - Tier Structure Analysis
  • Figure 94: Global Market - Company Share Analysis

Frequently Asked Questions

What is the projected size of the global aircraft textile market by 2035?

The market is expected to reach USD 3.1 billion by 2035.

What is the estimated market size of the global aircraft textile market in 2025?

The market size is projected to be USD 2.3 billion in 2025.

What is the CAGR of the aircraft textile market from 2025 to 2035?

The market is expected to grow at a CAGR of 3.1% from 2025 to 2035.

Which product type segment leads the aircraft textile market in 2025?

Woven fabrics are expected to lead the product type segment with a 58% market share in 2025.

Which country is expected to record the highest CAGR in the aircraft textile market from 2025 to 2035?

China is anticipated to grow at the highest CAGR of 5.0% from 2025 to 2035.

Explore Similar Insights

Future Market Insights

Aircraft Textile Market