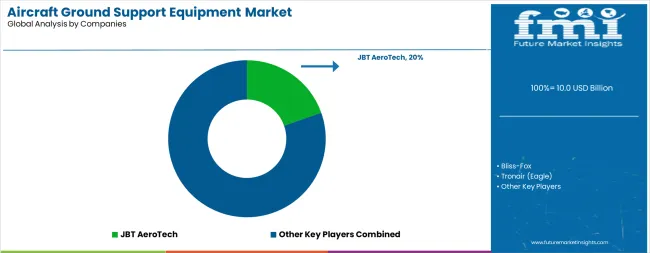
Aircraft Ground Support Equipment Market Forecast and Outlook (2025-2035)

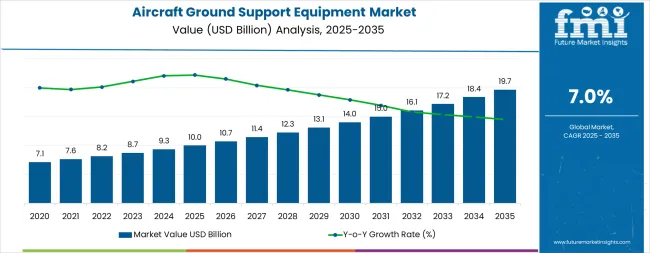
The global aircraft ground support equipment market is projected to grow from USD 10.0 billion in 2025 to approximately USD 19.7 billion by 2035, recording an absolute increase of USD 9.7 billion over the forecast period. This translates into a total growth of 97.0%, with the market forecast to expand at a compound annual growth rate (CAGR) of 7.0% between 2025 and 2035. The overall market size is expected to grow by nearly 1.97X during the same period, supported by rising global air traffic, airport infrastructure modernization, increasing adoption of electric and hybrid GSE solutions, and growing emphasis on operational efficiency and sustainability in aviation ground operations.

Quick Stats for Aircraft Ground Support Equipment Market

  • Aircraft GSE Market Value (2025): USD 10.0 billion
  • Aircraft GSE Market Forecast Value (2035): USD 19.7 billion
  • Aircraft GSE Market Forecast CAGR: 7.0%
  • Leading Segment by Application in GSE Market (2025): Commercial Aviation (85% market share)
  • Key Growth Regions in GSE Market: North America, Europe, Asia Pacific
  • Key Players in GSE Market: Bliss-Fox, Tronair (Eagle), Mallaghan, Cavotec SA, Weihai Guangtai Airport Equipment Co., Ltd., TLD Group, China International Marine Containers (CIMC)

Aircraft Ground Support Equipment Market

Metric Value
Estimated Size (2025E) USD 10.0 billion
Projected Value (2035F) USD 19.7 billion
CAGR (2025 to 2035) 7.0%

Between 2025 and 2030, the aircraft ground support equipment market is projected to expand from USD 10.0 billion to USD 14.4 billion, resulting in a value increase of USD 4.4 billion, which represents 45.4% of the total forecast growth for the decade. This phase of growth will be shaped by rising global air traffic volumes, airport infrastructure modernization projects, and increasing adoption of electric and hybrid GSE solutions. Equipment manufacturers are expanding their production capabilities to address the growing complexity of modern airport operations and sustainability requirements.

From 2030 to 2035, the market is forecast to grow from USD 14.4 billion to USD 19.7 billion, adding another USD 5.3 billion, which constitutes 54.6% of the overall ten-year expansion. This period is expected to be characterized by widespread adoption of electric and automated GSE systems, integration of advanced digital fleet management solutions, and development of autonomous ground handling technologies across major airports. The growing implementation of carbon neutrality programs in aviation will drive demand for sophisticated electric GSE equipment and specialized sustainability compliance systems.

Between 2020 and 2025, the aircraft ground support equipment market experienced steady expansion, driven by recovering air travel demand and increasing focus on operational efficiency following the aviation industry recovery. The market developed as airports and airlines recognized the need for modernized equipment and training to properly handle growing passenger volumes and cargo operations. Aviation authorities and airport operators began emphasizing proper equipment utilization procedures to maintain safety standards and operational efficiency compliance.

Why is the Aircraft Ground Support Equipment Market Growing?

Market expansion is being supported by the rapid increase in global air traffic volumes worldwide and the corresponding need for efficient ground handling equipment following aircraft operations. Modern airport facilities rely on precise equipment functionality and coordination to ensure proper operation of ground services including passenger boarding, baggage handling, and aircraft maintenance. Even minor operational delays or equipment failures can require comprehensive ground handling system coordination to maintain optimal airport performance and flight schedule compliance.

The growing complexity of airport operations and increasing safety requirements are driving demand for advanced GSE solutions from certified manufacturers with appropriate equipment specifications and operational expertise. Airport authorities are increasingly requiring proper equipment certification documentation following ground handling activities to maintain operational standards and ensure safety compliance. Regulatory requirements and aviation authority specifications are establishing standardized equipment procedures that require specialized systems and trained operators from qualified suppliers.

Segmental Analysis

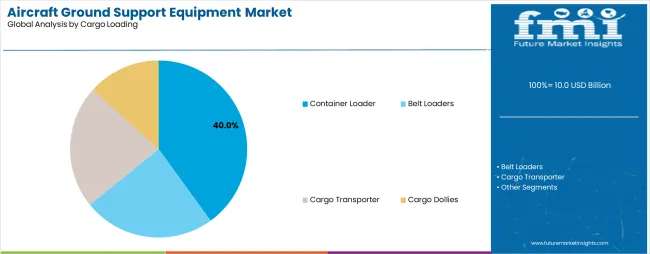
The market is segmented by equipment type, power, application, ownership, and region. By equipment type, the market is divided into passenger services (boarding steps & stairs, airport buses & transport, bed/chair lifts), cargo loading (container loader, belt loaders, cargo transporter, cargo dollies), and airport service (refuelers, tractors, towbarless pushback, ground power units, air start units, lavatory service vehicles, de/anti-icing vehicles, rescue & firefighting equipment, others). Based on power, the market is categorized into non-electric, electric, and hybrid equipment. In terms of application, the market is bifurcated into commercial and defense. By ownership, the market is divided into owned GSE, leased GSE, and rental GSE. Regionally, the market is classified into North America, Europe, Asia Pacific, Latin America, and Middle East & Africa.
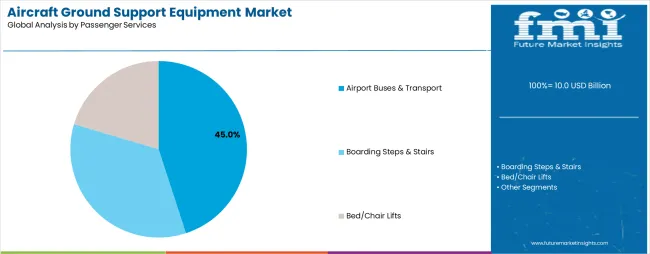
By Power Type, Non-Electric Equipment Segment Accounts for 62% Market Share

Aircraft Ground Support Equipment Market By Type

Non-electric equipment is projected to account for 62% of the aircraft ground support equipment market in 2025. This leading share is supported by the widespread adoption of conventional fuel-powered systems for ground handling operations, which represent the majority of current GSE technologies. Non-electric equipment provides proven reliability using established fuel infrastructure and maintenance systems, making it the preferred power source for most passenger services, cargo handling, and airport maintenance applications. The segment benefits from established operational procedures and comprehensive equipment availability from multiple suppliers.

By Application, Commercial Aviation Segment Accounts for 85% Market Share

Aircraft Ground Support Equipment Market By Application1

Commercial aviation is expected to represent 85% of aircraft ground support equipment demand in 2025. This dominant share reflects the large scale of commercial airport operations and the extensive population of commercial aircraft requiring comprehensive ground handling services. Modern commercial aviation increasingly features multiple GSE requirements that need coordinated equipment integration following passenger processing, baggage handling, and aircraft servicing activities. The segment benefits from growing air travel demand and increasing regulatory requirements for proper ground handling equipment utilization in commercial operations.

What are the Drivers, Restraints, and Key Trends of the Aircraft Ground Support Equipment Market?

The aircraft ground support equipment market is advancing steadily due to increasing air traffic volumes and growing recognition of operational efficiency importance. However, the market faces challenges including high equipment costs, need for specialized maintenance infrastructure, and varying operational requirements across different airport environments. Technology advancement programs and certification initiatives continue to influence equipment quality and market development patterns.

Electrification and Automation Drive GSE Innovation

The growing deployment of electrification and automation technologies is enabling enhanced operational capabilities at commercial airports, cargo handling facilities, and maintenance operations centers. Electric and automated GSE equipped with advanced control systems provide superior operational efficiency and reduced emissions for airports while expanding ground handling capabilities. These technologies are particularly valuable for major airport operators and high-volume facilities that require advanced ground handling services without operational delays.

High Capital Costs and Infrastructure Requirements Limit Adoption

Modern GSE manufacturers are incorporating advanced electric powertrains and automated control systems that increase equipment costs compared to conventional alternatives. Implementation of specialized charging infrastructure and maintenance systems enables superior operational performance but requires higher capital investment and facility modifications. Advanced equipment supports operation of next-generation GSE applications including electric aircraft tugs and automated baggage handling systems while maintaining cost competitiveness challenges.

Analysis of Aircraft Ground Support Equipment Market by Key Country

Country Wise Aircraft Ground Support Equipment Market

Country CAGR (2025-2035)
USA 7.2%
China 7.1%
Germany 6.2%
UK 5.8%
France 5.6%
Brazil 5.0%
India 4.5%

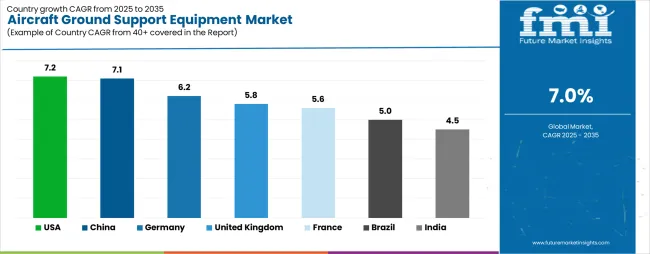
The aircraft ground support equipment market is growing steadily, with the USA leading at a 7.2% CAGR through 2035, driven by extensive airport modernization programs and sustainability mandates. China follows closely at 7.1%, supported by rapid aviation expansion and infrastructure development. Germany shows solid growth at 6.2%, benefiting from advanced manufacturing capabilities and environmental regulations. The UK, France, and Brazil demonstrate consistent moderate growth at 5.8%, 5.6%, and 5.0% respectively, supported by airport expansion and fleet modernization programs. India experiences steady expansion at 4.5%, driven by growing domestic aviation demand but constrained by price sensitivity, reflecting regional differences in GSE adoption patterns. The report covers an in-depth analysis of 40+ countries; seven top-performing OECD countries are highlighted below.

Market Expansion in the Aircraft Ground Support Equipment Market in the United States

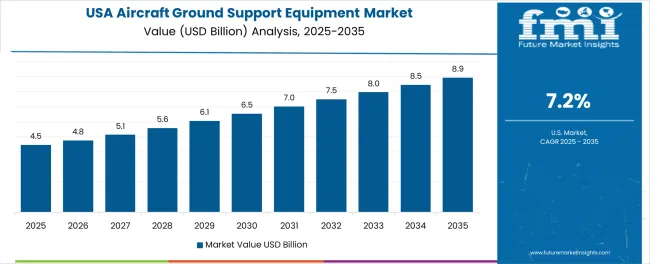
Revenue from aircraft ground support equipment in the USA is projected to grow at a CAGR of 7.2% from 2025 to 2035, exceeding the global average. Airport infrastructure investments, sustainability initiatives, and advanced GSE adoption across major hubs fuel growth throughout the country. American airports are increasingly embracing electric and automated GSE as regulatory pressures intensify and operational costs drive efficiency requirements. Advanced reimbursement frameworks and technology innovation support market penetration across established aviation networks and emerging regional airports seeking operational modernization.

  • High deployment of electric and automated GSE fleets across major commercial airports nationwide
  • Strong investment in modernization of airport infrastructure supporting comprehensive equipment upgrade programs

Growth Leadership in the Aircraft Ground Support Equipment Market in China

Revenue from aircraft ground support equipment in China is anticipated to expand at a CAGR of 7.1% from 2025 to 2035, closely matching the USA rate. Growth is centered on massive airport construction projects and fleet expansion across major metropolitan regions including Beijing, Shanghai, and Guangzhou. Advanced automation technologies and electric GSE are being deployed for new airport operations and existing facility upgrades. Government aviation development policies support comprehensive GSE modernization across domestic and international airports throughout established metropolitan areas and emerging regional hubs.

  • Major airport expansion projects fueling large-scale GSE demand across multiple metropolitan regions
  • Government policy promoting hybrid and electric fleets supporting systematic technology adoption initiatives

Market Development in the Aircraft Ground Support Equipment Market in Germany

Sales of aircraft ground support equipment in Germany are slated to grow at a CAGR of 6.2% from 2025 to 2035, exceeding the European average. Growth has been concentrated in sustainability-focused modernization and technology integration across major airports including Frankfurt, Munich, and Berlin. GSE adoption is shifting toward electric and automated systems driven by environmental regulations and operational efficiency requirements. Advanced manufacturing capabilities and technology partnerships support comprehensive deployment strategies throughout established aviation networks and emerging sustainability programs.
  • Rising adoption of electric and hybrid GSE fleets driven by environmental regulations
  • Strong collaboration between airports and equipment manufacturers enhancing technology integration capabilities

Growth Assessment for Aircraft Ground Support Equipment Market in the United Kingdom

Revenue from aircraft ground support equipment in the UK is expected to increase at a CAGR of 5.8% from 2025 to 2035, performing moderately below the global average. Airport expansion projects and sustainability commitments drive demand at major airports including Heathrow, Gatwick, and Manchester. Post-Brexit operational optimization and carbon reduction mandates are increasingly driving GSE modernization and adoption of electric equipment. However, budget constraints and regulatory adjustments restrict broader market penetration despite strong operational requirements and environmental consciousness among airport operators.

  • Increased adoption of eco-friendly and automated equipment across major commercial airports
  • Post-Brexit operational pressures influencing procurement decisions and modernization investment priorities

France Aircraft Ground Support Equipment Market Analysis by Equipment Segments

Revenue from aircraft ground support equipment in France is projected to rise at a CAGR of 5.6% from 2025 to 2035, supported by strong demand for sustainable ground handling solutions and automated systems. Major airports including Charles de Gaulle, Orly, and Lyon are experiencing modernization programs focused on electrification, operational efficiency, and passenger experience enhancement. French aviation companies are leveraging advanced GSE technologies to meet environmental targets and operational excellence standards throughout established airport networks and emerging sustainability compliance programs.

  • Passenger service equipment driving major share of adoption across commercial aviation applications
  • Regulatory compliance influencing investment in premium GSE supporting comprehensive operational modernization

Brazil Aircraft Ground Support Equipment Market Expansion Analysis

Demand for aircraft ground support equipment in Brazil is expected to grow at a CAGR of 5.0% from 2025 to 2035, matching regional Latin American trends. Growth is driven by airport infrastructure development and commercial aviation expansion in major metropolitan regions including São Paulo, Rio de Janeiro, and Brasília. Domestic airlines and airport operators are modernizing ground handling capabilities while international airports upgrade equipment to meet global operational standards. Regional manufacturing partnerships and technology transfer programs support comprehensive market development throughout established aviation hubs and emerging regional facilities.

  • Airport modernization projects driving demand in major metropolitan hubs across the country
  • Budget and adoption gaps in smaller airports restraining comprehensive expansion despite growth opportunities

India Aircraft Ground Support Equipment Market Development Prospects

Demand for aircraft ground support equipment in India is projected to expand at a CAGR of 4.5% from 2025 to 2035, below the global average due to cost sensitivity and infrastructure constraints. Growth is concentrated in metropolitan airport hubs including Mumbai, Delhi, and Bangalore, where aviation traffic and infrastructure investments are rising rapidly. Limited domestic manufacturing capabilities and high import costs restrict broader market penetration, while government aviation initiatives gradually build market opportunities. However, price sensitivity and infrastructure limitations constrain systematic equipment modernization across regional airports and emerging aviation markets.

  • Dependence on imports restricting cost-effective adoption across regional and emerging airports
  • Aviation initiatives supporting gradual modernization concentrated in major metropolitan airport hubs

Europe Market Split by Country

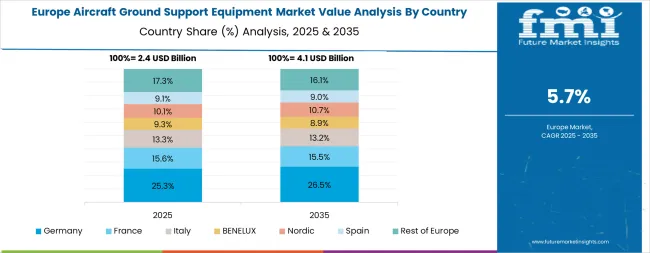
Aircraft Ground Support Equipment Market Europe The aircraft ground support equipment market in Europe is projected to expand from USD 2.1 billion in 2025 to USD 3.8 billion by 2035, reflecting a CAGR of 6.1% over the forecast period. Germany will continue to lead the regional market, accounting for 26.8% in 2025 and increasing slightly to 27.2% by 2035, supported by advanced infrastructure and major hubs such as Frankfurt and Munich. France follows with an 18.9% share in 2025, though its share is expected to ease to 18.1% by 2035 due to below-average growth despite significant modernization programs at Charles de Gaulle and Orly.

The United Kingdom holds 17.3% in 2025, projected to decline modestly to 16.9% by 2035 as post-Brexit operational adjustments weigh on growth. Italy maintains a steady position with 14.2% in 2025, edging up to 14.3% by 2035, while Spain remains broadly stable at 11.6% in 2025 and 11.7% in 2035, supported by demand at Madrid and Barcelona airports. The Rest of Europe is expected to strengthen from 11.2% in 2025 to 11.9% by 2035, driven by increasing GSE adoption in Nordic countries and modernization efforts across Eastern European airports.

Competitive Landscape of Aircraft Ground Support Equipment Market

Aircraft Ground Support Equipment EuropeThe aircraft ground support equipment market is moderately consolidated, featuring a mix of global manufacturers, specialized technology providers, and regional players with distinct strengths in product innovation, market presence, and operational capabilities. Companies are prioritizing investments in electrification, hybrid power systems, automation technologies, and digitalized fleet management platforms to deliver efficient, reliable, and environmentally compliant equipment. Strategic collaborations, sustainable innovation, and geographic diversification remain central to enhancing competitiveness and expanding customer bases.

Bliss-Fox focuses on aircraft pushback tractors and towing vehicles, known for reliability, robust design, and application-specific engineering that caters to both international and regional airport operators. Tronair (Eagle), U.S.-based, provides comprehensive ground support equipment portfolios, including towing, lifting, and power systems, with strong emphasis on innovation, customization, and aftermarket support. Mallaghan, headquartered in Northern Ireland, delivers a wide range of passenger steps, catering trucks, and specialized GSE vehicles, differentiating through cost-effective manufacturing, regional adaptability, and application-specific solutions.

Cavotec SA, Switzerland-based, is recognized for innovative power and charging systems, in-ground utility pits, and advanced electrification solutions, catering to airports prioritizing sustainability, reduced emissions, and operational efficiency. Weihai Guangtai Airport Equipment Co., Ltd., China-based, is a leading Asian supplier, offering diverse GSE solutions including passenger boarding equipment, refueling trucks, and catering vehicles, with focus on regional dominance, affordability, and large-scale production capabilities.

TLD Group, with global operations, provides comprehensive aircraft ground support equipment including loaders, tractors, and air-conditioning units, backed by global service networks, high-quality manufacturing, and emphasis on fleet sustainability through electric and hybrid platforms. China International Marine Containers (CIMC), a major Chinese industrial group, leverages its manufacturing scale and diversified product portfolio to supply cargo loaders, passenger boarding bridges, and specialized airport vehicles, strengthening its competitive position through cost leadership, regional expansion, and integration with aviation infrastructure solutions.

Key Players in the Aircraft Ground Support Equipment Market

  • Bliss-Fox
  • Tronair (Eagle)
  • Mallaghan
  • Cavotec SA
  • Weihai Guangtai Airport Equipment Co., Ltd.
  • TLD Group
  • China International Marine Containers (CIMC)

Scope of the Report

Items Values
Quantitative Units (2025) USD 10.0 Billion
Equipment Type Passenger Services (Boarding Steps & Stairs, Airport Buses & Transport, Bed/Chair Lifts), Cargo Loading (Container Loader, Belt Loaders, Cargo Transporter, Cargo Dollies), Airport Service (Refuelers, Tractors, Towbarless Pushback, Ground Power Units, Air Start Units, Lavatory Service Vehicles, De/Anti-Icing Vehicles, Rescue & Firefighting Equipment, Others)
Power Non-Electric, Electric, Hybrid
Application Commercial, Defense
Ownership Owned GSE, Leased GSE, Rental GSE
Regions Covered North America, Europe, Asia Pacific, Latin America, Middle East & Africa
Country Covered United States, Canada, Germany, United Kingdom, France, China, Japan, Brazil, India
Key Companies Profiled Bliss-Fox, Tronair (Eagle), Mallaghan, Cavotec SA, Weihai Guangtai Airport Equipment Co., Ltd., TLD Group, China International Marine Containers (CIMC)
Additional Attributes Dollar sales span equipment types, power sources, applications, and ownership, with regional demand, competition, operator electric shift, sustainability integration, automation, and adoption of smart, safe, predictive aviation GSE solutions

Aircraft Ground Support Equipment Market by Segments

By Equipment Type:

  • Passenger Services

    • Boarding Steps & Stairs
    • Airport Buses & Transport
    • Bed/Chair Lifts
  • Cargo Loading
    • Container Loader
    • Belt Loaders
    • Cargo Transporter
    • Cargo Dollies
  • Airport Service
    • Refuelers
    • Tractors
    • Towbarless Pushback
    • Ground Power Units
    • Air Start Units
    • Lavatory Service Vehicles
    • De/Anti-Icing Vehicles
    • Rescue & Firefighting Equipment
    • Others

By Power:

  • Non-Electric
  • Electric
  • Hybrid

By Application:

  • Commercial
  • Defense

By Ownership:

  • Owned GSE
  • Leased GSE
  • Rental GSE

By Region:

  • North America
    • United States
    • Canada
    • Mexico
  • Europe
    • Germany
    • United Kingdom
    • France
    • Italy
    • Spain
    • Nordic
    • BENELUX
    • Rest of Europe
  • Asia Pacific
    • China
    • Japan
    • India
    • South Korea
    • ASEAN
    • Australia & New Zealand
    • Rest of Asia Pacific
  • Latin America
    • Brazil
    • Chile
    • Rest of Latin America
  • Middle East & Africa
    • Kingdom of Saudi Arabia
    • Other GCC Countries
    • Turkey
    • South Africa
    • Other African Union
    • Rest of Middle East & Africa

Table of Content

  1. Executive Summary
    • Global Market Outlook
    • Demand-side Trends
    • Supply-side Trends
    • Technology Roadmap Analysis
    • Analysis and Recommendations
  2. Market Overview
    • Market Coverage / Taxonomy
    • Market Definition / Scope / Limitations
  3. Market Background
    • Market Dynamics
      • Drivers
      • Restraints
      • Opportunity
      • Trends
    • Scenario Forecast
      • Demand in Optimistic Scenario
      • Demand in Likely Scenario
      • Demand in Conservative Scenario
    • Opportunity Map Analysis
    • Product Life Cycle Analysis
    • Supply Chain Analysis
      • Supply Side Participants and their Roles
        • Producers
        • Mid-Level Participants (Traders/ Agents/ Brokers)
        • Wholesalers and Distributors
      • Value Added and Value Created at Node in the Supply Chain
      • List of Raw Material Suppliers
      • List of Existing and Potential Buyer’s
    • Investment Feasibility Matrix
    • Value Chain Analysis
      • Profit Margin Analysis
      • Wholesalers and Distributors
      • Retailers
    • PESTLE and Porter’s Analysis
    • Regulatory Landscape
      • By Key Regions
      • By Key Countries
    • Regional Parent Market Outlook
    • Production and Consumption Statistics
    • Import and Export Statistics
  4. Global Market Analysis 2020 to 2024 and Forecast, 2025 to 2035
    • Historical Market Size Value (USD Billion) & Volume (Kilotons) Analysis, 2020 to 2024
    • Current and Future Market Size Value (USD Billion) & Volume (Kilotons) Projections, 2025 to 2035
      • Y-o-Y Growth Trend Analysis
      • Absolute $ Opportunity Analysis
  5. Global Market Pricing Analysis 2020 to 2024 and Forecast 2025 to 2035
  6. Global Market Analysis 2020 to 2024 and Forecast 2025 to 2035, By Equipment Type
    • Introduction / Key Findings
    • Historical Market Size Value (USD Billion) & Volume (Kilotons) Analysis By Equipment Type, 2020 to 2024
    • Current and Future Market Size Value (USD Billion) & Volume (Kilotons) Analysis and Forecast By Equipment Type, 2025 to 2035
      • Passenger Services
        • Boarding Steps & Stairs
        • Airport Buses & Transport
        • Bed/Chair Lifts
      • Airport Services
        • Refuelers
        • Tractors
        • Towbarless Pushback
        • Ground Power Value & Volume
        • Air Start Value & Volume
        • Lavatory Service Vehicle
        • De/anti-icing Vehicle
        • Rescue & Firefighting
        • Others
      • Cargo Loading
        • Container Loader
        • Belt Loaders
        • Cargo Transporter
        • Cargo Dollies
    • Y-o-Y Growth Trend Analysis By Equipment Type, 2020 to 2024
    • Absolute $ Opportunity Analysis By Equipment Type, 2025 to 2035
  7. Global Market Analysis 2020 to 2024 and Forecast 2025 to 2035, By Power
    • Introduction / Key Findings
    • Historical Market Size Value (USD Billion) & Volume (Kilotons) Analysis By Power, 2020 to 2024
    • Current and Future Market Size Value (USD Billion) & Volume (Kilotons) Analysis and Forecast By Power, 2025 to 2035
      • Non-Electric
      • Electric
      • Hybrid
    • Y-o-Y Growth Trend Analysis By Power, 2020 to 2024
    • Absolute $ Opportunity Analysis By Power, 2025 to 2035
  8. Global Market Analysis 2020 to 2024 and Forecast 2025 to 2035, By Application
    • Introduction / Key Findings
    • Historical Market Size Value (USD Billion) & Volume (Kilotons) Analysis By Application, 2020 to 2024
    • Current and Future Market Size Value (USD Billion) & Volume (Kilotons) Analysis and Forecast By Application, 2025 to 2035
      • Commercial
      • Defense
    • Y-o-Y Growth Trend Analysis By Application, 2020 to 2024
    • Absolute $ Opportunity Analysis By Application, 2025 to 2035
  9. Global Market Analysis 2020 to 2024 and Forecast 2025 to 2035, By Ownership
    • Introduction / Key Findings
    • Historical Market Size Value (USD Billion) & Volume (Kilotons) Analysis By Ownership, 2020 to 2024
    • Current and Future Market Size Value (USD Billion) & Volume (Kilotons) Analysis and Forecast By Ownership, 2025 to 2035
      • Owned GSE
      • Leased GSE
      • Rental GSE
    • Y-o-Y Growth Trend Analysis By Ownership, 2020 to 2024
    • Absolute $ Opportunity Analysis By Ownership, 2025 to 2035
  10. Global Market Analysis 2020 to 2024 and Forecast 2025 to 2035, By Region
    • Introduction
    • Historical Market Size Value (USD Billion) & Volume (Kilotons) Analysis By Region, 2020 to 2024
    • Current Market Size Value (USD Billion) & Volume (Kilotons) Analysis and Forecast By Region, 2025 to 2035
      • North America
      • Latin America
      • Western Europe
      • Eastern Europe
      • East Asia
      • South Asia & Pacific
      • Middle East and Africa
    • Market Attractiveness Analysis By Region
  11. North America Market Analysis 2020 to 2024 and Forecast 2025 to 2035, By Country
    • Historical Market Size Value (USD Billion) & Volume (Kilotons) Trend Analysis By Market Taxonomy, 2020 to 2024
    • Market Size Value (USD Billion) & Volume (Kilotons) Forecast By Market Taxonomy, 2025 to 2035
      • By Country
        • USA
        • Canada
        • Mexico
      • By Equipment Type
      • By Power
      • By Application
      • By Ownership
    • Market Attractiveness Analysis
      • By Country
      • By Equipment Type
      • By Power
      • By Application
      • By Ownership
    • Key Takeaways
  12. Latin America Market Analysis 2020 to 2024 and Forecast 2025 to 2035, By Country
    • Historical Market Size Value (USD Billion) & Volume (Kilotons) Trend Analysis By Market Taxonomy, 2020 to 2024
    • Market Size Value (USD Billion) & Volume (Kilotons) Forecast By Market Taxonomy, 2025 to 2035
      • By Country
        • Brazil
        • Argentina
        • Rest of LATAM
      • By Equipment Type
      • By Power
      • By Application
      • By Ownership
    • Market Attractiveness Analysis
      • By Country
      • By Equipment Type
      • By Power
      • By Application
      • By Ownership
    • Key Takeaways
  13. Western Europe Market Analysis 2020 to 2024 and Forecast 2025 to 2035, By Country
    • Historical Market Size Value (USD Billion) & Volume (Kilotons) Trend Analysis By Market Taxonomy, 2020 to 2024
    • Market Size Value (USD Billion) & Volume (Kilotons) Forecast By Market Taxonomy, 2025 to 2035
      • By Country
        • Germany
        • Italy
        • France
        • UK
        • Spain
        • BENELUX
        • Nordic
        • Rest of W.Europe
      • By Equipment Type
      • By Power
      • By Application
      • By Ownership
    • Market Attractiveness Analysis
      • By Country
      • By Equipment Type
      • By Power
      • By Application
      • By Ownership
    • Key Takeaways
  14. Eastern Europe Market Analysis 2020 to 2024 and Forecast 2025 to 2035, By Country
    • Historical Market Size Value (USD Billion) & Volume (Kilotons) Trend Analysis By Market Taxonomy, 2020 to 2024
    • Market Size Value (USD Billion) & Volume (Kilotons) Forecast By Market Taxonomy, 2025 to 2035
      • By Country
        • Russia
        • Hungary
        • Poland
        • Balkan & Baltics
        • Rest of E. Europe
      • By Equipment Type
      • By Power
      • By Application
      • By Ownership
    • Market Attractiveness Analysis
      • By Country
      • By Equipment Type
      • By Power
      • By Application
      • By Ownership
    • Key Takeaways
  15. East Asia Market Analysis 2020 to 2024 and Forecast 2025 to 2035, By Country
    • Historical Market Size Value (USD Billion) & Volume (Kilotons) Trend Analysis By Market Taxonomy, 2020 to 2024
    • Market Size Value (USD Billion) & Volume (Kilotons) Forecast By Market Taxonomy, 2025 to 2035
      • By Country
        • China
        • Japan
        • South Korea
      • By Equipment Type
      • By Power
      • By Application
      • By Ownership
    • Market Attractiveness Analysis
      • By Country
      • By Equipment Type
      • By Power
      • By Application
      • By Ownership
    • Key Takeaways
  16. South Asia & Pacific Market Analysis 2020 to 2024 and Forecast 2025 to 2035, By Country
    • Historical Market Size Value (USD Billion) & Volume (Kilotons) Trend Analysis By Market Taxonomy, 2020 to 2024
    • Market Size Value (USD Billion) & Volume (Kilotons) Forecast By Market Taxonomy, 2025 to 2035
      • By Country
        • India
        • Australia & New Zealand
        • ASEAN
        • Rest of SAP
      • By Equipment Type
      • By Power
      • By Application
      • By Ownership
    • Market Attractiveness Analysis
      • By Country
      • By Equipment Type
      • By Power
      • By Application
      • By Ownership
    • Key Takeaways
  17. Middle East and Africa Market Analysis 2020 to 2024 and Forecast 2025 to 2035, By Country
    • Historical Market Size Value (USD Billion) & Volume (Kilotons) Trend Analysis By Market Taxonomy, 2020 to 2024
    • Market Size Value (USD Billion) & Volume (Kilotons) Forecast By Market Taxonomy, 2025 to 2035
      • By Country
        • GCC Countries
        • Northern Africa
        • South Africa
        • Turkiye
        • Rest of MEA
      • By Equipment Type
      • By Power
      • By Application
      • By Ownership
    • Market Attractiveness Analysis
      • By Country
      • By Equipment Type
      • By Power
      • By Application
      • By Ownership
    • Key Takeaways
  18. Key Countries Market Analysis
    • USA
      • Pricing Analysis
      • Market Share Analysis, 2024
        • By Equipment Type
        • By Power
        • By Application
        • By Ownership
    • Canada
      • Pricing Analysis
      • Market Share Analysis, 2024
        • By Equipment Type
        • By Power
        • By Application
        • By Ownership
    • Brazil
      • Pricing Analysis
      • Market Share Analysis, 2024
        • By Equipment Type
        • By Power
        • By Application
        • By Ownership
    • Mexico
      • Pricing Analysis
      • Market Share Analysis, 2024
        • By Equipment Type
        • By Power
        • By Application
        • By Ownership
    • Argentina
      • Pricing Analysis
      • Market Share Analysis, 2024
        • By Equipment Type
        • By Power
        • By Application
        • By Ownership
  19. Market Structure Analysis
    • Competition Dashboard
    • Competition Benchmarking
    • Market Share Analysis of Top Players
      • By Regional
      • By Equipment Type
      • By Power
      • By Application
      • By Ownership
  20. Competition Analysis
    • Competition Deep Dive
      • JBT AeroTech
        • Overview
        • Product Portfolio
        • Profitability by Market Segments (Product/Age /Sales Channel/Region)
        • Sales Footprint
        • Strategy Overview
          • Marketing Strategy
          • Product Strategy
          • Channel Strategy
      • Textron GSE
        • Overview
        • Product Portfolio
        • Profitability by Market Segments (Product/Age /Sales Channel/Region)
        • Sales Footprint
        • Strategy Overview
          • Marketing Strategy
          • Product Strategy
          • Channel Strategy
      • Charlatte Manutention
        • Overview
        • Product Portfolio
        • Profitability by Market Segments (Product/Age /Sales Channel/Region)
        • Sales Footprint
        • Strategy Overview
          • Marketing Strategy
          • Product Strategy
          • Channel Strategy
      • Tronair (Eagle brand only)
        • Overview
        • Product Portfolio
        • Profitability by Market Segments (Product/Age /Sales Channel/Region)
        • Sales Footprint
        • Strategy Overview
          • Marketing Strategy
          • Product Strategy
          • Channel Strategy
      • Kalmar Motor AB
        • Overview
        • Product Portfolio
        • Profitability by Market Segments (Product/Age /Sales Channel/Region)
        • Sales Footprint
        • Strategy Overview
          • Marketing Strategy
          • Product Strategy
          • Channel Strategy
      • Mulag
        • Overview
        • Product Portfolio
        • Profitability by Market Segments (Product/Age /Sales Channel/Region)
        • Sales Footprint
        • Strategy Overview
          • Marketing Strategy
          • Product Strategy
          • Channel Strategy
      • Weihai Guangtai Airport Equipment Co. Ltd
        • Overview
        • Product Portfolio
        • Profitability by Market Segments (Product/Age /Sales Channel/Region)
        • Sales Footprint
        • Strategy Overview
          • Marketing Strategy
          • Product Strategy
          • Channel Strategy
      • Mallaghan
        • Overview
        • Product Portfolio
        • Profitability by Market Segments (Product/Age /Sales Channel/Region)
        • Sales Footprint
        • Strategy Overview
          • Marketing Strategy
          • Product Strategy
          • Channel Strategy
      • China International Marine Containers (Group) Co., Ltd.
        • Overview
        • Product Portfolio
        • Profitability by Market Segments (Product/Age /Sales Channel/Region)
        • Sales Footprint
        • Strategy Overview
          • Marketing Strategy
          • Product Strategy
          • Channel Strategy
      • Cavotec SA
        • Overview
        • Product Portfolio
        • Profitability by Market Segments (Product/Age /Sales Channel/Region)
        • Sales Footprint
        • Strategy Overview
          • Marketing Strategy
          • Product Strategy
          • Channel Strategy
      • TLD
        • Overview
        • Product Portfolio
        • Profitability by Market Segments (Product/Age /Sales Channel/Region)
        • Sales Footprint
        • Strategy Overview
          • Marketing Strategy
          • Product Strategy
          • Channel Strategy
      • Goldhofer
        • Overview
        • Product Portfolio
        • Profitability by Market Segments (Product/Age /Sales Channel/Region)
        • Sales Footprint
        • Strategy Overview
          • Marketing Strategy
          • Product Strategy
          • Channel Strategy
      • Tiger
        • Overview
        • Product Portfolio
        • Profitability by Market Segments (Product/Age /Sales Channel/Region)
        • Sales Footprint
        • Strategy Overview
          • Marketing Strategy
          • Product Strategy
          • Channel Strategy
      • Trepel Airport Equipment
        • Overview
        • Product Portfolio
        • Profitability by Market Segments (Product/Age /Sales Channel/Region)
        • Sales Footprint
        • Strategy Overview
          • Marketing Strategy
          • Product Strategy
          • Channel Strategy
      • Vestergaard Company
        • Overview
        • Product Portfolio
        • Profitability by Market Segments (Product/Age /Sales Channel/Region)
        • Sales Footprint
        • Strategy Overview
          • Marketing Strategy
          • Product Strategy
          • Channel Strategy
      • Global Ground Support
        • Overview
        • Product Portfolio
        • Profitability by Market Segments (Product/Age /Sales Channel/Region)
        • Sales Footprint
        • Strategy Overview
          • Marketing Strategy
          • Product Strategy
          • Channel Strategy
      • Wollard International
        • Overview
        • Product Portfolio
        • Profitability by Market Segments (Product/Age /Sales Channel/Region)
        • Sales Footprint
        • Strategy Overview
          • Marketing Strategy
          • Product Strategy
          • Channel Strategy
      • Bliss-Fox
        • Overview
        • Product Portfolio
        • Profitability by Market Segments (Product/Age /Sales Channel/Region)
        • Sales Footprint
        • Strategy Overview
          • Marketing Strategy
          • Product Strategy
          • Channel Strategy
      • Guinault (air starts only)
        • Overview
        • Product Portfolio
        • Profitability by Market Segments (Product/Age /Sales Channel/Region)
        • Sales Footprint
        • Strategy Overview
          • Marketing Strategy
          • Product Strategy
          • Channel Strategy
      • Toyota
        • Overview
        • Product Portfolio
        • Profitability by Market Segments (Product/Age /Sales Channel/Region)
        • Sales Footprint
        • Strategy Overview
          • Marketing Strategy
          • Product Strategy
          • Channel Strategy
  21. Assumptions & Acronyms Used
  22. Research Methodology

List of Tables

  • Table 1: Global Market Value (USD Billion) Forecast by Region, 2020-2035
  • Table 2: Global Market Volume (Kilotons) Forecast by Region, 2020-2035
  • Table 3: Global Market Value (USD Billion) Forecast by Equipment Type, 2020-2035
  • Table 4: Global Market Volume (Kilotons) Forecast by Equipment Type, 2020-2035
  • Table 5: Global Market Value (USD Billion) Forecast by Power, 2020-2035
  • Table 6: Global Market Volume (Kilotons) Forecast by Power, 2020-2035
  • Table 7: Global Market Value (USD Billion) Forecast by Application, 2020-2035
  • Table 8: Global Market Volume (Kilotons) Forecast by Application, 2020-2035
  • Table 9: Global Market Value (USD Billion) Forecast by Ownership, 2020-2035
  • Table 10: Global Market Volume (Kilotons) Forecast by Ownership, 2020-2035
  • Table 11: North America Market Value (USD Billion) Forecast by Country, 2020-2035
  • Table 12: North America Market Volume (Kilotons) Forecast by Country, 2020-2035
  • Table 13: North America Market Value (USD Billion) Forecast by Equipment Type, 2020-2035
  • Table 14: North America Market Volume (Kilotons) Forecast by Equipment Type, 2020-2035
  • Table 15: North America Market Value (USD Billion) Forecast by Power, 2020-2035
  • Table 16: North America Market Volume (Kilotons) Forecast by Power, 2020-2035
  • Table 17: North America Market Value (USD Billion) Forecast by Application, 2020-2035
  • Table 18: North America Market Volume (Kilotons) Forecast by Application, 2020-2035
  • Table 19: North America Market Value (USD Billion) Forecast by Ownership, 2020-2035
  • Table 20: North America Market Volume (Kilotons) Forecast by Ownership, 2020-2035
  • Table 21: Latin America Market Value (USD Billion) Forecast by Country, 2020-2035
  • Table 22: Latin America Market Volume (Kilotons) Forecast by Country, 2020-2035
  • Table 23: Latin America Market Value (USD Billion) Forecast by Equipment Type, 2020-2035
  • Table 24: Latin America Market Volume (Kilotons) Forecast by Equipment Type, 2020-2035
  • Table 25: Latin America Market Value (USD Billion) Forecast by Power, 2020-2035
  • Table 26: Latin America Market Volume (Kilotons) Forecast by Power, 2020-2035
  • Table 27: Latin America Market Value (USD Billion) Forecast by Application, 2020-2035
  • Table 28: Latin America Market Volume (Kilotons) Forecast by Application, 2020-2035
  • Table 29: Latin America Market Value (USD Billion) Forecast by Ownership, 2020-2035
  • Table 30: Latin America Market Volume (Kilotons) Forecast by Ownership, 2020-2035
  • Table 31: Western Europe Market Value (USD Billion) Forecast by Country, 2020-2035
  • Table 32: Western Europe Market Volume (Kilotons) Forecast by Country, 2020-2035
  • Table 33: Western Europe Market Value (USD Billion) Forecast by Equipment Type, 2020-2035
  • Table 34: Western Europe Market Volume (Kilotons) Forecast by Equipment Type, 2020-2035
  • Table 35: Western Europe Market Value (USD Billion) Forecast by Power, 2020-2035
  • Table 36: Western Europe Market Volume (Kilotons) Forecast by Power, 2020-2035
  • Table 37: Western Europe Market Value (USD Billion) Forecast by Application, 2020-2035
  • Table 38: Western Europe Market Volume (Kilotons) Forecast by Application, 2020-2035
  • Table 39: Western Europe Market Value (USD Billion) Forecast by Ownership, 2020-2035
  • Table 40: Western Europe Market Volume (Kilotons) Forecast by Ownership, 2020-2035
  • Table 41: Eastern Europe Market Value (USD Billion) Forecast by Country, 2020-2035
  • Table 42: Eastern Europe Market Volume (Kilotons) Forecast by Country, 2020-2035
  • Table 43: Eastern Europe Market Value (USD Billion) Forecast by Equipment Type, 2020-2035
  • Table 44: Eastern Europe Market Volume (Kilotons) Forecast by Equipment Type, 2020-2035
  • Table 45: Eastern Europe Market Value (USD Billion) Forecast by Power, 2020-2035
  • Table 46: Eastern Europe Market Volume (Kilotons) Forecast by Power, 2020-2035
  • Table 47: Eastern Europe Market Value (USD Billion) Forecast by Application, 2020-2035
  • Table 48: Eastern Europe Market Volume (Kilotons) Forecast by Application, 2020-2035
  • Table 49: Eastern Europe Market Value (USD Billion) Forecast by Ownership, 2020-2035
  • Table 50: Eastern Europe Market Volume (Kilotons) Forecast by Ownership, 2020-2035
  • Table 51: East Asia Market Value (USD Billion) Forecast by Country, 2020-2035
  • Table 52: East Asia Market Volume (Kilotons) Forecast by Country, 2020-2035
  • Table 53: East Asia Market Value (USD Billion) Forecast by Equipment Type, 2020-2035
  • Table 54: East Asia Market Volume (Kilotons) Forecast by Equipment Type, 2020-2035
  • Table 55: East Asia Market Value (USD Billion) Forecast by Power, 2020-2035
  • Table 56: East Asia Market Volume (Kilotons) Forecast by Power, 2020-2035
  • Table 57: East Asia Market Value (USD Billion) Forecast by Application, 2020-2035
  • Table 58: East Asia Market Volume (Kilotons) Forecast by Application, 2020-2035
  • Table 59: East Asia Market Value (USD Billion) Forecast by Ownership, 2020-2035
  • Table 60: East Asia Market Volume (Kilotons) Forecast by Ownership, 2020-2035
  • Table 61: South Asia & Pacific Market Value (USD Billion) Forecast by Country, 2020-2035
  • Table 62: South Asia & Pacific Market Volume (Kilotons) Forecast by Country, 2020-2035
  • Table 63: South Asia & Pacific Market Value (USD Billion) Forecast by Equipment Type, 2020-2035
  • Table 64: South Asia & Pacific Market Volume (Kilotons) Forecast by Equipment Type, 2020-2035
  • Table 65: South Asia & Pacific Market Value (USD Billion) Forecast by Power, 2020-2035
  • Table 66: South Asia & Pacific Market Volume (Kilotons) Forecast by Power, 2020-2035
  • Table 67: South Asia & Pacific Market Value (USD Billion) Forecast by Application, 2020-2035
  • Table 68: South Asia & Pacific Market Volume (Kilotons) Forecast by Application, 2020-2035
  • Table 69: South Asia & Pacific Market Value (USD Billion) Forecast by Ownership, 2020-2035
  • Table 70: South Asia & Pacific Market Volume (Kilotons) Forecast by Ownership, 2020-2035
  • Table 71: Middle East and Africa Market Value (USD Billion) Forecast by Country, 2020-2035
  • Table 72: Middle East and Africa Market Volume (Kilotons) Forecast by Country, 2020-2035
  • Table 73: Middle East and Africa Market Value (USD Billion) Forecast by Equipment Type, 2020-2035
  • Table 74: Middle East and Africa Market Volume (Kilotons) Forecast by Equipment Type, 2020-2035
  • Table 75: Middle East and Africa Market Value (USD Billion) Forecast by Power, 2020-2035
  • Table 76: Middle East and Africa Market Volume (Kilotons) Forecast by Power, 2020-2035
  • Table 77: Middle East and Africa Market Value (USD Billion) Forecast by Application, 2020-2035
  • Table 78: Middle East and Africa Market Volume (Kilotons) Forecast by Application, 2020-2035
  • Table 79: Middle East and Africa Market Value (USD Billion) Forecast by Ownership, 2020-2035
  • Table 80: Middle East and Africa Market Volume (Kilotons) Forecast by Ownership, 2020-2035


List of Figures

  • Figure 1: Global Market Volume (Kilotons) Forecast 2020-2035
  • Figure 2: Global Market Pricing Analysis
  • Figure 3: Global Market Value (USD Billion) Forecast 2020-2035
  • Figure 4: Global Market Value Share and BPS Analysis by Equipment Type, 2025 and 2035
  • Figure 5: Global Market Y-o-Y Growth Comparison by Equipment Type, 2025-2035
  • Figure 6: Global Market Attractiveness Analysis by Equipment Type
  • Figure 7: Global Market Value Share and BPS Analysis by Power, 2025 and 2035
  • Figure 8: Global Market Y-o-Y Growth Comparison by Power, 2025-2035
  • Figure 9: Global Market Attractiveness Analysis by Power
  • Figure 10: Global Market Value Share and BPS Analysis by Application, 2025 and 2035
  • Figure 11: Global Market Y-o-Y Growth Comparison by Application, 2025-2035
  • Figure 12: Global Market Attractiveness Analysis by Application
  • Figure 13: Global Market Value Share and BPS Analysis by Ownership, 2025 and 2035
  • Figure 14: Global Market Y-o-Y Growth Comparison by Ownership, 2025-2035
  • Figure 15: Global Market Attractiveness Analysis by Ownership
  • Figure 16: Global Market Value (USD Billion) Share and BPS Analysis by Region, 2025 and 2035
  • Figure 17: Global Market Y-o-Y Growth Comparison by Region, 2025-2035
  • Figure 18: Global Market Attractiveness Analysis by Region
  • Figure 19: North America Market Incremental $ Opportunity, 2025-2035
  • Figure 20: Latin America Market Incremental $ Opportunity, 2025-2035
  • Figure 21: Western Europe Market Incremental $ Opportunity, 2025-2035
  • Figure 22: Eastern Europe Market Incremental $ Opportunity, 2025-2035
  • Figure 23: East Asia Market Incremental $ Opportunity, 2025-2035
  • Figure 24: South Asia & Pacific Market Incremental $ Opportunity, 2025-2035
  • Figure 25: Middle East and Africa Market Incremental $ Opportunity, 2025-2035
  • Figure 26: North America Market Value Share and BPS Analysis by Country, 2025 and 2035
  • Figure 27: North America Market Value Share and BPS Analysis by Equipment Type, 2025 and 2035
  • Figure 28: North America Market Y-o-Y Growth Comparison by Equipment Type, 2025-2035
  • Figure 29: North America Market Attractiveness Analysis by Equipment Type
  • Figure 30: North America Market Value Share and BPS Analysis by Power, 2025 and 2035
  • Figure 31: North America Market Y-o-Y Growth Comparison by Power, 2025-2035
  • Figure 32: North America Market Attractiveness Analysis by Power
  • Figure 33: North America Market Value Share and BPS Analysis by Application, 2025 and 2035
  • Figure 34: North America Market Y-o-Y Growth Comparison by Application, 2025-2035
  • Figure 35: North America Market Attractiveness Analysis by Application
  • Figure 36: North America Market Value Share and BPS Analysis by Ownership, 2025 and 2035
  • Figure 37: North America Market Y-o-Y Growth Comparison by Ownership, 2025-2035
  • Figure 38: North America Market Attractiveness Analysis by Ownership
  • Figure 39: Latin America Market Value Share and BPS Analysis by Country, 2025 and 2035
  • Figure 40: Latin America Market Value Share and BPS Analysis by Equipment Type, 2025 and 2035
  • Figure 41: Latin America Market Y-o-Y Growth Comparison by Equipment Type, 2025-2035
  • Figure 42: Latin America Market Attractiveness Analysis by Equipment Type
  • Figure 43: Latin America Market Value Share and BPS Analysis by Power, 2025 and 2035
  • Figure 44: Latin America Market Y-o-Y Growth Comparison by Power, 2025-2035
  • Figure 45: Latin America Market Attractiveness Analysis by Power
  • Figure 46: Latin America Market Value Share and BPS Analysis by Application, 2025 and 2035
  • Figure 47: Latin America Market Y-o-Y Growth Comparison by Application, 2025-2035
  • Figure 48: Latin America Market Attractiveness Analysis by Application
  • Figure 49: Latin America Market Value Share and BPS Analysis by Ownership, 2025 and 2035
  • Figure 50: Latin America Market Y-o-Y Growth Comparison by Ownership, 2025-2035
  • Figure 51: Latin America Market Attractiveness Analysis by Ownership
  • Figure 52: Western Europe Market Value Share and BPS Analysis by Country, 2025 and 2035
  • Figure 53: Western Europe Market Value Share and BPS Analysis by Equipment Type, 2025 and 2035
  • Figure 54: Western Europe Market Y-o-Y Growth Comparison by Equipment Type, 2025-2035
  • Figure 55: Western Europe Market Attractiveness Analysis by Equipment Type
  • Figure 56: Western Europe Market Value Share and BPS Analysis by Power, 2025 and 2035
  • Figure 57: Western Europe Market Y-o-Y Growth Comparison by Power, 2025-2035
  • Figure 58: Western Europe Market Attractiveness Analysis by Power
  • Figure 59: Western Europe Market Value Share and BPS Analysis by Application, 2025 and 2035
  • Figure 60: Western Europe Market Y-o-Y Growth Comparison by Application, 2025-2035
  • Figure 61: Western Europe Market Attractiveness Analysis by Application
  • Figure 62: Western Europe Market Value Share and BPS Analysis by Ownership, 2025 and 2035
  • Figure 63: Western Europe Market Y-o-Y Growth Comparison by Ownership, 2025-2035
  • Figure 64: Western Europe Market Attractiveness Analysis by Ownership
  • Figure 65: Eastern Europe Market Value Share and BPS Analysis by Country, 2025 and 2035
  • Figure 66: Eastern Europe Market Value Share and BPS Analysis by Equipment Type, 2025 and 2035
  • Figure 67: Eastern Europe Market Y-o-Y Growth Comparison by Equipment Type, 2025-2035
  • Figure 68: Eastern Europe Market Attractiveness Analysis by Equipment Type
  • Figure 69: Eastern Europe Market Value Share and BPS Analysis by Power, 2025 and 2035
  • Figure 70: Eastern Europe Market Y-o-Y Growth Comparison by Power, 2025-2035
  • Figure 71: Eastern Europe Market Attractiveness Analysis by Power
  • Figure 72: Eastern Europe Market Value Share and BPS Analysis by Application, 2025 and 2035
  • Figure 73: Eastern Europe Market Y-o-Y Growth Comparison by Application, 2025-2035
  • Figure 74: Eastern Europe Market Attractiveness Analysis by Application
  • Figure 75: Eastern Europe Market Value Share and BPS Analysis by Ownership, 2025 and 2035
  • Figure 76: Eastern Europe Market Y-o-Y Growth Comparison by Ownership, 2025-2035
  • Figure 77: Eastern Europe Market Attractiveness Analysis by Ownership
  • Figure 78: East Asia Market Value Share and BPS Analysis by Country, 2025 and 2035
  • Figure 79: East Asia Market Value Share and BPS Analysis by Equipment Type, 2025 and 2035
  • Figure 80: East Asia Market Y-o-Y Growth Comparison by Equipment Type, 2025-2035
  • Figure 81: East Asia Market Attractiveness Analysis by Equipment Type
  • Figure 82: East Asia Market Value Share and BPS Analysis by Power, 2025 and 2035
  • Figure 83: East Asia Market Y-o-Y Growth Comparison by Power, 2025-2035
  • Figure 84: East Asia Market Attractiveness Analysis by Power
  • Figure 85: East Asia Market Value Share and BPS Analysis by Application, 2025 and 2035
  • Figure 86: East Asia Market Y-o-Y Growth Comparison by Application, 2025-2035
  • Figure 87: East Asia Market Attractiveness Analysis by Application
  • Figure 88: East Asia Market Value Share and BPS Analysis by Ownership, 2025 and 2035
  • Figure 89: East Asia Market Y-o-Y Growth Comparison by Ownership, 2025-2035
  • Figure 90: East Asia Market Attractiveness Analysis by Ownership
  • Figure 91: South Asia & Pacific Market Value Share and BPS Analysis by Country, 2025 and 2035
  • Figure 92: South Asia & Pacific Market Value Share and BPS Analysis by Equipment Type, 2025 and 2035
  • Figure 93: South Asia & Pacific Market Y-o-Y Growth Comparison by Equipment Type, 2025-2035
  • Figure 94: South Asia & Pacific Market Attractiveness Analysis by Equipment Type
  • Figure 95: South Asia & Pacific Market Value Share and BPS Analysis by Power, 2025 and 2035
  • Figure 96: South Asia & Pacific Market Y-o-Y Growth Comparison by Power, 2025-2035
  • Figure 97: South Asia & Pacific Market Attractiveness Analysis by Power
  • Figure 98: South Asia & Pacific Market Value Share and BPS Analysis by Application, 2025 and 2035
  • Figure 99: South Asia & Pacific Market Y-o-Y Growth Comparison by Application, 2025-2035
  • Figure 100: South Asia & Pacific Market Attractiveness Analysis by Application
  • Figure 101: South Asia & Pacific Market Value Share and BPS Analysis by Ownership, 2025 and 2035
  • Figure 102: South Asia & Pacific Market Y-o-Y Growth Comparison by Ownership, 2025-2035
  • Figure 103: South Asia & Pacific Market Attractiveness Analysis by Ownership
  • Figure 104: Middle East and Africa Market Value Share and BPS Analysis by Country, 2025 and 2035
  • Figure 105: Middle East and Africa Market Value Share and BPS Analysis by Equipment Type, 2025 and 2035
  • Figure 106: Middle East and Africa Market Y-o-Y Growth Comparison by Equipment Type, 2025-2035
  • Figure 107: Middle East and Africa Market Attractiveness Analysis by Equipment Type
  • Figure 108: Middle East and Africa Market Value Share and BPS Analysis by Power, 2025 and 2035
  • Figure 109: Middle East and Africa Market Y-o-Y Growth Comparison by Power, 2025-2035
  • Figure 110: Middle East and Africa Market Attractiveness Analysis by Power
  • Figure 111: Middle East and Africa Market Value Share and BPS Analysis by Application, 2025 and 2035
  • Figure 112: Middle East and Africa Market Y-o-Y Growth Comparison by Application, 2025-2035
  • Figure 113: Middle East and Africa Market Attractiveness Analysis by Application
  • Figure 114: Middle East and Africa Market Value Share and BPS Analysis by Ownership, 2025 and 2035
  • Figure 115: Middle East and Africa Market Y-o-Y Growth Comparison by Ownership, 2025-2035
  • Figure 116: Middle East and Africa Market Attractiveness Analysis by Ownership
  • Figure 117: Global Market - Tier Structure Analysis
  • Figure 118: Global Market - Company Share Analysis

Frequently Asked Questions

How big is the aircraft ground support equipment market in 2025?

The global aircraft ground support equipment market is estimated to be valued at USD 10.0 billion in 2025.

What will be the size of the aircraft ground support equipment market in 2035?

The market size for aircraft ground support equipment is projected to reach USD 19.7 billion by 2035.

How much will be the aircraft ground support equipment market growth between 2025 and 2035?

The aircraft ground support equipment market is expected to grow at a 7.0% CAGR between 2025 and 2035.

Which power type segment is projected to lead in the aircraft ground support equipment market in 2025?

The non-electric equipment segment is projected to lead in the aircraft ground support equipment market with 62% market share in 2025.

Which application segment to contribute significant share in the aircraft ground support equipment market in 2025?

In terms of application, the commercial aviation segment is expected to command 85% share in the aircraft ground support equipment market in 2025.

Explore Similar Insights

Future Market Insights

Aircraft Ground Support Equipment Market

Chat With

MaRIA

Hi There, I am MaRIA, Your Market Research Intelligence Assistant. How may I help you?