Reports
- Global Locations -
Headquarters
Future Market Insights, Inc.
Christiana Corporate, 200
Continental Drive, Suite 401,
Newark, Delaware - 19713,
United States
Americas
Future Market Insights, Inc.
616 Corporate Way, Suite 2-9018,
Valley Cottage, NY 10989, United States
MEA
Future Market Insights
1602-6 Jumeirah Bay X2 Tower, Plot No: JLT-PH2-X2A,
Jumeirah Lakes Towers, Dubai,
United Arab Emirates
Europe
Future Market Insights
3rd Floor, 207 Regent Street,
W1B 3HH London
United Kingdom
Asia Pacific
Future Market Insights
Office No. 401-A, 4th Floor,
VANTAGE 9, S.No. 36/1/1,
Baner, Pune 411045, India
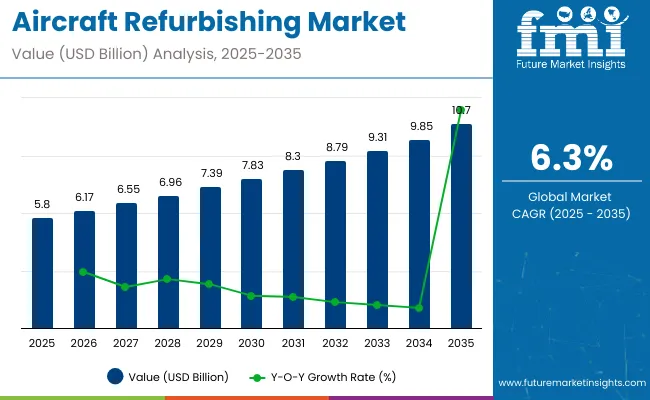
The global aircraft refurbishing market is projected to expand at a CAGR of 5.7% between 2023 and 2033 since this market is witnessing an enormous increase in demand for modernizing aircraft interiors in recent years. Future Market Insights (FMI) forecasts the market value to reach from US$ 3.1 billion in 2023 to 5.4 billion by 2033.
This growth scenario for the airplane refurbishing market is ascribed to various factors including the fact that airlines and owners of commercial aircraft are retrofitting their aircraft more rapidly than they did in the early stages of civil aviation. To provide consumers with convenience and comfort, airline companies are modernizing and renovating their current fleets of aircraft and integrating fuel-efficient features.
Many airline companies are presently focusing their efforts on enhancing cabin interiors and providing customers with an exceptional experience to raise the value of their brands. The requirement for the renovation of commercial and VIP cabins is brought on by the greater propensity of airline companies to offer luxurious services.
Owing to the rising demand for aircraft interiors from business jet owners for VIP refurbishment, sales of VIP aircraft refurbishing are expanding. High demand for VIP aircraft, new aircraft models and technology, and the introduction of new VIP aircraft models to the market are all factors propelling the demand for VIP refurbishing.
Since it provides a considerable improvement above standard economy class without costing as much as a business class ticket, premium economy class has become popular among passengers. Therefore, it is anticipated to fuel aircraft refurbishing market revenue generation over the forecast period. Additionally, major airlines all over the globe are adding a premium class section to their aircraft for passengers. As a result, there will likely be more premium economy class seats available, providing refurbishing service providers with attractive prospects.
Don't pay for what you don't need
Customize your report by selecting specific countries or regions and save 30%!
The consumption demand for aircraft refurbishing market is anticipated to be slowed down by time-consuming procedures like certification testing and passive inflammation. A further obstacle to the expansion of the market for aircraft refurbishing is likely to be the introduction of new aircraft made of lightweight and low-maintenance materials. The large initial and essential expenditure is expected to further limit the potential for expansion.
Airlines are abandoning outdated aircraft as a result of strict aircraft guidelines for air and noise pollution enforced by governments to maintain passenger safety and prevent hazardous emissions. While new-generation aircraft are improving airline safety, they are also costing manufacturers more to maintain and repair.
One of the aircraft refurbishing market key trends & opportunities that has been identified is a rise in the transition of passenger aircraft into freighters, which fuels the global sales of aircraft refurbishing industry. Numerous airlines convert outdated passenger planes that have accomplished their effective operational service as passenger aircraft into freight aircraft, prolonging the economic life of the aircraft.
The number of contracts given out by aircraft manufacturing companies for aircraft refurbishment as per the demand of clients has increased. The primary reason behind this is the growing demand for technically and aesthetically appealing aircraft bought on a wide scale by corporate leaders and wealthy individuals that is likely to create market opportunities. The major competitors in the market for aircraft refurbishing put a lot of effort into coming up with inventive and practical ways to modernize interiors with the newest trends for passenger safety and comfort.
With the fast advancements in technology, both suppliers and manufacturers are likely to adapt pioneering technology to boost the demand for aircraft refurbishment, which is expected to raise the fuel efficiency of commercial aircraft. Companies are anticipated to update aircraft interiors with recent technologies and refinements to offer cabin interiors an aesthetically pleasing and luxurious appearance to meet the demand.
Several top manufacturers are also following the growing trend of employing 3D printing to construct the interiors of aircraft which is also generating an optimistic outlook scope of aircraft refurbishing market. Since 3D printed materials are lighter, less jet fuel must be used, which eventually lowers air pollution. Additionally, it enables airlines to create more sophisticated components following consumer demand and the fabrication of obsolete parts.
Attributes | Details |
---|---|
Aircraft Refurbishing Market Base Year Value (2022) | US$ 2.9 billion |
Aircraft Refurbishing Market Value (2023) | US$ 3.1 billion |
Aircraft Refurbishing Market Absolute Dollar Growth (US$ million/billion) | US$ 2.3 billion |
Aircraft Refurbishing Market Expected Value (2033) | US$ 5.4 billion |
Aircraft Refurbishing Market Projected CAGR (2023 to 2033) | 5.7% |
The aircraft refurbishing market is estimated to grow at 5.7% CAGR between 2023 and 2033. In the past, the market value of aircraft refurbishing showed sluggish development from 2017 to 2022, with a CAGR of 1.9%.
The advent of new technologies for interior refurbishing in existing aircraft to make them more comfortable for passengers is aiding the growth of the market. Many airlines are choosing refurbishing interiors with improved technologies to cater to the increasing demand for better comfort and luxury in air travel.
On the back of these factors, sales in the aircraft refurbishing market are likely to increase by 1.8x, reaching a valuation of US$ 3.1 billion in 2023 and US$ 5.4 billion by 2033.
Historical CAGR (2017 to 2022) | 1.9% |
---|---|
Forecast CAGR (2023 to 2033) | 5.7% |
Aircraft Refurbishing Market:
Differentiating Aspects | Aircraft Refurbishing Market |
---|---|
CAGR (2023 to 2033) | 5.7% |
Market Valuation in 2023 | US$ 3.1 billion |
Projected Market Value in 2033 | US$ 5.4 billion |
Growth Factors | Expansion of commercial aviation activities |
Opportunities | Growing demand for VIP refurbishing of aircrafts |
Key Trends | Increasing passenger interest in premium economy class |
Aircraft Cabin Interiors Market:
Differentiating Aspects | Aircraft Cabin Interiors Market |
---|---|
CAGR (2023 to 2033) | 8% |
Market Valuation in 2023 | US$ 26.78 billion |
Projected Market Value in 2033 | US$ 57.82 billion |
Growth Factors | Increasing preference for luxury transportation among people |
Opportunities | Several airlines are making investments to modernize their present fleets of aircraft. |
Key Trends | Growing adoption of in-flight entertainment |
Aircraft Maintenance, Repair, and Overhaul Market:
Differentiating Aspects | Aircraft Maintenance, Repair, and Overhaul Market |
---|---|
CAGR (2023 to 2033) | 3.7% |
Market Valuation in 2023 | US$ 49.96 billion |
Projected Market Value in 2033 | US$ 71.85 billion |
Growth Factors | Growth in air travel by people for both personal and professional reasons |
Opportunities | Upsurge in spending on software for aircraft MRO |
Key Trends | Migration movements across the world are on the rise |
Get the data you need at a Fraction of the cost
Personalize your report by choosing insights you need
and save 40%!
Region | North America |
---|---|
Country | United States |
CAGR (2023 to 2033) | 5.5% |
Region | Europe |
---|---|
Country | United Kingdom |
CAGR (2023 to 2033) | 5.1% |
Region | Europe |
---|---|
Country | Germany |
CAGR (2023 to 2033) | 5.8 |
Region | Asia Pacific |
---|---|
Country | China |
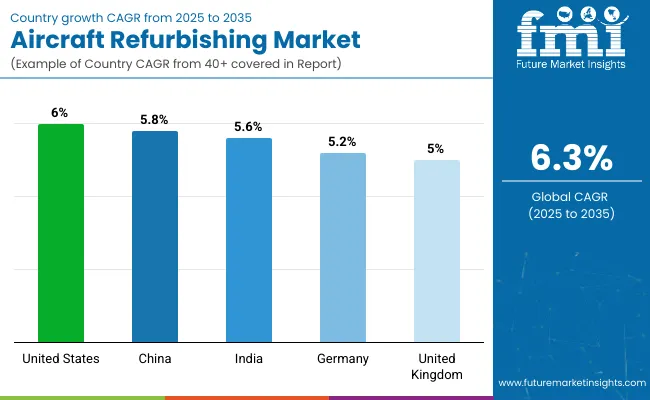
CAGR (2023 to 2033) | 6.7% |
Region | Asia Pacific |
---|---|
Country | Japan |
CAGR (2023 to 2033) | 5.7% |
The USA market is predicted to remain one of the most lucrative markets during the forecast period, according to Future Market Insights. The United States aircraft refurbishing market is estimated to account for over 90% of the North American market in 2023.
Attributes | Details |
---|---|
USA Market Size (2033) | US$ 1.7 billion |
USA Market Absolute Dollar Growth (US$ million/billion) | US$ 200 million |
CAGR % 2017 to 2022 | 1.0% |
CAGR % 2023 to End of Forecast(2033) | 5.5% |
North America has the highest aircraft fleet, with The USA contributing to the maximum share. Also, the fleet size is growing due to increasing air travel and the adoption of advanced technology in aircraft repair.
This is facilitating the growth of the aerospace industry in North America. Growth in the industry also is driven by the strong presence of complete aircraft completion centers that specializes in aircraft cabin design modifications and deliver VIP completions.
Hence, with the increase in air travel demand and growth in air passenger traffic for tourism and business purposes, the need for aircraft refurbishing is expected to grow at 5.5% CAGR through 2033.
The United Kingdom is home to a number of significant firms in the aircraft refurbishing sector. The necessity for aircraft refurbishment in the nation is further fueled by the prominence of major aircraft manufacturers like Airbus. In the United Kingdom today, Airbus is both the largest exporter of civil aircraft and the largest commercial aerospace firm.
Attributes | Details |
---|---|
The United Kingdom Market Size (2033) | US$ 237.6 million |
The United Kingdom Market Absolute Dollar Growth (US$ million/billion) | US$ 16.9 million |
CAGR % 2017 to 2022 | 2.0% |
CAGR % 2023 to End of Forecast(2033) | 5.1% |
The United Kingdom's aircraft refurbishing market is likely to witness a 5.1% CAGR through 2033 as a result of the country having a sizable aircraft manufacturing business. A few other important reasons driving the market's growth are early technological adoption, well-established infrastructure, and substantial investment in the aviation industry.
Germany is a lucrative market for aircraft refurbishment since it has a large number of organizations that offer maintenance and repair services for aircraft. One of the main factors contributing to Germany's strong profitability as a market for MRO suppliers is the size of the narrow-body and wide-body aircraft fleet in Western Europe.
Attributes | Details |
---|---|
Germany Market Size (2033) | US$ 189 million |
Germany Market Absolute Dollar Growth (US$ million/billion) | US$ 24.1 million |
CAGR % 2017 to 2022 | 1.7% |
CAGR % 2023 to End of Forecast(2033) | 5.8% |
Germany is a competitive marketplace since there is a large demand for air travel there and a considerable increase in the amount of air passenger traffic from developing countries, which is driving up the aircraft refurbishing market revenue generation. Through 2033, the German aircraft refurbishing market is anticipated to grow at a CAGR of 5.8%.
As per FMI, ASEAN countries will account for nearly 40.6% of the market share in South Asia & Pacific in 2023. Countries such as Indonesia, Malaysia, and Singapore have major players providing maintenance, repair & overhaul (MRO) services for commercial aircraft.
Many airlines are opting for refurbishing due to stringent government regulations for the early withdrawal of old aircraft in service. Companies in the ASEAN market are also opening new aircraft maintenance facilities in countries such as South Korea through joint ventures with local partners. This is expected to bode well for the market.
Demand in China is expected to rise at nearly 6.7% CAGR over the forecast period. China is home to one of the largest aircraft fleets in the world which makes it a lucrative region for aircraft refurbishing.
Attributes | Details |
---|---|
China Market Size (2033) | US$ 324 million |
China Market Absolute Dollar Growth (US$ million/billion) | US$ 73 million |
CAGR % 2017 to 2022 | 3.5% |
CAGR % 2023 to End of Forecast(2033) | 6.7% |
It is among the largest MRO service providers and clocks in frequent retirement of aircraft due to stringent government emission regulations in the country.
With the increasing global competition in the market for aircraft refurbishing, new technologies are been implemented by service providers for aircraft interiors such as in-flight entertainment systems (IFES). Besides this, investment in 3D printing technologies for aircraft interior components and the use of lightweight materials for cabin interiors is surging
These factors are driving the aircraft refurbishing industry in China. As per FMI, sales of aircraft refurbishing are expected to total US$ 324 million by 2033-end.
Throughout the forecast period, the Japanese refurbishing aircraft market is expected to maintain a stable CAGR of 5.7%. This is due to a rise in the number of airlines and airports in the nation.
Attributes | Details |
---|---|
Japan Market Size (2033) | US$ 145.8 million |
Japan Market Absolute Dollar Growth (US$ million/billion) | US$ 14.3 million |
CAGR % 2017 to 2022 | 2.9% |
CAGR % 2023 to End of Forecast(2033) | 5.7% |
The construction of new airports, an increase in tourism, and investments in the expansion of existing ones are expected to present profitable growth possibilities for market participants functioning in the market for aircraft refurbishing.
Segment | Fitting Type |
---|---|
Attributes | Retrofit |
CAGR % 2017 to 2022 | 1.9% |
CAGR % 2023 to End of Forecast(2033) | 5.4% |
Segment | Aircraft Type |
---|---|
Attributes | Narrow Body Aircraft |
CAGR % 2017 to 2022 | 2.3% |
CAGR % 2023 to End of Forecast(2033) | 5.5% |
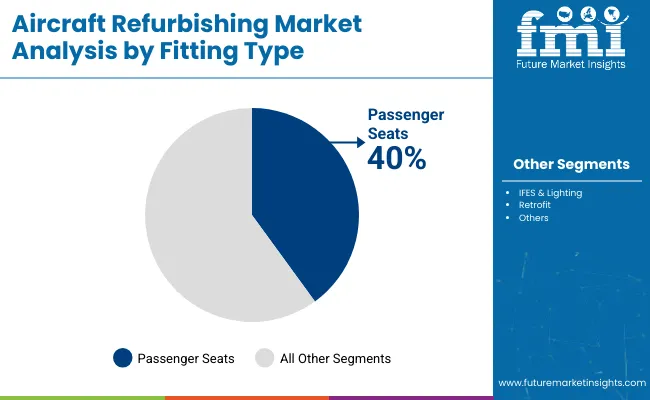
Retrofitting in aircraft is the modification of aircraft interiors such as the installation of new cabins, technologically advanced connectivity solutions, or avionics systems in aircraft. Improved standard of living and an expanding middle-class population in countries such as India and China are fueling the demand for retrofitting aircraft.
With the implementation of stringent emission regulations coupled with growing demand for passenger safety and comfort, airlines are focusing on using various technical advances in aircraft design with retrofitting.
This is one of the major factors accelerating the sales of the retrofit segment in the forecast period. As per FMI, the retrofit segment is estimated to grow at 5.4% CAGR through the forecast period.
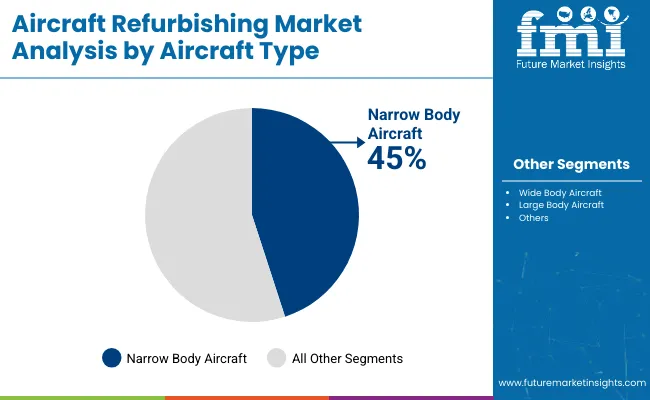
Narrow-body aircraft is known as a single-aisle aircraft that is often used for short-haul flights. These types of aircraft are designed for 150-200 passengers. Airlines are using narrow-body aircraft as they have low operation costs along with spacious cabin that results in a comfortable flying experience for the passenger.
For instance, Airbus and Boeing are manufacturing narrow-body aircraft that will be used for long-haul flights due to the growth in commercial air transportation in many countries. These aircraft are generally used for short-haul international flights as well as domestic flights and need frequent refurbishing which is fueling the rise in demand for narrow-body aircraft refurbishing.
The market share for the narrow-body aircraft segment is estimated to be more than 50% in 2023 and is likely to exhibit a CAGR of 5.5% over the forecast period.
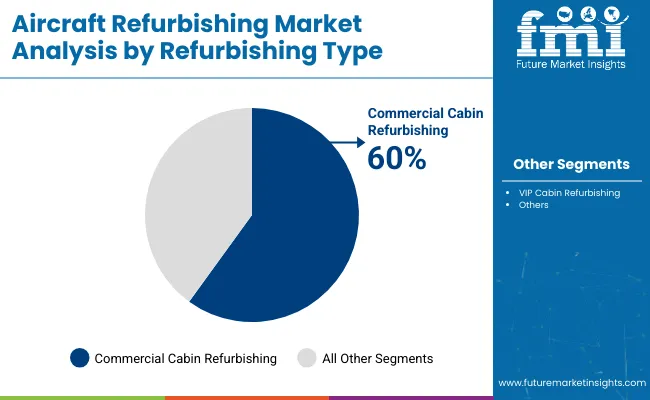
Commercial and VIP cabin refurbishment of aircraft is becoming increasingly popular due to a high number of existing aircraft fleets in regions such as North America and Europe. Major players are focusing on upgrading economy-class interiors to improve passenger comfort at a rather low investment in comparison with VIP refurbishing.
Commercial airlines are focusing on upgrading economy-class cabins to enhance airline reputation among economy-class travelers. This is expected to boost the market for interior refurbishing. As per FMI, the commercial cabin refurbishing segment is anticipated to hold more than 80% in 2023.
Technical advancements are being used by new market entrants in the refurbishment of the aircraft sector to produce innovative products and gain a competitive advantage. These businesses continually invest in Research and Development (R&D) to keep up with shifting consumer preferences and market needs. Startup businesses employ a variety of growth tactics to contribute to the development of the sector and create new technologies to meet the growing consumer demand for aircraft refurbishing market.
Leading Startups to Keep an Eye on
Start-up Company | Lilium |
---|---|
Country | Germany |
Description | Electric jets with VTOL capability are being developed by Lilium. It creates a lightweight jet that travels at a fast speed and with little noise. The business provides a digital platform for the real-time booking and scheduling of aircraft. |
Start-up Company | AerinX |
---|---|
Country | Hungary |
Description | AerinX, a smart inspection business, is dedicated to responsible innovation for the purpose of accelerating, improving, and documenting aeroplane inspection and maintenance procedures. Its smart inspection system provides accurate aircraft status and condition instantaneously available to aviation specialists at first sight. |
Start-up Company | Zephyr Aerospace |
---|---|
Country | India |
Description | Zephyr provides seat upgrades to customers and offers business class-type seats on a budget. Its patent-pending design includes a seating module that complies with social distancing, reshaping the whole aviation sector. |
Companies operating in the market for aircraft refurbishing are aiming at technological innovations for aircraft interior components. To strengthen their footprint, some are entering into strategic partnerships with other industry players. They are also keeping fruitful connections with airline corporations, where they sell cabin interiors and aircraft system parts, to enhance penetration across lucrative industries.
Top Players Share in Aircraft Refurbishing Market and their Recent Developments
Company | Gulfstream Aerospace ltd. |
---|---|
Details | American aircraft manufacturer Gulfstream Aerospace Corporation is a fully owned subsidiary of General Dynamics. Gulfstream develops, designs, constructs, distributes, and maintains business jets. Since 1958, Gulfstream has built more than 2,000 aircraft. The Gulfstream IV-SP and Gulfstream V, the company's flagship aircraft, are the most innovative business aircraft in existence. |
Recent Developments | In November 2022, the delivery of a Gulfstream G600 to private aviation operator Thrive Aviation was announced by Gulfstream Aerospace Corp. Thrive's entry into the long-distance and on-demand private charter market is made possible by the inclusion of the next-generation Gulfstream aircraft. |
Company | Hong Kong Aircraft Engineering Co. Ltd. (HAECO) |
---|---|
Details | One of the top independent aviation engineering and repair companies in the world is HAECO. In terms of capability, it is among the biggest providers of Maintenance, Repair, and Overhaul (MRO) services. The Group provides a broad range of services through its 16 operational businesses worldwide, including freighter conversion, inventory technical management, line services, component services, engine maintenance, technical training, and cabin and private jet solutions. |
Recent Developments | In September 2022, The Airbus A319neo aircraft's new interior design concept, Lotus, was established by HAECO Private Jet Solutions, a cabin specialist division of HAECO Xiamen. HAECO Xiamen and MBG International Design, LLC collaborated to develop the Asian art deco cabin, which was inspired by the lotus blossom. This design can be used for aircraft from manufacturers like Airbus, Boeing, and others. |
Company | Diehl Shiftung |
---|---|
Details | One of the world's top companies in the field of flight and cabin control is Diehl Shiftung & Co. KG. Diehl Aviation is a reputable partner to the aviation industry and an international first-tier supplier of avionics and cabin integration. In addition to avionics and cabin equipment, Diehl Aviation also offers galleys, restrooms, and monuments, as well as sanitary solutions for aircraft, fire protection, water supply, air conditioning, and extensive retrofit solutions. |
Recent Developments | In July 2021, Diehl Shiftung entered into a strategic partnership with HAECO Cabin Solutions to upgrade solutions for commercial aircraft cabins |
Company | JAMCO |
---|---|
Details | For more than 60 years, JAMCO has established a reputation as the top independent aviation maintenance provider in Japan. Every flight's safety is ensured by JAMCO's skilled maintenance personnel, ready facilities, and gear. Technical partnerships with aircraft manufacturers and global aviation component manufacturers provide significant technical support for its services. |
Recent Developments | In September 2021, JAMCO partnered with Object Theory to create a new augmented reality (AR) tool for efficient maintenance services. The company’s vision is to ensure maximum operational efficiency |
1. Executive Summary 1.1. Global Market Outlook 1.2. Demand-side Trends 1.3. Supply-side Trends 1.4. Technology Roadmap Analysis 1.5. Analysis and Recommendations 2. Market Overview 2.1. Market Coverage / Taxonomy 2.2. Market Definition / Scope / Limitations 3. Market Background 3.1. Market Dynamics 3.1.1. Drivers 3.1.2. Restraints 3.1.3. Opportunity 3.1.4. Trends 3.2. Scenario Forecast 3.2.1. Demand in Optimistic Scenario 3.2.2. Demand in Likely Scenario 3.2.3. Demand in Conservative Scenario 3.3. Opportunity Map Analysis 3.4. Product Life Cycle Analysis 3.5. Supply Chain Analysis 3.5.1. Supply Side Participants and their Roles 3.5.1.1. Producers 3.5.1.2. Mid-Level Participants (Traders/ Agents/ Brokers) 3.5.1.3. Wholesalers and Distributors 3.5.2. Value Added and Value Created at Node in the Supply Chain 3.5.3. List of Raw Material Suppliers 3.5.4. List of Existing and Potential Buyers 3.6. Investment Feasibility Matrix 3.7. Value Chain Analysis 3.7.1. Profit Margin Analysis 3.7.2. Wholesalers and Distributors 3.7.3. Retailers 3.8. PESTLE and Porter’s Analysis 3.9. Regulatory Landscape 3.9.1. By Key Regions 3.9.2. By Key Countries 3.10. Regional Parent Market Outlook 3.11. Production and Consumption Statistics 3.12. Import and Export Statistics 4. Global Market Analysis 2017 to 2022 and Forecast, 2023 to 2033 4.1. Historical Market Size Value (US$ million) & Volume (Units) Analysis, 2017 to 2022 4.2. Current and Future Market Size Value (US$ million) & Volume (Units) Projections, 2023 to 2033 4.2.1. Y-o-Y Growth Trend Analysis 4.2.2. Absolute $ Opportunity Analysis 5. Global Market Analysis 2017 to 2022 and Forecast 2023 to 2033, By Fitting Type 5.1. Introduction / Key Findings 5.2. Historical Market Size Value (US$ million) & Volume (Units) Analysis By Fitting Type, 2017 to 2022 5.3. Current and Future Market Size Value (US$ million) & Volume (Units) Analysis and Forecast By Fitting Type, 2023 to 2033 5.3.1. IFES & Lighting 5.3.2. Passenger Seats 5.4. Y-o-Y Growth Trend Analysis By Fitting Type, 2017 to 2022 5.5. Absolute $ Opportunity Analysis By Fitting Type, 2023 to 2033 6. Global Market Analysis 2017 to 2022 and Forecast 2023 to 2033, By Aircraft Type 6.1. Introduction / Key Findings 6.2. Historical Market Size Value (US$ million) & Volume (Units) Analysis By Aircraft Type, 2017 to 2022 6.3. Current and Future Market Size Value (US$ million) & Volume (Units) Analysis and Forecast By Aircraft Type, 2023 to 2033 6.3.1. Large Body Aircraft 6.3.2. Wide Body Aircraft 6.3.3. Narrow Body Aircraft 6.4. Y-o-Y Growth Trend Analysis By Aircraft Type, 2017 to 2022 6.5. Absolute $ Opportunity Analysis By Aircraft Type, 2023 to 2033 7. Global Market Analysis 2017 to 2022 and Forecast 2023 to 2033, By Refurbishing Type 7.1. Introduction / Key Findings 7.2. Historical Market Size Value (US$ million) & Volume (Units) Analysis By Refurbishing Type, 2017 to 2022 7.3. Current and Future Market Size Value (US$ million) & Volume (Units) Analysis and Forecast By Refurbishing Type, 2023 to 2033 7.3.1. VIP Cabin Refurbishing 7.3.2. Commercial Cabin Refurbishing 7.4. Y-o-Y Growth Trend Analysis By Refurbishing Type, 2017 to 2022 7.5. Absolute $ Opportunity Analysis By Refurbishing Type, 2023 to 2033 8. Global Market Analysis 2017 to 2022 and Forecast 2023 to 2033, By Region 8.1. Introduction 8.2. Historical Market Size Value (US$ million) & Volume (Units) Analysis By Region, 2017 to 2022 8.3. Current Market Size Value (US$ million) & Volume (Units) Analysis and Forecast By Region, 2023 to 2033 8.3.1. North America 8.3.2. Latin America 8.3.3. Europe 8.3.4. East Asia 8.3.5. South Asia & Pacific 8.3.6. MEA 8.4. Market Attractiveness Analysis By Region 9. North America Market Analysis 2017 to 2022 and Forecast 2023 to 2033, By Country 9.1. Historical Market Size Value (US$ million) & Volume (Units) Trend Analysis By Market Taxonomy, 2017 to 2022 9.2. Market Size Value (US$ million) & Volume (Units) Forecast By Market Taxonomy, 2023 to 2033 9.2.1. By Country 9.2.1.1. TheuSA 9.2.1.2. Canada 9.2.2. By Fitting Type 9.2.3. By Aircraft Type 9.2.4. By Refurbishing Type 9.3. Market Attractiveness Analysis 9.3.1. By Country 9.3.2. By Fitting Type 9.3.3. By Aircraft Type 9.3.4. By Refurbishing Type 9.4. Key Takeaways 10. Latin America Market Analysis 2017 to 2022 and Forecast 2023 to 2033, By Country 10.1. Historical Market Size Value (US$ million) & Volume (Units) Trend Analysis By Market Taxonomy, 2017 to 2022 10.2. Market Size Value (US$ million) & Volume (Units) Forecast By Market Taxonomy, 2023 to 2033 10.2.1. By Country 10.2.1.1. Brazil 10.2.1.2. Mexico 10.2.1.3. Rest of Latin America 10.2.2. By Fitting Type 10.2.3. By Aircraft Type 10.2.4. By Refurbishing Type 10.3. Market Attractiveness Analysis 10.3.1. By Country 10.3.2. By Fitting Type 10.3.3. By Aircraft Type 10.3.4. By Refurbishing Type 10.4. Key Takeaways 11. Europe Market Analysis 2017 to 2022 and Forecast 2023 to 2033, By Country 11.1. Historical Market Size Value (US$ million) & Volume (Units) Trend Analysis By Market Taxonomy, 2017 to 2022 11.2. Market Size Value (US$ million) & Volume (Units) Forecast By Market Taxonomy, 2023 to 2033 11.2.1. By Country 11.2.1.1. Germany 11.2.1.2. France 11.2.1.3. United Kingdom 11.2.1.4. Italy 11.2.1.5. Spain 11.2.1.6. BENELUX 11.2.1.7. Poland 11.2.1.8. Russia 11.2.1.9. Rest of Europe 11.2.2. By Fitting Type 11.2.3. By Aircraft Type 11.2.4. By Refurbishing Type 11.3. Market Attractiveness Analysis 11.3.1. By Country 11.3.2. By Fitting Type 11.3.3. By Aircraft Type 11.3.4. By Refurbishing Type 11.4. Key Takeaways 12. East Asia Market Analysis 2017 to 2022 and Forecast 2023 to 2033, By Country 12.1. Historical Market Size Value (US$ million) & Volume (Units) Trend Analysis By Market Taxonomy, 2017 to 2022 12.2. Market Size Value (US$ million) & Volume (Units) Forecast By Market Taxonomy, 2023 to 2033 12.2.1. By Country 12.2.1.1. China 12.2.1.2. Japan 12.2.1.3. South Korea 12.2.2. By Fitting Type 12.2.3. By Aircraft Type 12.2.4. By Refurbishing Type 12.3. Market Attractiveness Analysis 12.3.1. By Country 12.3.2. By Fitting Type 12.3.3. By Aircraft Type 12.3.4. By Refurbishing Type 12.4. Key Takeaways 13. South Asia & Pacific Market Analysis 2017 to 2022 and Forecast 2023 to 2033, By Country 13.1. Historical Market Size Value (US$ million) & Volume (Units) Trend Analysis By Market Taxonomy, 2017 to 2022 13.2. Market Size Value (US$ million) & Volume (Units) Forecast By Market Taxonomy, 2023 to 2033 13.2.1. By Country 13.2.1.1. India 13.2.1.2. ASEAN 13.2.1.3. Australia & New Zealand 13.2.1.4. Rest of SAP 13.2.2. By Fitting Type 13.2.3. By Aircraft Type 13.2.4. By Refurbishing Type 13.3. Market Attractiveness Analysis 13.3.1. By Country 13.3.2. By Fitting Type 13.3.3. By Aircraft Type 13.3.4. By Refurbishing Type 13.4. Key Takeaways 14. MEA Market Analysis 2017 to 2022 and Forecast 2023 to 2033, By Country 14.1. Historical Market Size Value (US$ million) & Volume (Units) Trend Analysis By Market Taxonomy, 2017 to 2022 14.2. Market Size Value (US$ million) & Volume (Units) Forecast By Market Taxonomy, 2023 to 2033 14.2.1. By Country 14.2.1.1. GCC Countries 14.2.1.2. North Africa 14.2.1.3. South Africa 14.2.1.4. Rest of MEA 14.2.2. By Fitting Type 14.2.3. By Aircraft Type 14.2.4. By Refurbishing Type 14.3. Market Attractiveness Analysis 14.3.1. By Country 14.3.2. By Fitting Type 14.3.3. By Aircraft Type 14.3.4. By Refurbishing Type 14.4. Key Takeaways 15. Key Countries Market Analysis 15.1. The USA 15.1.1. Pricing Analysis 15.1.2. Market Share Analysis, 2022 15.1.2.1. By Fitting Type 15.1.2.2. By Aircraft Type 15.1.2.3. By Refurbishing Type 15.2. Canada 15.2.1. Pricing Analysis 15.2.2. Market Share Analysis, 2022 15.2.2.1. By Fitting Type 15.2.2.2. By Aircraft Type 15.2.2.3. By Refurbishing Type 15.3. Brazil 15.3.1. Pricing Analysis 15.3.2. Market Share Analysis, 2022 15.3.2.1. By Fitting Type 15.3.2.2. By Aircraft Type 15.3.2.3. By Refurbishing Type 15.4. Mexico 15.4.1. Pricing Analysis 15.4.2. Market Share Analysis, 2022 15.4.2.1. By Fitting Type 15.4.2.2. By Aircraft Type 15.4.2.3. By Refurbishing Type 15.5. Germany 15.5.1. Pricing Analysis 15.5.2. Market Share Analysis, 2022 15.5.2.1. By Fitting Type 15.5.2.2. By Aircraft Type 15.5.2.3. By Refurbishing Type 15.6. France 15.6.1. Pricing Analysis 15.6.2. Market Share Analysis, 2022 15.6.2.1. By Fitting Type 15.6.2.2. By Aircraft Type 15.6.2.3. By Refurbishing Type 15.7. Italy 15.7.1. Pricing Analysis 15.7.2. Market Share Analysis, 2022 15.7.2.1. By Fitting Type 15.7.2.2. By Aircraft Type 15.7.2.3. By Refurbishing Type 15.8. Spain 15.8.1. Pricing Analysis 15.8.2. Market Share Analysis, 2022 15.8.2.1. By Fitting Type 15.8.2.2. By Aircraft Type 15.8.2.3. By Refurbishing Type 15.9. United Kingdom 15.9.1. Pricing Analysis 15.9.2. Market Share Analysis, 2022 15.9.2.1. By Fitting Type 15.9.2.2. By Aircraft Type 15.9.2.3. By Refurbishing Type 15.10. BENELUX 15.10.1. Pricing Analysis 15.10.2. Market Share Analysis, 2022 15.10.2.1. By Fitting Type 15.10.2.2. By Aircraft Type 15.10.2.3. By Refurbishing Type 15.11. China 15.11.1. Pricing Analysis 15.11.2. Market Share Analysis, 2022 15.11.2.1. By Fitting Type 15.11.2.2. By Aircraft Type 15.11.2.3. By Refurbishing Type 15.12. Japan 15.12.1. Pricing Analysis 15.12.2. Market Share Analysis, 2022 15.12.2.1. By Fitting Type 15.12.2.2. By Aircraft Type 15.12.2.3. By Refurbishing Type 15.13. South Korea 15.13.1. Pricing Analysis 15.13.2. Market Share Analysis, 2022 15.13.2.1. By Fitting Type 15.13.2.2. By Aircraft Type 15.13.2.3. By Refurbishing Type 15.14. Malaysia 15.14.1. Pricing Analysis 15.14.2. Market Share Analysis, 2022 15.14.2.1. By Fitting Type 15.14.2.2. By Aircraft Type 15.14.2.3. By Refurbishing Type 15.15. ASEAN 15.15.1. Pricing Analysis 15.15.2. Market Share Analysis, 2022 15.15.2.1. By Fitting Type 15.15.2.2. By Aircraft Type 15.15.2.3. By Refurbishing Type 15.16. India 15.16.1. Pricing Analysis 15.16.2. Market Share Analysis, 2022 15.16.2.1. By Fitting Type 15.16.2.2. By Aircraft Type 15.16.2.3. By Refurbishing Type 15.17. Australia 15.17.1. Pricing Analysis 15.17.2. Market Share Analysis, 2022 15.17.2.1. By Fitting Type 15.17.2.2. By Aircraft Type 15.17.2.3. By Refurbishing Type 15.18. New Zealand 15.18.1. Pricing Analysis 15.18.2. Market Share Analysis, 2022 15.18.2.1. By Fitting Type 15.18.2.2. By Aircraft Type 15.18.2.3. By Refurbishing Type 15.19. GCC Countries 15.19.1. Pricing Analysis 15.19.2. Market Share Analysis, 2022 15.19.2.1. By Fitting Type 15.19.2.2. By Aircraft Type 15.19.2.3. By Refurbishing Type 15.20. South Africa 15.20.1. Pricing Analysis 15.20.2. Market Share Analysis, 2022 15.20.2.1. By Fitting Type 15.20.2.2. By Aircraft Type 15.20.2.3. By Refurbishing Type 16. Market Structure Analysis 16.1. Competition Dashboard 16.2. Competition Benchmarking 16.3. Market Share Analysis of Top Players 16.3.1. By Regional 16.3.2. By Fitting Type 16.3.3. By Aircraft Type 16.3.4. By Refurbishing Type 17. Competition Analysis 17.1. Competition Deep Dive 17.1.1. Diehl Shiftung & Co. KG 17.1.1.1. Overview 17.1.1.2. Product Portfolio 17.1.1.3. Profitability by Market Segments 17.1.1.4. Sales Footprint 17.1.1.5. Strategy Overview 17.1.1.5.1. Marketing Strategy 17.1.1.5.2. Product Strategy 17.1.1.5.3. Channel Strategy 17.1.2. Gulfstream Aerospace Ltd. 17.1.2.1. Overview 17.1.2.2. Product Portfolio 17.1.2.3. Profitability by Market Segments 17.1.2.4. Sales Footprint 17.1.2.5. Strategy Overview 17.1.2.5.1. Marketing Strategy 17.1.2.5.2. Product Strategy 17.1.2.5.3. Channel Strategy 17.1.3. Jamco America Inc. 17.1.3.1. Overview 17.1.3.2. Product Portfolio 17.1.3.3. Profitability by Market Segments 17.1.3.4. Sales Footprint 17.1.3.5. Strategy Overview 17.1.3.5.1. Marketing Strategy 17.1.3.5.2. Product Strategy 17.1.3.5.3. Channel Strategy 17.1.4. Hong Kong Aircraft Engineering Co. Ltd. 17.1.4.1. Overview 17.1.4.2. Product Portfolio 17.1.4.3. Profitability by Market Segments 17.1.4.4. Sales Footprint 17.1.4.5. Strategy Overview 17.1.4.5.1. Marketing Strategy 17.1.4.5.2. Product Strategy 17.1.4.5.3. Channel Strategy 17.1.5. Jet Aviation AG 17.1.5.1. Overview 17.1.5.2. Product Portfolio 17.1.5.3. Profitability by Market Segments 17.1.5.4. Sales Footprint 17.1.5.5. Strategy Overview 17.1.5.5.1. Marketing Strategy 17.1.5.5.2. Product Strategy 17.1.5.5.3. Channel Strategy 17.1.6. Lufthansa Technik AG 17.1.6.1. Overview 17.1.6.2. Product Portfolio 17.1.6.3. Profitability by Market Segments 17.1.6.4. Sales Footprint 17.1.6.5. Strategy Overview 17.1.6.5.1. Marketing Strategy 17.1.6.5.2. Product Strategy 17.1.6.5.3. Channel Strategy 17.1.7. Sabreliner Aviation LLC 17.1.7.1. Overview 17.1.7.2. Product Portfolio 17.1.7.3. Profitability by Market Segments 17.1.7.4. Sales Footprint 17.1.7.5. Strategy Overview 17.1.7.5.1. Marketing Strategy 17.1.7.5.2. Product Strategy 17.1.7.5.3. Channel Strategy 17.1.8. Raytheon Technologies 17.1.8.1. Overview 17.1.8.2. Product Portfolio 17.1.8.3. Profitability by Market Segments 17.1.8.4. Sales Footprint 17.1.8.5. Strategy Overview 17.1.8.5.1. Marketing Strategy 17.1.8.5.2. Product Strategy 17.1.8.5.3. Channel Strategy 17.1.9. SIA Engineering Co. Ltd 17.1.9.1. Overview 17.1.9.2. Product Portfolio 17.1.9.3. Profitability by Market Segments 17.1.9.4. Sales Footprint 17.1.9.5. Strategy Overview 17.1.9.5.1. Marketing Strategy 17.1.9.5.2. Product Strategy 17.1.9.5.3. Channel Strategy 17.1.10. Rose Aircraft Services 17.1.10.1. Overview 17.1.10.2. Product Portfolio 17.1.10.3. Profitability by Market Segments 17.1.10.4. Sales Footprint 17.1.10.5. Strategy Overview 17.1.10.5.1. Marketing Strategy 17.1.10.5.2. Product Strategy 17.1.10.5.3. Channel Strategy 17.1.11. Safran SA 17.1.11.1. Overview 17.1.11.2. Product Portfolio 17.1.11.3. Profitability by Market Segments 17.1.11.4. Sales Footprint 17.1.11.5. Strategy Overview 17.1.11.5.1. Marketing Strategy 17.1.11.5.2. Product Strategy 17.1.11.5.3. Channel Strategy 17.1.12. Nextant Aerospace 17.1.12.1. Overview 17.1.12.2. Product Portfolio 17.1.12.3. Profitability by Market Segments 17.1.12.4. Sales Footprint 17.1.12.5. Strategy Overview 17.1.12.5.1. Marketing Strategy 17.1.12.5.2. Product Strategy 17.1.12.5.3. Channel Strategy 17.1.13. AFI KLM E&M 17.1.13.1. Overview 17.1.13.2. Product Portfolio 17.1.13.3. Profitability by Market Segments 17.1.13.4. Sales Footprint 17.1.13.5. Strategy Overview 17.1.13.5.1. Marketing Strategy 17.1.13.5.2. Product Strategy 17.1.13.5.3. Channel Strategy 18. Assumptions & Acronyms Used 19. Research Methodology
Don't pay for what you don't need
Customize your report by selecting specific countries or regions and save 30%!
Table 1: Global Market Value (US$ million) Forecast by Region, 2017 to 2033 Table 2: Global Market Volume (Units) Forecast by Region, 2017 to 2033 Table 3: Global Market Value (US$ million) Forecast by Fitting Type, 2017 to 2033 Table 4: Global Market Volume (Units) Forecast by Fitting Type, 2017 to 2033 Table 5: Global Market Value (US$ million) Forecast by Aircraft Type, 2017 to 2033 Table 6: Global Market Volume (Units) Forecast by Aircraft Type, 2017 to 2033 Table 7: Global Market Value (US$ million) Forecast by Refurbishing Type, 2017 to 2033 Table 8: Global Market Volume (Units) Forecast by Refurbishing Type, 2017 to 2033 Table 9: North America Market Value (US$ million) Forecast by Country, 2017 to 2033 Table 10: North America Market Volume (Units) Forecast by Country, 2017 to 2033 Table 11: North America Market Value (US$ million) Forecast by Fitting Type, 2017 to 2033 Table 12: North America Market Volume (Units) Forecast by Fitting Type, 2017 to 2033 Table 13: North America Market Value (US$ million) Forecast by Aircraft Type, 2017 to 2033 Table 14: North America Market Volume (Units) Forecast by Aircraft Type, 2017 to 2033 Table 15: North America Market Value (US$ million) Forecast by Refurbishing Type, 2017 to 2033 Table 16: North America Market Volume (Units) Forecast by Refurbishing Type, 2017 to 2033 Table 17: Latin America Market Value (US$ million) Forecast by Country, 2017 to 2033 Table 18: Latin America Market Volume (Units) Forecast by Country, 2017 to 2033 Table 19: Latin America Market Value (US$ million) Forecast by Fitting Type, 2017 to 2033 Table 20: Latin America Market Volume (Units) Forecast by Fitting Type, 2017 to 2033 Table 21: Latin America Market Value (US$ million) Forecast by Aircraft Type, 2017 to 2033 Table 22: Latin America Market Volume (Units) Forecast by Aircraft Type, 2017 to 2033 Table 23: Latin America Market Value (US$ million) Forecast by Refurbishing Type, 2017 to 2033 Table 24: Latin America Market Volume (Units) Forecast by Refurbishing Type, 2017 to 2033 Table 25: Europe Market Value (US$ million) Forecast by Country, 2017 to 2033 Table 26: Europe Market Volume (Units) Forecast by Country, 2017 to 2033 Table 27: Europe Market Value (US$ million) Forecast by Fitting Type, 2017 to 2033 Table 28: Europe Market Volume (Units) Forecast by Fitting Type, 2017 to 2033 Table 29: Europe Market Value (US$ million) Forecast by Aircraft Type, 2017 to 2033 Table 30: Europe Market Volume (Units) Forecast by Aircraft Type, 2017 to 2033 Table 31: Europe Market Value (US$ million) Forecast by Refurbishing Type, 2017 to 2033 Table 32: Europe Market Volume (Units) Forecast by Refurbishing Type, 2017 to 2033 Table 33: East Asia Market Value (US$ million) Forecast by Country, 2017 to 2033 Table 34: East Asia Market Volume (Units) Forecast by Country, 2017 to 2033 Table 35: East Asia Market Value (US$ million) Forecast by Fitting Type, 2017 to 2033 Table 36: East Asia Market Volume (Units) Forecast by Fitting Type, 2017 to 2033 Table 37: East Asia Market Value (US$ million) Forecast by Aircraft Type, 2017 to 2033 Table 38: East Asia Market Volume (Units) Forecast by Aircraft Type, 2017 to 2033 Table 39: East Asia Market Value (US$ million) Forecast by Refurbishing Type, 2017 to 2033 Table 40: East Asia Market Volume (Units) Forecast by Refurbishing Type, 2017 to 2033 Table 41: South Asia & Pacific Market Value (US$ million) Forecast by Country, 2017 to 2033 Table 42: South Asia & Pacific Market Volume (Units) Forecast by Country, 2017 to 2033 Table 43: South Asia & Pacific Market Value (US$ million) Forecast by Fitting Type, 2017 to 2033 Table 44: South Asia & Pacific Market Volume (Units) Forecast by Fitting Type, 2017 to 2033 Table 45: South Asia & Pacific Market Value (US$ million) Forecast by Aircraft Type, 2017 to 2033 Table 46: South Asia & Pacific Market Volume (Units) Forecast by Aircraft Type, 2017 to 2033 Table 47: South Asia & Pacific Market Value (US$ million) Forecast by Refurbishing Type, 2017 to 2033 Table 48: South Asia & Pacific Market Volume (Units) Forecast by Refurbishing Type, 2017 to 2033 Table 49: MEA Market Value (US$ million) Forecast by Country, 2017 to 2033 Table 50: MEA Market Volume (Units) Forecast by Country, 2017 to 2033 Table 51: MEA Market Value (US$ million) Forecast by Fitting Type, 2017 to 2033 Table 52: MEA Market Volume (Units) Forecast by Fitting Type, 2017 to 2033 Table 53: MEA Market Value (US$ million) Forecast by Aircraft Type, 2017 to 2033 Table 54: MEA Market Volume (Units) Forecast by Aircraft Type, 2017 to 2033 Table 55: MEA Market Value (US$ million) Forecast by Refurbishing Type, 2017 to 2033 Table 56: MEA Market Volume (Units) Forecast by Refurbishing Type, 2017 to 2033
Figure 1: Global Market Value (US$ million) by Fitting Type, 2023 to 2033 Figure 2: Global Market Value (US$ million) by Aircraft Type, 2023 to 2033 Figure 3: Global Market Value (US$ million) by Refurbishing Type, 2023 to 2033 Figure 4: Global Market Value (US$ million) by Region, 2023 to 2033 Figure 5: Global Market Value (US$ million) Analysis by Region, 2017 to 2033 Figure 6: Global Market Volume (Units) Analysis by Region, 2017 to 2033 Figure 7: Global Market Value Share (%) and BPS Analysis by Region, 2023 to 2033 Figure 8: Global Market Y-o-Y Growth (%) Projections by Region, 2023 to 2033 Figure 9: Global Market Value (US$ million) Analysis by Fitting Type, 2017 to 2033 Figure 10: Global Market Volume (Units) Analysis by Fitting Type, 2017 to 2033 Figure 11: Global Market Value Share (%) and BPS Analysis by Fitting Type, 2023 to 2033 Figure 12: Global Market Y-o-Y Growth (%) Projections by Fitting Type, 2023 to 2033 Figure 13: Global Market Value (US$ million) Analysis by Aircraft Type, 2017 to 2033 Figure 14: Global Market Volume (Units) Analysis by Aircraft Type, 2017 to 2033 Figure 15: Global Market Value Share (%) and BPS Analysis by Aircraft Type, 2023 to 2033 Figure 16: Global Market Y-o-Y Growth (%) Projections by Aircraft Type, 2023 to 2033 Figure 17: Global Market Value (US$ million) Analysis by Refurbishing Type, 2017 to 2033 Figure 18: Global Market Volume (Units) Analysis by Refurbishing Type, 2017 to 2033 Figure 19: Global Market Value Share (%) and BPS Analysis by Refurbishing Type, 2023 to 2033 Figure 20: Global Market Y-o-Y Growth (%) Projections by Refurbishing Type, 2023 to 2033 Figure 21: Global Market Attractiveness by Fitting Type, 2023 to 2033 Figure 22: Global Market Attractiveness by Aircraft Type, 2023 to 2033 Figure 23: Global Market Attractiveness by Refurbishing Type, 2023 to 2033 Figure 24: Global Market Attractiveness by Region, 2023 to 2033 Figure 25: North America Market Value (US$ million) by Fitting Type, 2023 to 2033 Figure 26: North America Market Value (US$ million) by Aircraft Type, 2023 to 2033 Figure 27: North America Market Value (US$ million) by Refurbishing Type, 2023 to 2033 Figure 28: North America Market Value (US$ million) by Country, 2023 to 2033 Figure 29: North America Market Value (US$ million) Analysis by Country, 2017 to 2033 Figure 30: North America Market Volume (Units) Analysis by Country, 2017 to 2033 Figure 31: North America Market Value Share (%) and BPS Analysis by Country, 2023 to 2033 Figure 32: North America Market Y-o-Y Growth (%) Projections by Country, 2023 to 2033 Figure 33: North America Market Value (US$ million) Analysis by Fitting Type, 2017 to 2033 Figure 34: North America Market Volume (Units) Analysis by Fitting Type, 2017 to 2033 Figure 35: North America Market Value Share (%) and BPS Analysis by Fitting Type, 2023 to 2033 Figure 36: North America Market Y-o-Y Growth (%) Projections by Fitting Type, 2023 to 2033 Figure 37: North America Market Value (US$ million) Analysis by Aircraft Type, 2017 to 2033 Figure 38: North America Market Volume (Units) Analysis by Aircraft Type, 2017 to 2033 Figure 39: North America Market Value Share (%) and BPS Analysis by Aircraft Type, 2023 to 2033 Figure 40: North America Market Y-o-Y Growth (%) Projections by Aircraft Type, 2023 to 2033 Figure 41: North America Market Value (US$ million) Analysis by Refurbishing Type, 2017 to 2033 Figure 42: North America Market Volume (Units) Analysis by Refurbishing Type, 2017 to 2033 Figure 43: North America Market Value Share (%) and BPS Analysis by Refurbishing Type, 2023 to 2033 Figure 44: North America Market Y-o-Y Growth (%) Projections by Refurbishing Type, 2023 to 2033 Figure 45: North America Market Attractiveness by Fitting Type, 2023 to 2033 Figure 46: North America Market Attractiveness by Aircraft Type, 2023 to 2033 Figure 47: North America Market Attractiveness by Refurbishing Type, 2023 to 2033 Figure 48: North America Market Attractiveness by Country, 2023 to 2033 Figure 49: Latin America Market Value (US$ million) by Fitting Type, 2023 to 2033 Figure 50: Latin America Market Value (US$ million) by Aircraft Type, 2023 to 2033 Figure 51: Latin America Market Value (US$ million) by Refurbishing Type, 2023 to 2033 Figure 52: Latin America Market Value (US$ million) by Country, 2023 to 2033 Figure 53: Latin America Market Value (US$ million) Analysis by Country, 2017 to 2033 Figure 54: Latin America Market Volume (Units) Analysis by Country, 2017 to 2033 Figure 55: Latin America Market Value Share (%) and BPS Analysis by Country, 2023 to 2033 Figure 56: Latin America Market Y-o-Y Growth (%) Projections by Country, 2023 to 2033 Figure 57: Latin America Market Value (US$ million) Analysis by Fitting Type, 2017 to 2033 Figure 58: Latin America Market Volume (Units) Analysis by Fitting Type, 2017 to 2033 Figure 59: Latin America Market Value Share (%) and BPS Analysis by Fitting Type, 2023 to 2033 Figure 60: Latin America Market Y-o-Y Growth (%) Projections by Fitting Type, 2023 to 2033 Figure 61: Latin America Market Value (US$ million) Analysis by Aircraft Type, 2017 to 2033 Figure 62: Latin America Market Volume (Units) Analysis by Aircraft Type, 2017 to 2033 Figure 63: Latin America Market Value Share (%) and BPS Analysis by Aircraft Type, 2023 to 2033 Figure 64: Latin America Market Y-o-Y Growth (%) Projections by Aircraft Type, 2023 to 2033 Figure 65: Latin America Market Value (US$ million) Analysis by Refurbishing Type, 2017 to 2033 Figure 66: Latin America Market Volume (Units) Analysis by Refurbishing Type, 2017 to 2033 Figure 67: Latin America Market Value Share (%) and BPS Analysis by Refurbishing Type, 2023 to 2033 Figure 68: Latin America Market Y-o-Y Growth (%) Projections by Refurbishing Type, 2023 to 2033 Figure 69: Latin America Market Attractiveness by Fitting Type, 2023 to 2033 Figure 70: Latin America Market Attractiveness by Aircraft Type, 2023 to 2033 Figure 71: Latin America Market Attractiveness by Refurbishing Type, 2023 to 2033 Figure 72: Latin America Market Attractiveness by Country, 2023 to 2033 Figure 73: Europe Market Value (US$ million) by Fitting Type, 2023 to 2033 Figure 74: Europe Market Value (US$ million) by Aircraft Type, 2023 to 2033 Figure 75: Europe Market Value (US$ million) by Refurbishing Type, 2023 to 2033 Figure 76: Europe Market Value (US$ million) by Country, 2023 to 2033 Figure 77: Europe Market Value (US$ million) Analysis by Country, 2017 to 2033 Figure 78: Europe Market Volume (Units) Analysis by Country, 2017 to 2033 Figure 79: Europe Market Value Share (%) and BPS Analysis by Country, 2023 to 2033 Figure 80: Europe Market Y-o-Y Growth (%) Projections by Country, 2023 to 2033 Figure 81: Europe Market Value (US$ million) Analysis by Fitting Type, 2017 to 2033 Figure 82: Europe Market Volume (Units) Analysis by Fitting Type, 2017 to 2033 Figure 83: Europe Market Value Share (%) and BPS Analysis by Fitting Type, 2023 to 2033 Figure 84: Europe Market Y-o-Y Growth (%) Projections by Fitting Type, 2023 to 2033 Figure 85: Europe Market Value (US$ million) Analysis by Aircraft Type, 2017 to 2033 Figure 86: Europe Market Volume (Units) Analysis by Aircraft Type, 2017 to 2033 Figure 87: Europe Market Value Share (%) and BPS Analysis by Aircraft Type, 2023 to 2033 Figure 88: Europe Market Y-o-Y Growth (%) Projections by Aircraft Type, 2023 to 2033 Figure 89: Europe Market Value (US$ million) Analysis by Refurbishing Type, 2017 to 2033 Figure 90: Europe Market Volume (Units) Analysis by Refurbishing Type, 2017 to 2033 Figure 91: Europe Market Value Share (%) and BPS Analysis by Refurbishing Type, 2023 to 2033 Figure 92: Europe Market Y-o-Y Growth (%) Projections by Refurbishing Type, 2023 to 2033 Figure 93: Europe Market Attractiveness by Fitting Type, 2023 to 2033 Figure 94: Europe Market Attractiveness by Aircraft Type, 2023 to 2033 Figure 95: Europe Market Attractiveness by Refurbishing Type, 2023 to 2033 Figure 96: Europe Market Attractiveness by Country, 2023 to 2033 Figure 97: East Asia Market Value (US$ million) by Fitting Type, 2023 to 2033 Figure 98: East Asia Market Value (US$ million) by Aircraft Type, 2023 to 2033 Figure 99: East Asia Market Value (US$ million) by Refurbishing Type, 2023 to 2033 Figure 100: East Asia Market Value (US$ million) by Country, 2023 to 2033 Figure 101: East Asia Market Value (US$ million) Analysis by Country, 2017 to 2033 Figure 102: East Asia Market Volume (Units) Analysis by Country, 2017 to 2033 Figure 103: East Asia Market Value Share (%) and BPS Analysis by Country, 2023 to 2033 Figure 104: East Asia Market Y-o-Y Growth (%) Projections by Country, 2023 to 2033 Figure 105: East Asia Market Value (US$ million) Analysis by Fitting Type, 2017 to 2033 Figure 106: East Asia Market Volume (Units) Analysis by Fitting Type, 2017 to 2033 Figure 107: East Asia Market Value Share (%) and BPS Analysis by Fitting Type, 2023 to 2033 Figure 108: East Asia Market Y-o-Y Growth (%) Projections by Fitting Type, 2023 to 2033 Figure 109: East Asia Market Value (US$ million) Analysis by Aircraft Type, 2017 to 2033 Figure 110: East Asia Market Volume (Units) Analysis by Aircraft Type, 2017 to 2033 Figure 111: East Asia Market Value Share (%) and BPS Analysis by Aircraft Type, 2023 to 2033 Figure 112: East Asia Market Y-o-Y Growth (%) Projections by Aircraft Type, 2023 to 2033 Figure 113: East Asia Market Value (US$ million) Analysis by Refurbishing Type, 2017 to 2033 Figure 114: East Asia Market Volume (Units) Analysis by Refurbishing Type, 2017 to 2033 Figure 115: East Asia Market Value Share (%) and BPS Analysis by Refurbishing Type, 2023 to 2033 Figure 116: East Asia Market Y-o-Y Growth (%) Projections by Refurbishing Type, 2023 to 2033 Figure 117: East Asia Market Attractiveness by Fitting Type, 2023 to 2033 Figure 118: East Asia Market Attractiveness by Aircraft Type, 2023 to 2033 Figure 119: East Asia Market Attractiveness by Refurbishing Type, 2023 to 2033 Figure 120: East Asia Market Attractiveness by Country, 2023 to 2033 Figure 121: South Asia & Pacific Market Value (US$ million) by Fitting Type, 2023 to 2033 Figure 122: South Asia & Pacific Market Value (US$ million) by Aircraft Type, 2023 to 2033 Figure 123: South Asia & Pacific Market Value (US$ million) by Refurbishing Type, 2023 to 2033 Figure 124: South Asia & Pacific Market Value (US$ million) by Country, 2023 to 2033 Figure 125: South Asia & Pacific Market Value (US$ million) Analysis by Country, 2017 to 2033 Figure 126: South Asia & Pacific Market Volume (Units) Analysis by Country, 2017 to 2033 Figure 127: South Asia & Pacific Market Value Share (%) and BPS Analysis by Country, 2023 to 2033 Figure 128: South Asia & Pacific Market Y-o-Y Growth (%) Projections by Country, 2023 to 2033 Figure 129: South Asia & Pacific Market Value (US$ million) Analysis by Fitting Type, 2017 to 2033 Figure 130: South Asia & Pacific Market Volume (Units) Analysis by Fitting Type, 2017 to 2033 Figure 131: South Asia & Pacific Market Value Share (%) and BPS Analysis by Fitting Type, 2023 to 2033 Figure 132: South Asia & Pacific Market Y-o-Y Growth (%) Projections by Fitting Type, 2023 to 2033 Figure 133: South Asia & Pacific Market Value (US$ million) Analysis by Aircraft Type, 2017 to 2033 Figure 134: South Asia & Pacific Market Volume (Units) Analysis by Aircraft Type, 2017 to 2033 Figure 135: South Asia & Pacific Market Value Share (%) and BPS Analysis by Aircraft Type, 2023 to 2033 Figure 136: South Asia & Pacific Market Y-o-Y Growth (%) Projections by Aircraft Type, 2023 to 2033 Figure 137: South Asia & Pacific Market Value (US$ million) Analysis by Refurbishing Type, 2017 to 2033 Figure 138: South Asia & Pacific Market Volume (Units) Analysis by Refurbishing Type, 2017 to 2033 Figure 139: South Asia & Pacific Market Value Share (%) and BPS Analysis by Refurbishing Type, 2023 to 2033 Figure 140: South Asia & Pacific Market Y-o-Y Growth (%) Projections by Refurbishing Type, 2023 to 2033 Figure 141: South Asia & Pacific Market Attractiveness by Fitting Type, 2023 to 2033 Figure 142: South Asia & Pacific Market Attractiveness by Aircraft Type, 2023 to 2033 Figure 143: South Asia & Pacific Market Attractiveness by Refurbishing Type, 2023 to 2033 Figure 144: South Asia & Pacific Market Attractiveness by Country, 2023 to 2033 Figure 145: MEA Market Value (US$ million) by Fitting Type, 2023 to 2033 Figure 146: MEA Market Value (US$ million) by Aircraft Type, 2023 to 2033 Figure 147: MEA Market Value (US$ million) by Refurbishing Type, 2023 to 2033 Figure 148: MEA Market Value (US$ million) by Country, 2023 to 2033 Figure 149: MEA Market Value (US$ million) Analysis by Country, 2017 to 2033 Figure 150: MEA Market Volume (Units) Analysis by Country, 2017 to 2033 Figure 151: MEA Market Value Share (%) and BPS Analysis by Country, 2023 to 2033 Figure 152: MEA Market Y-o-Y Growth (%) Projections by Country, 2023 to 2033 Figure 153: MEA Market Value (US$ million) Analysis by Fitting Type, 2017 to 2033 Figure 154: MEA Market Volume (Units) Analysis by Fitting Type, 2017 to 2033 Figure 155: MEA Market Value Share (%) and BPS Analysis by Fitting Type, 2023 to 2033 Figure 156: MEA Market Y-o-Y Growth (%) Projections by Fitting Type, 2023 to 2033 Figure 157: MEA Market Value (US$ million) Analysis by Aircraft Type, 2017 to 2033 Figure 158: MEA Market Volume (Units) Analysis by Aircraft Type, 2017 to 2033 Figure 159: MEA Market Value Share (%) and BPS Analysis by Aircraft Type, 2023 to 2033 Figure 160: MEA Market Y-o-Y Growth (%) Projections by Aircraft Type, 2023 to 2033 Figure 161: MEA Market Value (US$ million) Analysis by Refurbishing Type, 2017 to 2033 Figure 162: MEA Market Volume (Units) Analysis by Refurbishing Type, 2017 to 2033 Figure 163: MEA Market Value Share (%) and BPS Analysis by Refurbishing Type, 2023 to 2033 Figure 164: MEA Market Y-o-Y Growth (%) Projections by Refurbishing Type, 2023 to 2033 Figure 165: MEA Market Attractiveness by Fitting Type, 2023 to 2033 Figure 166: MEA Market Attractiveness by Aircraft Type, 2023 to 2033 Figure 167: MEA Market Attractiveness by Refurbishing Type, 2023 to 2033 Figure 168: MEA Market Attractiveness by Country, 2023 to 2033
Recommendations
Explore Automotive Insights
View Reports