Membrane Boxes Market
Market Insights on Membrane Boxes covering sales outlook, demand forecast & up-to-date key trends
Membrane Boxes Market by Product Type, Application, Shape & Region - Forecast 2022 – 2032
Membrane Boxes Market Snapshot (2022-2032)
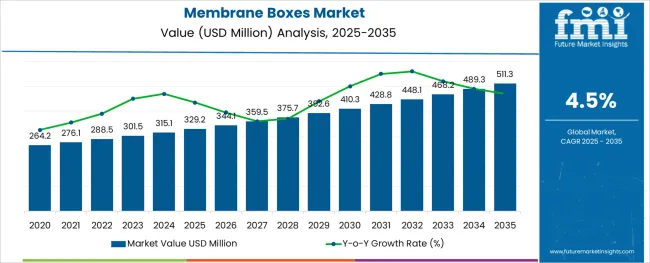
[304 Pages Report] The global membrane boxes market size is expected to reach US$ 410.3 Million in 2032. The membrane boxes market is growing rapidly.
As per FMI Analysts, the global Membrane boxes market is estimated to be valued at US$ 264.2 Million in 2022 and is projected to increase at a CAGR of 4.5% in the forecast period from 2022 to 2032.
Report Attribute |
Details |
Membrane Boxes Market Estimated Base Year Value (2021) |
US$ 252.82 Million |
Membrane Boxes Market Expected Market Value (2022) |
US$ 264.2 Million |
Membrane Boxes Market Anticipated Forecast Value (2032) |
US$ 410.3 Million |
Membrane Boxes Market Projected Growth Rate (2022-2032) |
4.5% CAGR |
The membrane boxes market encounters difficulties related to government policy and regulations pertaining to the environmental issue of disposing of plastic waste, which can adversely affect the market for membrane boxes. Direct printing on membrane boxes is not possible, which can negatively impact sales of membrane boxes.
In addition to their properties, which include thin and highly elastic films inside membrane boxes, which can keep delicate objects stable, are the key factors expediting the growth of the membrane boxes market at an elevated rate. Customers make purchasing decisions based on the quality of the product, but packaging also plays an incredibly important role in determining how durable the product is.
Throughout the world, the consumer packaging market has undergone a significant transformation in recent years, increasing the demand for supreme customization in packaging formulation and design. Public perceptions about the lifestyles of emerging economies around the world have influenced their desire for membrane boxes, creating new opportunities for the membrane boxes market.
In addition to this, it is observed that the rising disposable income of developing countries are a major factor contributing to the dynamic growth of the membrane boxes market. In addition to this, recent innovations in consumer packaging are also contributing to the demand for membrane boxes globally.
Membrane boxes face a number of challenges relating to direct-to-substrate printing, which unfortunately is not possible on membrane boxes, which in turn may pose a serious threat to the sales of membrane boxes. In addition, the market for membrane boxes is faced with stringent government policies related to disposing of plastic waste.
Over the next few years, the membrane boxes market is expected to grow at an above average rate, particularly in North America. By region, Western Europe and Eastern Europe are also expected to experience an above average growth of membrane boxes market for following years.
Currently, Germany, Italy, the UK, and France are the biggest markets for membrane boxes. The market for membrane boxes is expected to grow the fastest over the next five years in the Asia-Pacific region excluding Japan due to the strong retail industry growth and technological advancement of India and China.
A strategy to increase the market share of membrane boxes is to introduce them as a means of storing large objects or devices with an irregular shape to gain a competitive edge. INDU-COR HD is an advanced membrane technology developed by KOCH Separation Solutions to treat industrial waste streams efficiently. This new product configuration has a 300% higher packing density than standard INDU-COR, improving crossflow filtration efficiency for clients while decreasing environmental impact and operating costs.
Don't pay for what you don't need
Customize your report by selecting specific countries or regions and save 30%!
What are the Various Factors Driving the Membrane Boxes Market?
The membrane boxes market has received a lot of traction in the industry.
Membrane boxes face a number of challenges relating to direct-to-substrate printing, which unfortunately is not possible on membrane boxes, which in turn may pose a serious threat to sales of membrane boxes. In addition, the market for membrane boxes is faced with stringent government policies related to disposing of plastic waste.
Several factors such as thin, highly elastic films inside membrane boxes that can keep any delicate object stable are contributing to the growing market and expected to continue over the forecast period. Customers make buying decisions for the quality of the product, but packaging plays a major role in the membrane boxes lifespan.
As consumer packaging markets have evolved over the past few years, customers have progressively sought out more customized packaging formulations and designs. A significant change in lifestyles and conveniences of consumers in emerging economies has greatly contributed to the growth potential for membrane boxes.
Furthermore, the growing disposable incomes of developing countries are key contributors to the dynamic growth of membrane box markets globally. Additionally, the rapid industrialization of several countries and the advent of recent innovations within the consumer packaging industry are other factors fueling global demand for membrane boxes.
Among the challenges facing membrane boxes are the use of direct-to-substrate printing, which is not possible on membrane boxes, and it can negatively impact membrane boxes sales. Furthermore, the market for membrane boxes faces challenges associated with stringent government policies and regulations in hand with environmental concerns for the disposal of plastic waste.
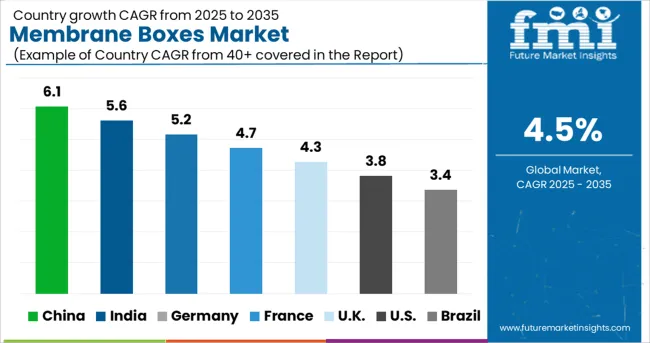
What is Regional Analysis of Membrane Boxes Market Share?
It is estimated that membrane boxes market is expected to grow at a higher-than-average rate for the forecast period. North America is the leading region for membrane boxes and its demand is fueling the membrane boxes market. Western Europe and Eastern Europe will also witness higher than average growth of membrane boxes market for the remaining years.
Membrane boxes have the largest markets in Germany, Italy, the UK, and France. However, it is expected that Asia-Pacific excluding Japan will have the highest growth over the forecast period for membrane boxes. The growth for the retail industry and development of technology in India and China will help these emerging economies to dominate the global membrane box market.
Asia-Pacific excluding Japan is also predicted to have a positive impact on the membrane boxes market as disposable income levels rise. The Middle East and Africa region are also projected to see a substantial increase in the membrane boxes market, with countries such as the Gulf Compact Community and South Africa. Japan is additionally forecast to have a positive impact on the membrane boxes market.
Find your sweet spots for generating winning opportunities in this market.
Talk to AnalystWhat is the Competition Landscape in the Membrane Boxes Market?
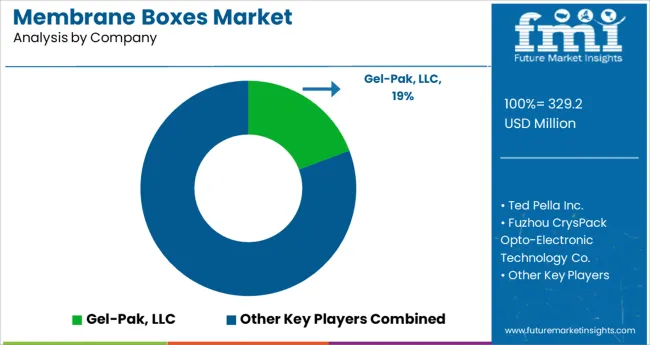
Some of the leading companies operating in the global membrane boxes market include Gel-Pak, LLC, Ted Pella Inc., Fuzhou CrysPack Opto-Electronic Technology Co., Ltd, Structure Probe, Inc., Tiger's Plastics, Inc.,Hager & Werken GmbH & Co. KG, UrCooker Industrial Co., Ltd., Ningbo Hinix Hardware Industry & Trade Co., Ltd., Maxbourne Industrial Co., Ltd., WEISHENG Commodity & Package Co., Ltd., etc.
As part of a push toward a competitive advantage, manufacturers are producing membrane boxes which can store large objects or devices with an irregular shape in order to increase the number of new consumers.
Synder has announced the opening of its new sales office in Vacaville, California, where the Technical Sales Team and Project Engineers will operate out of a 2600 square foot office space. This office facility is located within a 53,000 square foot research and development facility, as well as fabrication and production facilities.
The newly introduced INDU-COR HD (High Density) technology was announced by KOCH Separation Solutions, which has been developed for treating industrial waste streams efficiently. With a 300% higher packing density than standard INDU-COR, this new product configuration reduces costs, while improving performance.
Report Scope
Report Attribute |
Details |
Growth Rate |
CAGR of 4.5% from 2022 to 2032 |
Base Year for Estimation |
2021 |
Historical Data |
2015-2021 |
Forecast Period |
2022-2032 |
Quantitative Units |
Revenue in USD Million, Volume in Kilotons and CAGR from 2022-2032 |
Report Coverage |
Revenue Forecast, Volume Forecast, Company Ranking, Competitive Landscape, Growth Factors, Trends and Pricing Analysis |
Segments Covered |
|
Regions Covered |
|
Key Countries Profiled |
|
Key Companies Profiled |
|
Customization |
Available Upon Request |
Get the data you need at a Fraction of the cost
Personalize your report by choosing insights you need
and save 40%!
Key Segments Profiled in the Membrane Boxes Market
By Product Type:
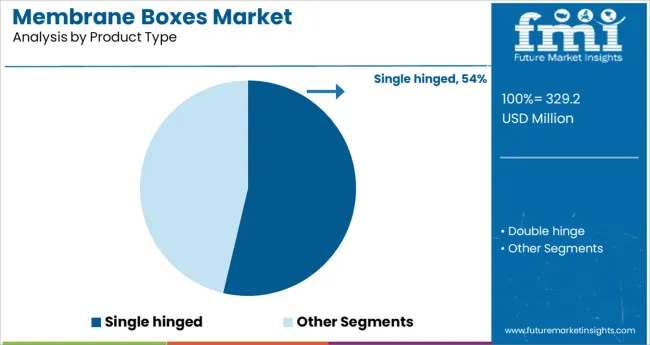
- Single hinged
- Double hinge
By Application:
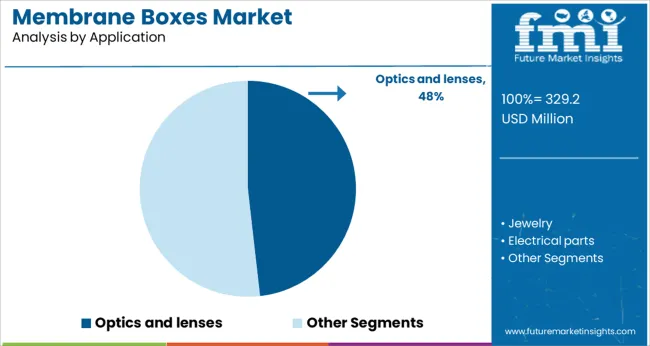
- Optics and lenses
- Jewelry
- Electrical parts
- Others
By Shape:
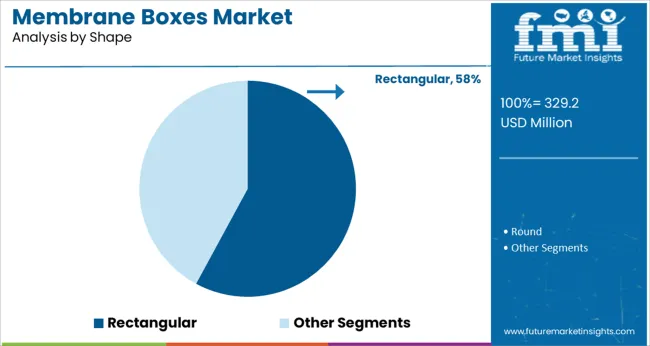
- Round
- Rectangular
By Region:
- North America
- Latin America
- Western Europe
- Eastern Europe
- Asia-Pacific
- Japan
- Middle East and Africa
Frequently Asked Questions
At What Rate will the Membrane Boxes Market Grow?
The global membrane boxes market is set to exceed US$ 410.3 Million in 2032.
Which Region is set to Lead the Membrane Boxes Market?
The U.S. is projected to lead the membrane boxes market in the forecast period.
Which are some of the Renowned Companies in the Membrane Boxes Market?
Gel-Pak, LLC, Ted Pella Inc., Fuzhou CrysPack Opto-Electronic Technology Co., Ltd., and others are some of the renowned companies in the membrane boxes market.
Table of Content
1. Executive Summary 1.1. Global Market Outlook 1.2. Demand-side Trends 1.3. Supply-side Trends 1.4. Technology Roadmap Analysis 1.5. Analysis and Recommendations 2. Market Overview 2.1. Market Coverage / Taxonomy 2.2. Market Definition / Scope / Limitations 3. Market Background 3.1. Market Dynamics 3.1.1. Drivers 3.1.2. Restraints 3.1.3. Opportunity 3.1.4. Trends 3.2. Scenario Forecast 3.2.1. Demand in Optimistic Scenario 3.2.2. Demand in Likely Scenario 3.2.3. Demand in Conservative Scenario 3.3. Opportunity Map Analysis 3.4. Product Life Cycle Analysis 3.5. Supply Chain Analysis 3.5.1. Supply Side Participants and their Roles 3.5.1.1. Producers 3.5.1.2. Mid-Level Participants (Traders/ Agents/ Brokers) 3.5.1.3. Wholesalers and Distributors 3.5.2. Value Added and Value Created at Node in the Supply Chain 3.5.3. List of Raw Material Suppliers 3.5.4. List of Existing and Potential Buyer’s 3.6. Investment Feasibility Matrix 3.7. Value Chain Analysis 3.7.1. Profit Margin Analysis 3.7.2. Wholesalers and Distributors 3.7.3. Retailers 3.8. PESTLE and Porter’s Analysis 3.9. Regulatory Landscape 3.9.1. By Key Regions 3.9.2. By Key Countries 3.10. Regional Parent Market Outlook 3.11. Production and Consumption Statistics 3.12. Import and Export Statistics 4. Global Membrane Boxes Market Analysis 2017-2021 and Forecast, 2022-2032 4.1. Historical Market Size Value (US$ Mn) & Volume (Units) Analysis, 2017-2021 4.2. Current and Future Market Size Value (US$ Mn) & Volume (Units) Projections, 2022-2032 4.2.1. Y-o-Y Growth Trend Analysis 4.2.2. Absolute $ Opportunity Analysis 5. Global Membrane Boxes Market Analysis 2017-2021 and Forecast 2022-2032, By Product Type 5.1. Introduction / Key Findings 5.2. Historical Market Size Value (US$ Mn) & Volume (Units) Analysis By Product Type, 2017-2021 5.3. Current and Future Market Size Value (US$ Mn) & Volume (Units) Analysis and Forecast By Product Type, 2022-2032 5.3.1. Single Hinged 5.3.2. Double Hinged 5.4. Y-o-Y Growth Trend Analysis By Product Type, 2017-2021 5.5. Absolute $ Opportunity Analysis By Product Type, 2022-2032 6. Global Membrane Boxes Market Analysis 2017-2021 and Forecast 2022-2032, By Application 6.1. Introduction / Key Findings 6.2. Historical Market Size Value (US$ Mn) & Volume (Units) Analysis By Application, 2017-2021 6.3. Current and Future Market Size Value (US$ Mn) & Volume (Units) Analysis and Forecast By Application, 2022-2032 6.3.1. Optics and Lenses 6.3.2. Jewelry 6.3.3. Electrical Parts 6.3.4. Others 6.4. Y-o-Y Growth Trend Analysis By Application, 2017-2021 6.5. Absolute $ Opportunity Analysis By Application, 2022-2032 7. Global Membrane Boxes Market Analysis 2017-2021 and Forecast 2022-2032, By Shape 7.1. Introduction / Key Findings 7.2. Historical Market Size Value (US$ Mn) & Volume (Units) Analysis By Shape, 2017-2021 7.3. Current and Future Market Size Value (US$ Mn) & Volume (Units) Analysis and Forecast By Shape, 2022-2032 7.3.1. Round 7.3.2. Rectangular 7.4. Y-o-Y Growth Trend Analysis By Shape, 2017-2021 7.5. Absolute $ Opportunity Analysis By Shape, 2022-2032 8. Global Membrane Boxes Market Analysis 2017-2021 and Forecast 2022-2032, By Region 8.1. Introduction 8.2. Historical Market Size Value (US$ Mn) & Volume (Units) Analysis By Region, 2017-2021 8.3. Current Market Size Value (US$ Mn) & Volume (Units) Analysis and Forecast By Region, 2022-2032 8.3.1. North America 8.3.2. Latin America 8.3.3. Europe 8.3.4. Asia Pacific 8.3.5. MEA 8.4. Market Attractiveness Analysis By Region 9. North America Membrane Boxes Market Analysis 2017-2021 and Forecast 2022-2032, By Country 9.1. Historical Market Size Value (US$ Mn) & Volume (Units) Trend Analysis By Market Taxonomy, 2017-2021 9.2. Market Size Value (US$ Mn) & Volume (Units) Forecast By Market Taxonomy, 2022-2032 9.2.1. By Country 9.2.1.1. U.S. 9.2.1.2. Canada 9.2.2. By Product Type 9.2.3. By Application 9.2.4. By Shape 9.3. Market Attractiveness Analysis 9.3.1. By Country 9.3.2. By Product Type 9.3.3. By Application 9.3.4. By Shape 9.4. Key Takeaways 10. Latin America Membrane Boxes Market Analysis 2017-2021 and Forecast 2022-2032, By Country 10.1. Historical Market Size Value (US$ Mn) & Volume (Units) Trend Analysis By Market Taxonomy, 2017-2021 10.2. Market Size Value (US$ Mn) & Volume (Units) Forecast By Market Taxonomy, 2022-2032 10.2.1. By Country 10.2.1.1. Brazil 10.2.1.2. Mexico 10.2.1.3. Rest of Latin America 10.2.2. By Product Type 10.2.3. By Application 10.2.4. By Shape 10.3. Market Attractiveness Analysis 10.3.1. By Country 10.3.2. By Product Type 10.3.3. By Application 10.3.4. By Shape 10.4. Key Takeaways 11. Europe Membrane Boxes Market Analysis 2017-2021 and Forecast 2022-2032, By Country 11.1. Historical Market Size Value (US$ Mn) & Volume (Units) Trend Analysis By Market Taxonomy, 2017-2021 11.2. Market Size Value (US$ Mn) & Volume (Units) Forecast By Market Taxonomy, 2022-2032 11.2.1. By Country 11.2.1.1. Germany 11.2.1.2. U.K. 11.2.1.3. France 11.2.1.4. Spain 11.2.1.5. Italy 11.2.1.6. Rest of Europe 11.2.2. By Product Type 11.2.3. By Application 11.2.4. By Shape 11.3. Market Attractiveness Analysis 11.3.1. By Country 11.3.2. By Product Type 11.3.3. By Application 11.3.4. By Shape 11.4. Key Takeaways 12. Asia Pacific Membrane Boxes Market Analysis 2017-2021 and Forecast 2022-2032, By Country 12.1. Historical Market Size Value (US$ Mn) & Volume (Units) Trend Analysis By Market Taxonomy, 2017-2021 12.2. Market Size Value (US$ Mn) & Volume (Units) Forecast By Market Taxonomy, 2022-2032 12.2.1. By Country 12.2.1.1. China 12.2.1.2. Japan 12.2.1.3. South Korea 12.2.1.4. Malaysia 12.2.1.5. Singapore 12.2.1.6. Australia 12.2.1.7. New Zealand 12.2.1.8. Rest of APAC 12.2.2. By Product Type 12.2.3. By Application 12.2.4. By Shape 12.3. Market Attractiveness Analysis 12.3.1. By Country 12.3.2. By Product Type 12.3.3. By Application 12.3.4. By Shape 12.4. Key Takeaways 13. MEA Membrane Boxes Market Analysis 2017-2021 and Forecast 2022-2032, By Country 13.1. Historical Market Size Value (US$ Mn) & Volume (Units) Trend Analysis By Market Taxonomy, 2017-2021 13.2. Market Size Value (US$ Mn) & Volume (Units) Forecast By Market Taxonomy, 2022-2032 13.2.1. By Country 13.2.1.1. GCC Countries 13.2.1.2. South Africa 13.2.1.3. Israel 13.2.1.4. Rest of MEA 13.2.2. By Product Type 13.2.3. By Application 13.2.4. By Shape 13.3. Market Attractiveness Analysis 13.3.1. By Country 13.3.2. By Product Type 13.3.3. By Application 13.3.4. By Shape 13.4. Key Takeaways 14. Key Countries Membrane Boxes Market Analysis 14.1. U.S. 14.1.1. Pricing Analysis 14.1.2. Market Share Analysis, 2021 14.1.2.1. By Product Type 14.1.2.2. By Application 14.1.2.3. By Shape 14.2. Canada 14.2.1. Pricing Analysis 14.2.2. Market Share Analysis, 2021 14.2.2.1. By Product Type 14.2.2.2. By Application 14.2.2.3. By Shape 14.3. Brazil 14.3.1. Pricing Analysis 14.3.2. Market Share Analysis, 2021 14.3.2.1. By Product Type 14.3.2.2. By Application 14.3.2.3. By Shape 14.4. Mexico 14.4.1. Pricing Analysis 14.4.2. Market Share Analysis, 2021 14.4.2.1. By Product Type 14.4.2.2. By Application 14.4.2.3. By Shape 14.5. Germany 14.5.1. Pricing Analysis 14.5.2. Market Share Analysis, 2021 14.5.2.1. By Product Type 14.5.2.2. By Application 14.5.2.3. By Shape 14.6. U.K. 14.6.1. Pricing Analysis 14.6.2. Market Share Analysis, 2021 14.6.2.1. By Product Type 14.6.2.2. By Application 14.6.2.3. By Shape 14.7. France 14.7.1. Pricing Analysis 14.7.2. Market Share Analysis, 2021 14.7.2.1. By Product Type 14.7.2.2. By Application 14.7.2.3. By Shape 14.8. Spain 14.8.1. Pricing Analysis 14.8.2. Market Share Analysis, 2021 14.8.2.1. By Product Type 14.8.2.2. By Application 14.8.2.3. By Shape 14.9. Italy 14.9.1. Pricing Analysis 14.9.2. Market Share Analysis, 2021 14.9.2.1. By Product Type 14.9.2.2. By Application 14.9.2.3. By Shape 14.10. China 14.10.1. Pricing Analysis 14.10.2. Market Share Analysis, 2021 14.10.2.1. By Product Type 14.10.2.2. By Application 14.10.2.3. By Shape 14.11. Japan 14.11.1. Pricing Analysis 14.11.2. Market Share Analysis, 2021 14.11.2.1. By Product Type 14.11.2.2. By Application 14.11.2.3. By Shape 14.12. South Korea 14.12.1. Pricing Analysis 14.12.2. Market Share Analysis, 2021 14.12.2.1. By Product Type 14.12.2.2. By Application 14.12.2.3. By Shape 14.13. Malaysia 14.13.1. Pricing Analysis 14.13.2. Market Share Analysis, 2021 14.13.2.1. By Product Type 14.13.2.2. By Application 14.13.2.3. By Shape 14.14. Singapore 14.14.1. Pricing Analysis 14.14.2. Market Share Analysis, 2021 14.14.2.1. By Product Type 14.14.2.2. By Application 14.14.2.3. By Shape 14.15. Australia 14.15.1. Pricing Analysis 14.15.2. Market Share Analysis, 2021 14.15.2.1. By Product Type 14.15.2.2. By Application 14.15.2.3. By Shape 14.16. New Zealand 14.16.1. Pricing Analysis 14.16.2. Market Share Analysis, 2021 14.16.2.1. By Product Type 14.16.2.2. By Application 14.16.2.3. By Shape 14.17. GCC Countries 14.17.1. Pricing Analysis 14.17.2. Market Share Analysis, 2021 14.17.2.1. By Product Type 14.17.2.2. By Application 14.17.2.3. By Shape 14.18. South Africa 14.18.1. Pricing Analysis 14.18.2. Market Share Analysis, 2021 14.18.2.1. By Product Type 14.18.2.2. By Application 14.18.2.3. By Shape 14.19. Israel 14.19.1. Pricing Analysis 14.19.2. Market Share Analysis, 2021 14.19.2.1. By Product Type 14.19.2.2. By Application 14.19.2.3. By Shape 15. Market Structure Analysis 15.1. Competition Dashboard 15.2. Competition Benchmarking 15.3. Market Share Analysis of Top Players 15.3.1. By Regional 15.3.2. By Product Type 15.3.3. By Application 15.3.4. By Shape 16. Competition Analysis 16.1. Competition Deep Dive 16.1.1. Gel-Pak, LLC 16.1.1.1. Overview 16.1.1.2. Product Portfolio 16.1.1.3. Profitability by Market Segments 16.1.1.4. Sales Footprint 16.1.1.5. Strategy Overview 16.1.1.5.1. Marketing Strategy 16.1.1.5.2. Product Strategy 16.1.1.5.3. Channel Strategy 16.1.2. Ted Pella Inc. 16.1.2.1. Overview 16.1.2.2. Product Portfolio 16.1.2.3. Profitability by Market Segments 16.1.2.4. Sales Footprint 16.1.2.5. Strategy Overview 16.1.2.5.1. Marketing Strategy 16.1.2.5.2. Product Strategy 16.1.2.5.3. Channel Strategy 16.1.3. Fuzhou CrysPack Opto-Electronic Technology Co. 16.1.3.1. Overview 16.1.3.2. Product Portfolio 16.1.3.3. Profitability by Market Segments 16.1.3.4. Sales Footprint 16.1.3.5. Strategy Overview 16.1.3.5.1. Marketing Strategy 16.1.3.5.2. Product Strategy 16.1.3.5.3. Channel Strategy 16.1.4. Structure Probe 16.1.4.1. Overview 16.1.4.2. Product Portfolio 16.1.4.3. Profitability by Market Segments 16.1.4.4. Sales Footprint 16.1.4.5. Strategy Overview 16.1.4.5.1. Marketing Strategy 16.1.4.5.2. Product Strategy 16.1.4.5.3. Channel Strategy 16.1.5. Tiger's Plastics, Inc. 16.1.5.1. Overview 16.1.5.2. Product Portfolio 16.1.5.3. Profitability by Market Segments 16.1.5.4. Sales Footprint 16.1.5.5. Strategy Overview 16.1.5.5.1. Marketing Strategy 16.1.5.5.2. Product Strategy 16.1.5.5.3. Channel Strategy 16.1.6. Hager & Werken GmbH & Co. KG 16.1.6.1. Overview 16.1.6.2. Product Portfolio 16.1.6.3. Profitability by Market Segments 16.1.6.4. Sales Footprint 16.1.6.5. Strategy Overview 16.1.6.5.1. Marketing Strategy 16.1.6.5.2. Product Strategy 16.1.6.5.3. Channel Strategy 16.1.7. UrCooker Industrial Co. 16.1.7.1. Overview 16.1.7.2. Product Portfolio 16.1.7.3. Profitability by Market Segments 16.1.7.4. Sales Footprint 16.1.7.5. Strategy Overview 16.1.7.5.1. Marketing Strategy 16.1.7.5.2. Product Strategy 16.1.7.5.3. Channel Strategy 16.1.8. Ningbo Hinix Hardware Industry & Trade Co., Ltd. 16.1.8.1. Overview 16.1.8.2. Product Portfolio 16.1.8.3. Profitability by Market Segments 16.1.8.4. Sales Footprint 16.1.8.5. Strategy Overview 16.1.8.5.1. Marketing Strategy 16.1.8.5.2. Product Strategy 16.1.8.5.3. Channel Strategy 16.1.9. Maxbourne Industrial Co., Ltd. 16.1.9.1. Overview 16.1.9.2. Product Portfolio 16.1.9.3. Profitability by Market Segments 16.1.9.4. Sales Footprint 16.1.9.5. Strategy Overview 16.1.9.5.1. Marketing Strategy 16.1.9.5.2. Product Strategy 16.1.9.5.3. Channel Strategy 16.1.10. WEISHENG Commodity & Package Co., Ltd. 16.1.10.1. Overview 16.1.10.2. Product Portfolio 16.1.10.3. Profitability by Market Segments 16.1.10.4. Sales Footprint 16.1.10.5. Strategy Overview 16.1.10.5.1. Marketing Strategy 16.1.10.5.2. Product Strategy 16.1.10.5.3. Channel Strategy 17. Assumptions & Acronyms Used 18. Research Methodology
Don't pay for what you don't need
Customize your report by selecting specific countries or regions and save 30%!
List of Tables
Table 1: Global Membrane Boxes Market Value (US$ Mn) Forecast by Region, 2017-2032 Table 2: Global Membrane Boxes Market Volume (Units) Forecast by Region, 2017-2032 Table 3: Global Membrane Boxes Market Value (US$ Mn) Forecast by Product Type, 2017-2032 Table 4: Global Membrane Boxes Market Volume (Units) Forecast by Product Type, 2017-2032 Table 5: Global Membrane Boxes Market Value (US$ Mn) Forecast by Application, 2017-2032 Table 6: Global Membrane Boxes Market Volume (Units) Forecast by Application, 2017-2032 Table 7: Global Membrane Boxes Market Value (US$ Mn) Forecast by Shape, 2017-2032 Table 8: Global Membrane Boxes Market Volume (Units) Forecast by Shape, 2017-2032 Table 9: North America Membrane Boxes Market Value (US$ Mn) Forecast by Country, 2017-2032 Table 10: North America Membrane Boxes Market Volume (Units) Forecast by Country, 2017-2032 Table 11: North America Membrane Boxes Market Value (US$ Mn) Forecast by Product Type, 2017-2032 Table 12: North America Membrane Boxes Market Volume (Units) Forecast by Product Type, 2017-2032 Table 13: North America Membrane Boxes Market Value (US$ Mn) Forecast by Application, 2017-2032 Table 14: North America Membrane Boxes Market Volume (Units) Forecast by Application, 2017-2032 Table 15: North America Membrane Boxes Market Value (US$ Mn) Forecast by Shape, 2017-2032 Table 16: North America Membrane Boxes Market Volume (Units) Forecast by Shape, 2017-2032 Table 17: Latin America Membrane Boxes Market Value (US$ Mn) Forecast by Country, 2017-2032 Table 18: Latin America Membrane Boxes Market Volume (Units) Forecast by Country, 2017-2032 Table 19: Latin America Membrane Boxes Market Value (US$ Mn) Forecast by Product Type, 2017-2032 Table 20: Latin America Membrane Boxes Market Volume (Units) Forecast by Product Type, 2017-2032 Table 21: Latin America Membrane Boxes Market Value (US$ Mn) Forecast by Application, 2017-2032 Table 22: Latin America Membrane Boxes Market Volume (Units) Forecast by Application, 2017-2032 Table 23: Latin America Membrane Boxes Market Value (US$ Mn) Forecast by Shape, 2017-2032 Table 24: Latin America Membrane Boxes Market Volume (Units) Forecast by Shape, 2017-2032 Table 25: Europe Membrane Boxes Market Value (US$ Mn) Forecast by Country, 2017-2032 Table 26: Europe Membrane Boxes Market Volume (Units) Forecast by Country, 2017-2032 Table 27: Europe Membrane Boxes Market Value (US$ Mn) Forecast by Product Type, 2017-2032 Table 28: Europe Membrane Boxes Market Volume (Units) Forecast by Product Type, 2017-2032 Table 29: Europe Membrane Boxes Market Value (US$ Mn) Forecast by Application, 2017-2032 Table 30: Europe Membrane Boxes Market Volume (Units) Forecast by Application, 2017-2032 Table 31: Europe Membrane Boxes Market Value (US$ Mn) Forecast by Shape, 2017-2032 Table 32: Europe Membrane Boxes Market Volume (Units) Forecast by Shape, 2017-2032 Table 33: Asia Pacific Membrane Boxes Market Value (US$ Mn) Forecast by Country, 2017-2032 Table 34: Asia Pacific Membrane Boxes Market Volume (Units) Forecast by Country, 2017-2032 Table 35: Asia Pacific Membrane Boxes Market Value (US$ Mn) Forecast by Product Type, 2017-2032 Table 36: Asia Pacific Membrane Boxes Market Volume (Units) Forecast by Product Type, 2017-2032 Table 37: Asia Pacific Membrane Boxes Market Value (US$ Mn) Forecast by Application, 2017-2032 Table 38: Asia Pacific Membrane Boxes Market Volume (Units) Forecast by Application, 2017-2032 Table 39: Asia Pacific Membrane Boxes Market Value (US$ Mn) Forecast by Shape, 2017-2032 Table 40: Asia Pacific Membrane Boxes Market Volume (Units) Forecast by Shape, 2017-2032 Table 41: MEA Membrane Boxes Market Value (US$ Mn) Forecast by Country, 2017-2032 Table 42: MEA Membrane Boxes Market Volume (Units) Forecast by Country, 2017-2032 Table 43: MEA Membrane Boxes Market Value (US$ Mn) Forecast by Product Type, 2017-2032 Table 44: MEA Membrane Boxes Market Volume (Units) Forecast by Product Type, 2017-2032 Table 45: MEA Membrane Boxes Market Value (US$ Mn) Forecast by Application, 2017-2032 Table 46: MEA Membrane Boxes Market Volume (Units) Forecast by Application, 2017-2032 Table 47: MEA Membrane Boxes Market Value (US$ Mn) Forecast by Shape, 2017-2032 Table 48: MEA Membrane Boxes Market Volume (Units) Forecast by Shape, 2017-2032
Find your sweet spots for generating winning opportunities in this market.
Talk to AnalystList of Charts
Figure 1: Global Membrane Boxes Market Value (US$ Mn) by Product Type, 2022-2032 Figure 2: Global Membrane Boxes Market Value (US$ Mn) by Application, 2022-2032 Figure 3: Global Membrane Boxes Market Value (US$ Mn) by Shape, 2022-2032 Figure 4: Global Membrane Boxes Market Value (US$ Mn) by Region, 2022-2032 Figure 5: Global Membrane Boxes Market Value (US$ Mn) Analysis by Region, 2017-2032 Figure 6: Global Membrane Boxes Market Volume (Units) Analysis by Region, 2017-2032 Figure 7: Global Membrane Boxes Market Value Share (%) and BPS Analysis by Region, 2022-2032 Figure 8: Global Membrane Boxes Market Y-o-Y Growth (%) Projections by Region, 2022-2032 Figure 9: Global Membrane Boxes Market Value (US$ Mn) Analysis by Product Type, 2017-2032 Figure 10: Global Membrane Boxes Market Volume (Units) Analysis by Product Type, 2017-2032 Figure 11: Global Membrane Boxes Market Value Share (%) and BPS Analysis by Product Type, 2022-2032 Figure 12: Global Membrane Boxes Market Y-o-Y Growth (%) Projections by Product Type, 2022-2032 Figure 13: Global Membrane Boxes Market Value (US$ Mn) Analysis by Application, 2017-2032 Figure 14: Global Membrane Boxes Market Volume (Units) Analysis by Application, 2017-2032 Figure 15: Global Membrane Boxes Market Value Share (%) and BPS Analysis by Application, 2022-2032 Figure 16: Global Membrane Boxes Market Y-o-Y Growth (%) Projections by Application, 2022-2032 Figure 17: Global Membrane Boxes Market Value (US$ Mn) Analysis by Shape, 2017-2032 Figure 18: Global Membrane Boxes Market Volume (Units) Analysis by Shape, 2017-2032 Figure 19: Global Membrane Boxes Market Value Share (%) and BPS Analysis by Shape, 2022-2032 Figure 20: Global Membrane Boxes Market Y-o-Y Growth (%) Projections by Shape, 2022-2032 Figure 21: Global Membrane Boxes Market Attractiveness by Product Type, 2022-2032 Figure 22: Global Membrane Boxes Market Attractiveness by Application, 2022-2032 Figure 23: Global Membrane Boxes Market Attractiveness by Shape, 2022-2032 Figure 24: Global Membrane Boxes Market Attractiveness by Region, 2022-2032 Figure 25: North America Membrane Boxes Market Value (US$ Mn) by Product Type, 2022-2032 Figure 26: North America Membrane Boxes Market Value (US$ Mn) by Application, 2022-2032 Figure 27: North America Membrane Boxes Market Value (US$ Mn) by Shape, 2022-2032 Figure 28: North America Membrane Boxes Market Value (US$ Mn) by Country, 2022-2032 Figure 29: North America Membrane Boxes Market Value (US$ Mn) Analysis by Country, 2017-2032 Figure 30: North America Membrane Boxes Market Volume (Units) Analysis by Country, 2017-2032 Figure 31: North America Membrane Boxes Market Value Share (%) and BPS Analysis by Country, 2022-2032 Figure 32: North America Membrane Boxes Market Y-o-Y Growth (%) Projections by Country, 2022-2032 Figure 33: North America Membrane Boxes Market Value (US$ Mn) Analysis by Product Type, 2017-2032 Figure 34: North America Membrane Boxes Market Volume (Units) Analysis by Product Type, 2017-2032 Figure 35: North America Membrane Boxes Market Value Share (%) and BPS Analysis by Product Type, 2022-2032 Figure 36: North America Membrane Boxes Market Y-o-Y Growth (%) Projections by Product Type, 2022-2032 Figure 37: North America Membrane Boxes Market Value (US$ Mn) Analysis by Application, 2017-2032 Figure 38: North America Membrane Boxes Market Volume (Units) Analysis by Application, 2017-2032 Figure 39: North America Membrane Boxes Market Value Share (%) and BPS Analysis by Application, 2022-2032 Figure 40: North America Membrane Boxes Market Y-o-Y Growth (%) Projections by Application, 2022-2032 Figure 41: North America Membrane Boxes Market Value (US$ Mn) Analysis by Shape, 2017-2032 Figure 42: North America Membrane Boxes Market Volume (Units) Analysis by Shape, 2017-2032 Figure 43: North America Membrane Boxes Market Value Share (%) and BPS Analysis by Shape, 2022-2032 Figure 44: North America Membrane Boxes Market Y-o-Y Growth (%) Projections by Shape, 2022-2032 Figure 45: North America Membrane Boxes Market Attractiveness by Product Type, 2022-2032 Figure 46: North America Membrane Boxes Market Attractiveness by Application, 2022-2032 Figure 47: North America Membrane Boxes Market Attractiveness by Shape, 2022-2032 Figure 48: North America Membrane Boxes Market Attractiveness by Country, 2022-2032 Figure 49: Latin America Membrane Boxes Market Value (US$ Mn) by Product Type, 2022-2032 Figure 50: Latin America Membrane Boxes Market Value (US$ Mn) by Application, 2022-2032 Figure 51: Latin America Membrane Boxes Market Value (US$ Mn) by Shape, 2022-2032 Figure 52: Latin America Membrane Boxes Market Value (US$ Mn) by Country, 2022-2032 Figure 53: Latin America Membrane Boxes Market Value (US$ Mn) Analysis by Country, 2017-2032 Figure 54: Latin America Membrane Boxes Market Volume (Units) Analysis by Country, 2017-2032 Figure 55: Latin America Membrane Boxes Market Value Share (%) and BPS Analysis by Country, 2022-2032 Figure 56: Latin America Membrane Boxes Market Y-o-Y Growth (%) Projections by Country, 2022-2032 Figure 57: Latin America Membrane Boxes Market Value (US$ Mn) Analysis by Product Type, 2017-2032 Figure 58: Latin America Membrane Boxes Market Volume (Units) Analysis by Product Type, 2017-2032 Figure 59: Latin America Membrane Boxes Market Value Share (%) and BPS Analysis by Product Type, 2022-2032 Figure 60: Latin America Membrane Boxes Market Y-o-Y Growth (%) Projections by Product Type, 2022-2032 Figure 61: Latin America Membrane Boxes Market Value (US$ Mn) Analysis by Application, 2017-2032 Figure 62: Latin America Membrane Boxes Market Volume (Units) Analysis by Application, 2017-2032 Figure 63: Latin America Membrane Boxes Market Value Share (%) and BPS Analysis by Application, 2022-2032 Figure 64: Latin America Membrane Boxes Market Y-o-Y Growth (%) Projections by Application, 2022-2032 Figure 65: Latin America Membrane Boxes Market Value (US$ Mn) Analysis by Shape, 2017-2032 Figure 66: Latin America Membrane Boxes Market Volume (Units) Analysis by Shape, 2017-2032 Figure 67: Latin America Membrane Boxes Market Value Share (%) and BPS Analysis by Shape, 2022-2032 Figure 68: Latin America Membrane Boxes Market Y-o-Y Growth (%) Projections by Shape, 2022-2032 Figure 69: Latin America Membrane Boxes Market Attractiveness by Product Type, 2022-2032 Figure 70: Latin America Membrane Boxes Market Attractiveness by Application, 2022-2032 Figure 71: Latin America Membrane Boxes Market Attractiveness by Shape, 2022-2032 Figure 72: Latin America Membrane Boxes Market Attractiveness by Country, 2022-2032 Figure 73: Europe Membrane Boxes Market Value (US$ Mn) by Product Type, 2022-2032 Figure 74: Europe Membrane Boxes Market Value (US$ Mn) by Application, 2022-2032 Figure 75: Europe Membrane Boxes Market Value (US$ Mn) by Shape, 2022-2032 Figure 76: Europe Membrane Boxes Market Value (US$ Mn) by Country, 2022-2032 Figure 77: Europe Membrane Boxes Market Value (US$ Mn) Analysis by Country, 2017-2032 Figure 78: Europe Membrane Boxes Market Volume (Units) Analysis by Country, 2017-2032 Figure 79: Europe Membrane Boxes Market Value Share (%) and BPS Analysis by Country, 2022-2032 Figure 80: Europe Membrane Boxes Market Y-o-Y Growth (%) Projections by Country, 2022-2032 Figure 81: Europe Membrane Boxes Market Value (US$ Mn) Analysis by Product Type, 2017-2032 Figure 82: Europe Membrane Boxes Market Volume (Units) Analysis by Product Type, 2017-2032 Figure 83: Europe Membrane Boxes Market Value Share (%) and BPS Analysis by Product Type, 2022-2032 Figure 84: Europe Membrane Boxes Market Y-o-Y Growth (%) Projections by Product Type, 2022-2032 Figure 85: Europe Membrane Boxes Market Value (US$ Mn) Analysis by Application, 2017-2032 Figure 86: Europe Membrane Boxes Market Volume (Units) Analysis by Application, 2017-2032 Figure 87: Europe Membrane Boxes Market Value Share (%) and BPS Analysis by Application, 2022-2032 Figure 88: Europe Membrane Boxes Market Y-o-Y Growth (%) Projections by Application, 2022-2032 Figure 89: Europe Membrane Boxes Market Value (US$ Mn) Analysis by Shape, 2017-2032 Figure 90: Europe Membrane Boxes Market Volume (Units) Analysis by Shape, 2017-2032 Figure 91: Europe Membrane Boxes Market Value Share (%) and BPS Analysis by Shape, 2022-2032 Figure 92: Europe Membrane Boxes Market Y-o-Y Growth (%) Projections by Shape, 2022-2032 Figure 93: Europe Membrane Boxes Market Attractiveness by Product Type, 2022-2032 Figure 94: Europe Membrane Boxes Market Attractiveness by Application, 2022-2032 Figure 95: Europe Membrane Boxes Market Attractiveness by Shape, 2022-2032 Figure 96: Europe Membrane Boxes Market Attractiveness by Country, 2022-2032 Figure 97: Asia Pacific Membrane Boxes Market Value (US$ Mn) by Product Type, 2022-2032 Figure 98: Asia Pacific Membrane Boxes Market Value (US$ Mn) by Application, 2022-2032 Figure 99: Asia Pacific Membrane Boxes Market Value (US$ Mn) by Shape, 2022-2032 Figure 100: Asia Pacific Membrane Boxes Market Value (US$ Mn) by Country, 2022-2032 Figure 101: Asia Pacific Membrane Boxes Market Value (US$ Mn) Analysis by Country, 2017-2032 Figure 102: Asia Pacific Membrane Boxes Market Volume (Units) Analysis by Country, 2017-2032 Figure 103: Asia Pacific Membrane Boxes Market Value Share (%) and BPS Analysis by Country, 2022-2032 Figure 104: Asia Pacific Membrane Boxes Market Y-o-Y Growth (%) Projections by Country, 2022-2032 Figure 105: Asia Pacific Membrane Boxes Market Value (US$ Mn) Analysis by Product Type, 2017-2032 Figure 106: Asia Pacific Membrane Boxes Market Volume (Units) Analysis by Product Type, 2017-2032 Figure 107: Asia Pacific Membrane Boxes Market Value Share (%) and BPS Analysis by Product Type, 2022-2032 Figure 108: Asia Pacific Membrane Boxes Market Y-o-Y Growth (%) Projections by Product Type, 2022-2032 Figure 109: Asia Pacific Membrane Boxes Market Value (US$ Mn) Analysis by Application, 2017-2032 Figure 110: Asia Pacific Membrane Boxes Market Volume (Units) Analysis by Application, 2017-2032 Figure 111: Asia Pacific Membrane Boxes Market Value Share (%) and BPS Analysis by Application, 2022-2032 Figure 112: Asia Pacific Membrane Boxes Market Y-o-Y Growth (%) Projections by Application, 2022-2032 Figure 113: Asia Pacific Membrane Boxes Market Value (US$ Mn) Analysis by Shape, 2017-2032 Figure 114: Asia Pacific Membrane Boxes Market Volume (Units) Analysis by Shape, 2017-2032 Figure 115: Asia Pacific Membrane Boxes Market Value Share (%) and BPS Analysis by Shape, 2022-2032 Figure 116: Asia Pacific Membrane Boxes Market Y-o-Y Growth (%) Projections by Shape, 2022-2032 Figure 117: Asia Pacific Membrane Boxes Market Attractiveness by Product Type, 2022-2032 Figure 118: Asia Pacific Membrane Boxes Market Attractiveness by Application, 2022-2032 Figure 119: Asia Pacific Membrane Boxes Market Attractiveness by Shape, 2022-2032 Figure 120: Asia Pacific Membrane Boxes Market Attractiveness by Country, 2022-2032 Figure 121: MEA Membrane Boxes Market Value (US$ Mn) by Product Type, 2022-2032 Figure 122: MEA Membrane Boxes Market Value (US$ Mn) by Application, 2022-2032 Figure 123: MEA Membrane Boxes Market Value (US$ Mn) by Shape, 2022-2032 Figure 124: MEA Membrane Boxes Market Value (US$ Mn) by Country, 2022-2032 Figure 125: MEA Membrane Boxes Market Value (US$ Mn) Analysis by Country, 2017-2032 Figure 126: MEA Membrane Boxes Market Volume (Units) Analysis by Country, 2017-2032 Figure 127: MEA Membrane Boxes Market Value Share (%) and BPS Analysis by Country, 2022-2032 Figure 128: MEA Membrane Boxes Market Y-o-Y Growth (%) Projections by Country, 2022-2032 Figure 129: MEA Membrane Boxes Market Value (US$ Mn) Analysis by Product Type, 2017-2032 Figure 130: MEA Membrane Boxes Market Volume (Units) Analysis by Product Type, 2017-2032 Figure 131: MEA Membrane Boxes Market Value Share (%) and BPS Analysis by Product Type, 2022-2032 Figure 132: MEA Membrane Boxes Market Y-o-Y Growth (%) Projections by Product Type, 2022-2032 Figure 133: MEA Membrane Boxes Market Value (US$ Mn) Analysis by Application, 2017-2032 Figure 134: MEA Membrane Boxes Market Volume (Units) Analysis by Application, 2017-2032 Figure 135: MEA Membrane Boxes Market Value Share (%) and BPS Analysis by Application, 2022-2032 Figure 136: MEA Membrane Boxes Market Y-o-Y Growth (%) Projections by Application, 2022-2032 Figure 137: MEA Membrane Boxes Market Value (US$ Mn) Analysis by Shape, 2017-2032 Figure 138: MEA Membrane Boxes Market Volume (Units) Analysis by Shape, 2017-2032 Figure 139: MEA Membrane Boxes Market Value Share (%) and BPS Analysis by Shape, 2022-2032 Figure 140: MEA Membrane Boxes Market Y-o-Y Growth (%) Projections by Shape, 2022-2032 Figure 141: MEA Membrane Boxes Market Attractiveness by Product Type, 2022-2032 Figure 142: MEA Membrane Boxes Market Attractiveness by Application, 2022-2032 Figure 143: MEA Membrane Boxes Market Attractiveness by Shape, 2022-2032 Figure 144: MEA Membrane Boxes Market Attractiveness by Country, 2022-2032
Recommendations
Explore Packaging Insights
View Reports