Egg Emulsifier Market Size, Share, and Forecast Outlook 2025 to 2035

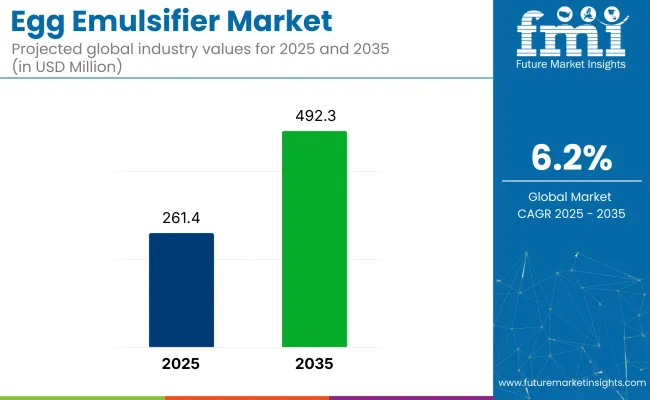
The egg emulsifier market to be valued at USD 261.4 million in 2025 and is projected to reach USD 492.3 million by 2035. This market is expected to grow at a CAGR of 6.2% over the forecast period. Growth stems from convergence across clean-label reformulation, regulatory disincentives for synthetic stabilizers, and intensified product development in emulsified food systems.
Quick Stats of Egg Emulsifier Market

  • Market Value (2025): USD 261.4 million
  • Forecast Value (2035): USD 492.3 million
  • Forecast CAGR (2025 to 2035): 6.2%
  • Leading Segment in 2025: Egg Yolk (67.2% share)
  • Key Growth Region: Asia Pacific (India is the fastest growing market with 6.1% CAGR)
  • Key Players: Cargill Inc., Kewpie Corporation, Rose Acre Farms, Rembrandt Enterprises, Bouwhuis Enthoven, Wulro BV, IGRECA, SANOVO TECHNOLOGY GROUP, Interovo Egg Group BV, Dalian Hanovo Foods Co. Ltd.

Egg Emulsifier Market

Metric Value
Estimated Size (2025) USD 261.4 million
Projected value (2035) USD 492.3 million
CAGR (2025 to 2035) 6.2%

With synthetic emulsifiers under scrutiny in Europe and parts of Asia, egg-derived inputs are re-entering processed food formulations under premium, additive-free labels. Yolk-based concentrates are favored for their lecithin richness and oil-binding capacity, especially in bakery batters, emulsified sauces, and rehydrated convenience products.

Emerging Asian economies have transitioned from bulk egg trade toward fractionated derivatives with technical specificity, aided by automation in drying and separation. In India, Vietnam, and Indonesia, contract processors have secured capacity expansion subsidies to boost output of spray-dried yolk powder and customized blends. Meanwhile, in North America and Western Europe, the focus has shifted toward high-purity emulsifiers for ketogenic, paleo, and allergen-free formulations.

Digital traceability, driven by supply assurance mandates in retail manufacturing, is beginning to influence input sourcing. Food processors are prioritizing origin-specific egg emulsifiers, especially those with third-party cage-free or organic validation. As frozen and refrigerated meal brands expand their footprint across online grocery channels, stable emulsification across fluctuating cold-chain conditions is seen as a technical differentiator. These structural shifts are reshaping supply chain incentives across producer, processor, and brand layers.

The industry registers to estimated 3.4% share of the emulsifiers market, driven by its use in natural oil-in-water applications. Within the egg and egg products market, it contributes around 1.9%, reflecting a niche yet growing function-specific role. In the broader food additives market, its share remains under 0.5%, as it represents a specialized sub-segment.

It holds roughly 2.1% of the functional ingredients market, owing to its dual role in enhancing stability and sensory attributes. In the bakery ingredients market, capture close to 4.6%, benefiting from the heavy reliance on emulsification in dough and batter systems. These proportions highlight its value in performance-centric applications despite limited total volume.

Beyond functional roles, the clean-label appeal of egg-derived additives aligns with evolving regulatory and consumer expectations, further supporting their inclusion across food and beverage applications. Manufacturers in processed food categories are thus increasingly leaning on egg-based emulsification to meet dual objectives, maintaining product integrity and aligning with clean ingredient decks. According to USDA, In November 2024, United States egg production totaled 8.92 billion.

Analysis of Egg Emulsifier Market by Top Investment Segments

Egg yolk leads the source segment due to its rich phospholipid content and alignment with clean-label preferences, making it ideal for stabilizing emulsions in various food products. Liquid form remains dominant for its ease of use in industrial systems and superior dispersion. Bakery applications continue to drive demand, given emulsifiers' role in improving structure, shelf life, and consistency in baked goods.

Egg Yolk to Lead the Source Segment with 67.2% Market Share

Egg yolk are projected to lead the source segment, accounting for 67.2% of the global market share by 2025.
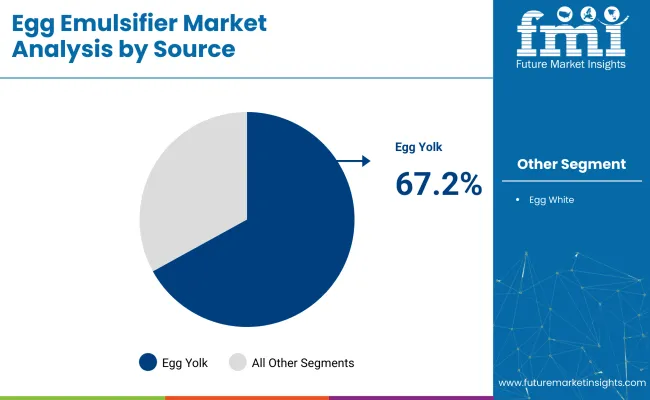
  • Egg yolk leads the egg emulsifier market due to its natural composition of phospholipids, lipoproteins, and proteins, which collectively function as highly effective emulsifying agents. These components stabilize oil-in-water emulsions, making yolk indispensable in products like mayonnaise, dressings, spreads, and creams.
  • Egg yolk aligns with consumer preference for natural and recognizable ingredients, which has reinforced its dominance in clean-label food formulations.
  • The presence of lecithin, a naturally occurring emulsifier, further enhances its technical performance in blending fat and water phases.

Egg Emulsifier Market Analysis By Source

By Form, Liquid Segment Accounts for Over 56.2% Share

Liquid egg is expected to dominate the form segment, securing 56.2% of the global market share by 2025. Liquid form dominate the market because of their ease of incorporation into automated food manufacturing systems, reducing processing time and improving batch consistency.
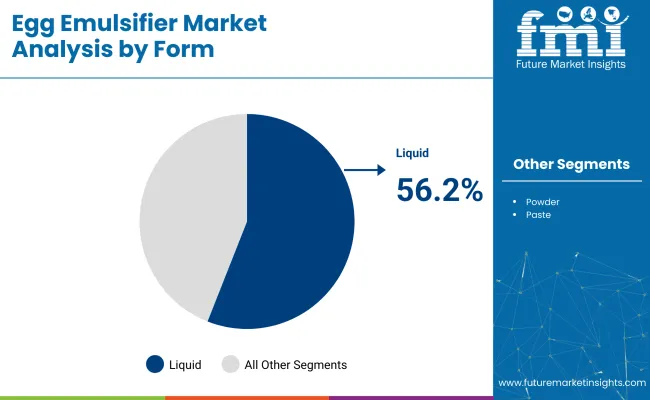
  • Unlike powdered forms, liquid emulsifiers require no rehydration, allowing seamless integration into doughs, batters, and sauces without altering moisture levels. They also support accurate dosing and uniform dispersion, essential in large-scale bakery and processed food production.
  • Manufacturers prefer liquid formats for their ability to maintain product homogeneity, especially in applications where stable emulsions are critical.
  • Liquid forms are widely used in cakes, muffins, and ready-to-eat bakery goods, where texture and shelf-life depend heavily on emulsifier functionality.

Egg Emulsifier Market Analysis By Form

Growing Product Demand in Bakery Applications with 38% Share

The bakery segment is projected to hold the leading share in the market, estimated at over 38% of total application-based demand in 2025. This dominance stems from the critical role emulsifiers play in improving dough stability, volume, crumb structure, and shelf life of bakery products such as breads, cakes, muffins, and pastries.

  • Egg emulsifiers help maintain consistent texture and prevent ingredient separation during mixing and baking.
  • The demand for ready-to-eat and artisanal baked goods continues to expand across retail and foodservice channels, industrial bakeries increasingly adopt egg-based emulsifiers for clean-label product positioning.
  • The bakery sector’s technical reliance on emulsification, combined with rising consumer preference for premium textures and longer shelf-life, continues to anchor its leadership in the application hierarchy of the market.

Top Egg Emulsifier Market Dynamics

The market's progression reflects dual pressure-manufacturer reformulation mandates and consumer expectations for functional stability without synthetic additives. Advances in yolk fractionation now deliver high-emulsification performance across processed food systems subject to variable temperature, acidity, and mechanical stress.

Processed Meal Expansion Elevates Technical Dependency

As premade sauces, frozen entrees, and commercial bakery items scale in volume, demand has intensified for reliable emulsifiers that maintain emulsion integrity during transport and storage. Egg-derived compounds, particularly yolk phospholipids, are being prioritized over mono- and diglycerides to meet ingredient-label mandates. Fast-moving consumer goods (FMCG) brands are shifting toward egg-based systems for dressings, dips, and dough mixes with prolonged refrigerated life and consistent batch performance.

  • Emulsification resilience under chilled and frozen distribution
  • Increased use in global private-label bakery expansion
  • Decline in synthetic additive tolerances across retail

Advanced Extract Processing Enables Broader Use Profiles

Thermomechanical refinements in yolk separation are allowing stable emulsifier deployment in products that previously required hydrocolloids or chemical stabilizers. Beverage developers in Asia and Europe are using these improved egg extracts in fortified milk drinks and plant-nutrition blends. Shorter ingredient declarations, enabled by protein-rich emulsifiers, are reinforcing adoption in functional meal replacements and clean-label dairy analogues.
  • Enhanced emulsifier pH tolerance suits acidic drinks
  • Phospholipid integrity maintained under new drying protocols
  • Compliant with clean-label directives across key regions

Analysis of Top Countries Manufacturing, Exporting and Supplying Egg Emulsifier Globally

Egg Emulsifier Market Country Wise Analysis

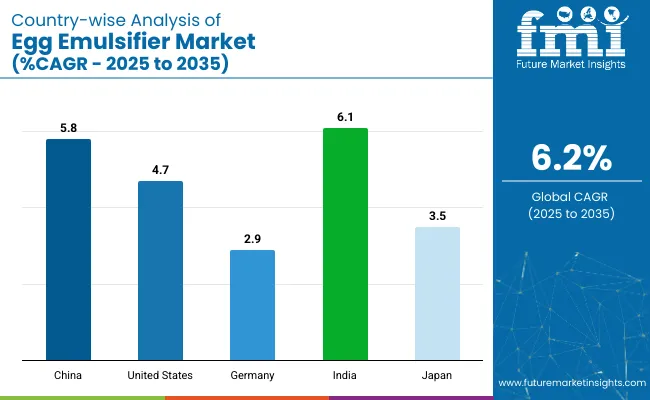
Countries CAGR (2025 to 2035)
United States 4.7%
Germany 2.9%
Japan 3.5%
China 5.8%
India 6.1%

The egg emulsifier demand is projected to expand at a 6.2% CAGR from 2025 to 2035. Of the five profiled markets, India registers the swiftest pace at 6.1%, followed by China at 5.8% and the United States at 4.7%, whereas Japan posts 3.5% and Germany records 2.9%. These rates translate to growth premiums of -2% for India, -6% for China, and -24% for the United States versus the baseline, while Japan and Germany lag further at -44% and -53%, respectively.

Divergence has been driven by bakery-capacity expansion and hot-weather shelf-life requirements in India, e-commerce snack proliferation in China, retailer clean-label scorecards in the United States, convenience-store dessert turnover in Japan, and additive-reduction mandates under Europe’s reformulation strategy in Germany.

The report covers a detailed analysis of 40+ countries and the top five countries have been shared as a reference.

USA Egg Emulsifier Market Analysis and Growth Outlook

Demand for egg emulsifier in the United States is projected to grow at 4.7% CAGR from 2025 to 2035. Demand is being propelled by rising sales of chilled entrées, salad dressings, and snack dips that require stable oil-in-water dispersion throughout multistate distribution networks. Egg-derived phospholipids have been adopted by sauce and bakery mix producers responding to retailer clean-label scorecards that discourage synthetic additives.

The Food and Drug Administration’s restrictions on partially hydrogenated oils have encouraged a switch to yolk-based binders that preserve mouthfeel without artificial agents. Liquid formats integrate easily into continuous dough systems at industrial bakeries, ensuring volume consistency and crumb uniformity across nationwide quick-service chains.

  • Snack dip reformulations adopt egg binders
  • FDA oil limits drive phospholipid uptake
  • Private-label growth highlights recognisable ingredients

China Egg Emulsifier Industry Expansion

The China egg emulsifier market is anticipated to grow at 5.8% CAGR during the forecast period. Expansion is being driven by rapid growth in packaged bakery goods distributed through convenience stores and e-commerce channels. Domestic patisserie brands depend on egg-based emulsifiers to achieve consistent batter aeration and moisture retention under high-throughput production lines.

The national ban on industrial trans fats has prompted manufacturers to eliminate certain synthetic additives, elevating demand for yolk-derived alternatives that satisfy regulatory audits. Rising disposable time among urban consumers has increased preference for ready-to-eat steamed buns, cakes, and filled pastries, all of which benefit from emulsifier-enabled softness during ambient storage.

  • Trans fat rules favour yolk-based agents
  • E-commerce snacks require shelf-stable texture
  • Milk-tea brands incorporate egg emulsifiers

Germany Egg Emulsifier Market Outlook for Growth

The Germany egg emulsifier market is expected to grow at 2.9% CAGR between 2025 and 2035. Growth is supported by the National Reformulation Strategy, which encourages food companies to reduce artificial additives while maintaining organoleptic quality in processed items. Egg-derived emulsifiers provide a natural pathway to achieve stable emulsions in sauces, mayonnaises, and premium bread spreads marketed through discount supermarkets.

The European Union’s cap on industrial trans fats has triggered reformulation projects that replace mono- and diglycerides with lecithin-rich yolk fractions, ensuring compliance without sacrificing spreadability. Craft bakeries supplying high-protein breads rely on liquid yolk emulsifiers to manage dough extensibility during long fermentation cycles, yielding uniform crumb structure prized by health-conscious shoppers.

  • EU additive limits encourage lecithin use
  • Discount chains demand clean-label spreads
  • Craft bakeries target uniform crumb texture

India Egg Emulsifier Industry Growth

The India egg emulsifier market is valued at 6.1% CAGR during the forecast period. Expansion is being fuelled by a boom in industrial bakeries and quick-service restaurants that supply sweet buns, pastries, and filled cookies across tier-one and tier-two cities. Egg-based emulsifiers improve batter stability under high ambient temperatures, preventing oil separation during transport on unrefrigerated trucks.

Food Safety and Standards Authority of India guidelines now emphasise ingredient transparency, prompting processors to swap synthetic emulsifiers for naturally sourced yolk fractions. Domestic egg production clusters in Andhra Pradesh and Tamil Nadu ensure consistent raw material streams, enabling fractionators to offer competitively priced liquid emulsifier blends to bakery hubs in Maharashtra and Gujarat. Dairy dessert manufacturers have integrated egg phospholipids into caramel and fruit-based toppings to arrest phase separation, extending shelf life for modern trade channels.

  • Ambient-temperature transport needs stable emulsions
  • Regulatory focus on natural additives
  • Domestic egg clusters secure raw supply

Japan Egg Emulsifier Market Insights

The Japan egg emulsifier market is estimated to grow at 3.5% CAGR from 2025 to 2035. Market momentum is linked to the nation’s convenience culture, where on-the-go sandwiches, puddings, and roll cakes dominate cold-chain retail shelves. Egg-derived emulsifiers ensure consistent texture and extended freshness, critical for products cycled daily through convenience stores and vending machines.

The ministry of health, labour and welfare has tightened oversight of synthetic additive usage, prompting major confectionery groups to pivot toward yolk-based solutions that satisfy clean ingredient lists without compromising mouthfeel. Liquid yolk emulsifiers facilitate precise dosing in automated depositor lines common in Japanese factories, reducing batch variability and supporting lean manufacturing targets.

  • Convenience-store desserts rely on yolk stabilisers
  • Additive scrutiny pushes natural emulsifiers
  • Dairy-coffee drinks use egg phospholipids

Leading Egg Emulsifier Suppliers

The egg emulsifier industry is shaped by dominant suppliers and specialized players focusing on yolk fractionation, liquid blending, and application-specific emulsifier solutions. Key companies like Cargill Inc., Kewpie Corporation, and Rose Acre Farms lead with integrated supply chains and diversified egg-based ingredient portfolios catering to bakery, sauce, and processed food sectors.

Rembrandt Enterprises and Bouwhuis Enthoven are known for high-purity yolk extracts suited for industrial emulsification. European processors such as Wulro BV, IGRECA, and Interovo Egg Group BV serve regional demand for liquid and powdered formats under strict additive regulations. SANOVO TECHNOLOGY GROUP plays a critical role in processing equipment and in-line emulsifier integration, while Dalian Hanovo Foods Co. Ltd strengthens Asia’s regional access with scalable egg-ingredient exports.

Recent Egg Emulsifier Industry News

  • Cargill Inc. has pursued acquisitions to strengthen its position in the egg emulsifier sector, including the acquisition of two USA feed mills in 2024, and is expected to continue expanding its processing and distribution capacity through 2025 and beyond. Cargill’s strategies also emphasize advanced technology adoption and global networking to maintain market dominance

Leading Players

  • Cargill Inc.
  • Kewpie Corporation
  • Rose Acre Farms
  • Rembrandt Enterprises
  • Bouwhuis Enthoven
  • Wulro BV
  • IGRECA
  • SANOVO TECHNOLOGY GROUP
  • Interovo Egg Group BV
  • Dalian Hanovo foods Co. Ltd

Report Coverage and Scope Summary

Report Attributes Details
Market Size (2025) USD 261.4 million
Projected Market Size (2035) USD 492.3 million
CAGR (2025 to 2035) 6.2%
Base Year for Estimation 2024
Historical Period 2020 to 2024
Projections Period 2025 to 2035
Quantitative Units USD million for value and volume in tons
Source Analyzed (Segment 1) Egg Yolk and Egg White.
Applications Analyzed (Segment 2) Bakery, Confectionery, Beverages, Dairy Products, Processed Food, and Others.
Form Analyzed (Segment 3) Powder, Liquid, and Paste
Regions Covered North America, Europe, Asia Pacific, Middle East & Africa, Latin America
Countries Covered United States, Canada, Germany, United Kingdom, France, Italy, Spain, China, Japan, South Korea, India, Australia, Brazil, Mexico, Argentina, Saudi Arabia, UAE, South Africa
Key Players Cargill Inc., Kewpie Corporation, Rose Acre Farms, Rembrandt Enterprises, Bouwhuis Enthoven, Wulro BV, IGRECA, SANOVO TECHNOLOGY GROUP, Interovo Egg Group BV, Dalian Hanovo Foods Co. Ltd.
Additional Attributes Dollar sales, share, CAGR by application and region, top-performing formats, key sourcing trends, regulatory landscape, demand forecasts by end-use, buyer preferences, raw material volatility, competitor positioning.

Top Segments Studied in the Egg Emulsifier Market Research Report

By Source:

The industry is segmented into egg yolk and egg white.

By Application:

The industry finds applications in bakery, confectionery, beverages, dairy products, processed food, and others.

By Form:

The industry is segmented into powder, liquid, and paste.

By Region:

The industry covers regions including North America, Europe, Asia Pacific, Latin America, and the Middle East & Africa.

Table of Content

  1. Executive Summary
    • Global Market Outlook
    • Demand-side Trends
    • Supply-side Trends
    • Technology Roadmap Analysis
    • Analysis and Recommendations
  2. Market Overview
    • Market Coverage / Taxonomy
    • Market Definition / Scope / Limitations
  3. Market Background
    • Market Dynamics
      • Drivers
      • Restraints
      • Opportunity
      • Trends
    • Scenario Forecast
      • Demand in Optimistic Scenario
      • Demand in Likely Scenario
      • Demand in Conservative Scenario
    • Opportunity Map Analysis
    • Product Life Cycle Analysis
    • Supply Chain Analysis
      • Supply Side Participants and their Roles
        • Producers
        • Mid-Level Participants (Traders/ Agents/ Brokers)
        • Wholesalers and Distributors
      • Value Added and Value Created at Node in the Supply Chain
      • List of Raw Material Suppliers
      • List of Existing and Potential Buyer’s
    • Investment Feasibility Matrix
    • Value Chain Analysis
      • Profit Margin Analysis
      • Wholesalers and Distributors
      • Retailers
    • PESTLE and Porter’s Analysis
    • Regulatory Landscape
      • By Key Regions
      • By Key Countries
    • Regional Parent Market Outlook
    • Production and Consumption Statistics
    • Import and Export Statistics
  4. Global Market Analysis 2020 to 2024 and Forecast, 2025 to 2035
    • Historical Market Size Value (USD Million) & Volume in (tons) Analysis, 2020 to 2024
    • Current and Future Market Size Value (USD Million) & Volume in (tons) Projections, 2025 to 2035
      • Y-o-Y Growth Trend Analysis
      • Absolute $ Opportunity Analysis
  5. Global Market Pricing Analysis 2020 to 2024 and Forecast 2025 to 2035
  6. Global Market Analysis 2020 to 2024 and Forecast 2025 to 2035, By Source
    • Introduction / Key Findings
    • Historical Market Size Value (USD Million) & Volume in (tons) Analysis By Source, 2020 to 2024
    • Current and Future Market Size Value (USD Million) & Volume in (tons) Analysis and Forecast By Source, 2025 to 2035
      • Egg Yolk
      • Egg White
    • Y-o-Y Growth Trend Analysis By Source, 2020 to 2024
    • Absolute $ Opportunity Analysis By Source, 2025 to 2035
  7. Global Market Analysis 2020 to 2024 and Forecast 2025 to 2035, By Application
    • Introduction / Key Findings
    • Historical Market Size Value (USD Million) & Volume in (tons) Analysis By Application, 2020 to 2024
    • Current and Future Market Size Value (USD Million) & Volume in (tons) Analysis and Forecast By Application, 2025 to 2035
      • Bakery
      • Confectionery
      • Beverages
      • Dairy Products
      • Processed Food
      • Others
    • Y-o-Y Growth Trend Analysis By Application, 2020 to 2024
    • Absolute $ Opportunity Analysis By Application, 2025 to 2035
  8. Global Market Analysis 2020 to 2024 and Forecast 2025 to 2035, By Form
    • Introduction / Key Findings
    • Historical Market Size Value (USD Million) & Volume in (tons) Analysis By Form, 2020 to 2024
    • Current and Future Market Size Value (USD Million) & Volume in (tons) Analysis and Forecast By Form, 2025 to 2035
      • Powder
      • Liquid
      • Paste
    • Y-o-Y Growth Trend Analysis By Form, 2020 to 2024
    • Absolute $ Opportunity Analysis By Form, 2025 to 2035
  9. Global Market Analysis 2020 to 2024 and Forecast 2025 to 2035, By Region
    • Introduction
    • Historical Market Size Value (USD Million) & Volume in (tons) Analysis By Region, 2020 to 2024
    • Current Market Size Value (USD Million) & Volume in (tons) Analysis and Forecast By Region, 2025 to 2035
      • North America
      • Latin America
      • Western Europe
      • Eastern Europe
      • East Asia
      • South Asia & Pacific
      • Middle East and Africa
    • Market Attractiveness Analysis By Region
  10. North America Market Analysis 2020 to 2024 and Forecast 2025 to 2035, By Country
    • Historical Market Size Value (USD Million) & Volume in (tons) Trend Analysis By Market Taxonomy, 2020 to 2024
    • Market Size Value (USD Million) & Volume in (tons) Forecast By Market Taxonomy, 2025 to 2035
      • By Country
        • USA
        • Canada
        • Mexico
      • By Source
      • By Application
      • By Form
    • Market Attractiveness Analysis
      • By Country
      • By Source
      • By Application
      • By Form
    • Key Takeaways
  11. Latin America Market Analysis 2020 to 2024 and Forecast 2025 to 2035, By Country
    • Historical Market Size Value (USD Million) & Volume in (tons) Trend Analysis By Market Taxonomy, 2020 to 2024
    • Market Size Value (USD Million) & Volume in (tons) Forecast By Market Taxonomy, 2025 to 2035
      • By Country
        • Brazil
        • Argentina
        • Rest of LATAM
      • By Source
      • By Application
      • By Form
    • Market Attractiveness Analysis
      • By Country
      • By Source
      • By Application
      • By Form
    • Key Takeaways
  12. Western Europe Market Analysis 2020 to 2024 and Forecast 2025 to 2035, By Country
    • Historical Market Size Value (USD Million) & Volume in (tons) Trend Analysis By Market Taxonomy, 2020 to 2024
    • Market Size Value (USD Million) & Volume in (tons) Forecast By Market Taxonomy, 2025 to 2035
      • By Country
        • Germany
        • Italy
        • France
        • UK
        • Spain
        • BENELUX
        • Nordic
        • Rest of W.Europe
      • By Source
      • By Application
      • By Form
    • Market Attractiveness Analysis
      • By Country
      • By Source
      • By Application
      • By Form
    • Key Takeaways
  13. Eastern Europe Market Analysis 2020 to 2024 and Forecast 2025 to 2035, By Country
    • Historical Market Size Value (USD Million) & Volume in (tons) Trend Analysis By Market Taxonomy, 2020 to 2024
    • Market Size Value (USD Million) & Volume in (tons) Forecast By Market Taxonomy, 2025 to 2035
      • By Country
        • Russia
        • Hungary
        • Poland
        • Balkan & Baltics
        • Rest of E. Europe
      • By Source
      • By Application
      • By Form
    • Market Attractiveness Analysis
      • By Country
      • By Source
      • By Application
      • By Form
    • Key Takeaways
  14. East Asia Market Analysis 2020 to 2024 and Forecast 2025 to 2035, By Country
    • Historical Market Size Value (USD Million) & Volume in (tons) Trend Analysis By Market Taxonomy, 2020 to 2024
    • Market Size Value (USD Million) & Volume in (tons) Forecast By Market Taxonomy, 2025 to 2035
      • By Country
        • China
        • Japan
        • South Korea
      • By Source
      • By Application
      • By Form
    • Market Attractiveness Analysis
      • By Country
      • By Source
      • By Application
      • By Form
    • Key Takeaways
  15. South Asia & Pacific Market Analysis 2020 to 2024 and Forecast 2025 to 2035, By Country
    • Historical Market Size Value (USD Million) & Volume in (tons) Trend Analysis By Market Taxonomy, 2020 to 2024
    • Market Size Value (USD Million) & Volume in (tons) Forecast By Market Taxonomy, 2025 to 2035
      • By Country
        • India
        • Australia & New Zealand
        • ASEAN
        • Rest of SAP
      • By Source
      • By Application
      • By Form
    • Market Attractiveness Analysis
      • By Country
      • By Source
      • By Application
      • By Form
    • Key Takeaways
  16. Middle East and Africa Market Analysis 2020 to 2024 and Forecast 2025 to 2035, By Country
    • Historical Market Size Value (USD Million) & Volume in (tons) Trend Analysis By Market Taxonomy, 2020 to 2024
    • Market Size Value (USD Million) & Volume in (tons) Forecast By Market Taxonomy, 2025 to 2035
      • By Country
        • GCC Countries
        • Northern Africa
        • South Africa
        • Turkiye
        • Rest of MEA
      • By Source
      • By Application
      • By Form
    • Market Attractiveness Analysis
      • By Country
      • By Source
      • By Application
      • By Form
    • Key Takeaways
  17. Key Countries Market Analysis
    • USA
      • Pricing Analysis
      • Market Share Analysis, 2024
        • By Source
        • By Application
        • By Form
    • Canada
      • Pricing Analysis
      • Market Share Analysis, 2024
        • By Source
        • By Application
        • By Form
    • Brazil
      • Pricing Analysis
      • Market Share Analysis, 2024
        • By Source
        • By Application
        • By Form
    • Mexico
      • Pricing Analysis
      • Market Share Analysis, 2024
        • By Source
        • By Application
        • By Form
    • Argentina
      • Pricing Analysis
      • Market Share Analysis, 2024
        • By Source
        • By Application
        • By Form
  18. Market Structure Analysis
    • Competition Dashboard
    • Competition Benchmarking
    • Market Share Analysis of Top Players
      • By Regional
      • By Source
      • By Application
      • By Form
  19. Competition Analysis
    • Competition Deep Dive
      • Cargill Inc.
        • Overview
        • Product Portfolio
        • Profitability by Market Segments (Product/Age /Sales Channel/Region)
        • Sales Footprint
        • Strategy Overview
          • Marketing Strategy
          • Product Strategy
          • Channel Strategy
      • Kewpie Corporation
        • Overview
        • Product Portfolio
        • Profitability by Market Segments (Product/Age /Sales Channel/Region)
        • Sales Footprint
        • Strategy Overview
          • Marketing Strategy
          • Product Strategy
          • Channel Strategy
      • Rose Acre Farms
        • Overview
        • Product Portfolio
        • Profitability by Market Segments (Product/Age /Sales Channel/Region)
        • Sales Footprint
        • Strategy Overview
          • Marketing Strategy
          • Product Strategy
          • Channel Strategy
      • Rembrandt Enterprises
        • Overview
        • Product Portfolio
        • Profitability by Market Segments (Product/Age /Sales Channel/Region)
        • Sales Footprint
        • Strategy Overview
          • Marketing Strategy
          • Product Strategy
          • Channel Strategy
      • Bouwhuis Enthoven
        • Overview
        • Product Portfolio
        • Profitability by Market Segments (Product/Age /Sales Channel/Region)
        • Sales Footprint
        • Strategy Overview
          • Marketing Strategy
          • Product Strategy
          • Channel Strategy
      • Wulro BV
        • Overview
        • Product Portfolio
        • Profitability by Market Segments (Product/Age /Sales Channel/Region)
        • Sales Footprint
        • Strategy Overview
          • Marketing Strategy
          • Product Strategy
          • Channel Strategy
      • IGRECA
        • Overview
        • Product Portfolio
        • Profitability by Market Segments (Product/Age /Sales Channel/Region)
        • Sales Footprint
        • Strategy Overview
          • Marketing Strategy
          • Product Strategy
          • Channel Strategy
      • SANOVO TECHNOLOGY GROUP
        • Overview
        • Product Portfolio
        • Profitability by Market Segments (Product/Age /Sales Channel/Region)
        • Sales Footprint
        • Strategy Overview
          • Marketing Strategy
          • Product Strategy
          • Channel Strategy
      • Interovo Egg Group BV
        • Overview
        • Product Portfolio
        • Profitability by Market Segments (Product/Age /Sales Channel/Region)
        • Sales Footprint
        • Strategy Overview
          • Marketing Strategy
          • Product Strategy
          • Channel Strategy
      • Dalian Hanovo foods Co. Ltd
        • Overview
        • Product Portfolio
        • Profitability by Market Segments (Product/Age /Sales Channel/Region)
        • Sales Footprint
        • Strategy Overview
          • Marketing Strategy
          • Product Strategy
          • Channel Strategy
      • Others
        • Overview
        • Product Portfolio
        • Profitability by Market Segments (Product/Age /Sales Channel/Region)
        • Sales Footprint
        • Strategy Overview
          • Marketing Strategy
          • Product Strategy
          • Channel Strategy
  20. Assumptions & Acronyms Used
  21. Research Methodology

List of Tables

  • Table 1: Global Market Value (USD Million) Forecast by Region, 2020-2035
  • Table 2: Global Market Volume in (tons) Forecast by Region, 2020-2035
  • Table 3: Global Market Value (USD Million) Forecast by Source, 2020-2035
  • Table 4: Global Market Volume in (tons) Forecast by Source, 2020-2035
  • Table 5: Global Market Value (USD Million) Forecast by Application, 2020-2035
  • Table 6: Global Market Volume in (tons) Forecast by Application, 2020-2035
  • Table 7: Global Market Value (USD Million) Forecast by Form, 2020-2035
  • Table 8: Global Market Volume in (tons) Forecast by Form, 2020-2035
  • Table 9: North America Market Value (USD Million) Forecast by Country, 2020-2035
  • Table 10: North America Market Volume in (tons) Forecast by Country, 2020-2035
  • Table 11: North America Market Value (USD Million) Forecast by Source, 2020-2035
  • Table 12: North America Market Volume in (tons) Forecast by Source, 2020-2035
  • Table 13: North America Market Value (USD Million) Forecast by Application, 2020-2035
  • Table 14: North America Market Volume in (tons) Forecast by Application, 2020-2035
  • Table 15: North America Market Value (USD Million) Forecast by Form, 2020-2035
  • Table 16: North America Market Volume in (tons) Forecast by Form, 2020-2035
  • Table 17: Latin America Market Value (USD Million) Forecast by Country, 2020-2035
  • Table 18: Latin America Market Volume in (tons) Forecast by Country, 2020-2035
  • Table 19: Latin America Market Value (USD Million) Forecast by Source, 2020-2035
  • Table 20: Latin America Market Volume in (tons) Forecast by Source, 2020-2035
  • Table 21: Latin America Market Value (USD Million) Forecast by Application, 2020-2035
  • Table 22: Latin America Market Volume in (tons) Forecast by Application, 2020-2035
  • Table 23: Latin America Market Value (USD Million) Forecast by Form, 2020-2035
  • Table 24: Latin America Market Volume in (tons) Forecast by Form, 2020-2035
  • Table 25: Western Europe Market Value (USD Million) Forecast by Country, 2020-2035
  • Table 26: Western Europe Market Volume in (tons) Forecast by Country, 2020-2035
  • Table 27: Western Europe Market Value (USD Million) Forecast by Source, 2020-2035
  • Table 28: Western Europe Market Volume in (tons) Forecast by Source, 2020-2035
  • Table 29: Western Europe Market Value (USD Million) Forecast by Application, 2020-2035
  • Table 30: Western Europe Market Volume in (tons) Forecast by Application, 2020-2035
  • Table 31: Western Europe Market Value (USD Million) Forecast by Form, 2020-2035
  • Table 32: Western Europe Market Volume in (tons) Forecast by Form, 2020-2035
  • Table 33: Eastern Europe Market Value (USD Million) Forecast by Country, 2020-2035
  • Table 34: Eastern Europe Market Volume in (tons) Forecast by Country, 2020-2035
  • Table 35: Eastern Europe Market Value (USD Million) Forecast by Source, 2020-2035
  • Table 36: Eastern Europe Market Volume in (tons) Forecast by Source, 2020-2035
  • Table 37: Eastern Europe Market Value (USD Million) Forecast by Application, 2020-2035
  • Table 38: Eastern Europe Market Volume in (tons) Forecast by Application, 2020-2035
  • Table 39: Eastern Europe Market Value (USD Million) Forecast by Form, 2020-2035
  • Table 40: Eastern Europe Market Volume in (tons) Forecast by Form, 2020-2035
  • Table 41: East Asia Market Value (USD Million) Forecast by Country, 2020-2035
  • Table 42: East Asia Market Volume in (tons) Forecast by Country, 2020-2035
  • Table 43: East Asia Market Value (USD Million) Forecast by Source, 2020-2035
  • Table 44: East Asia Market Volume in (tons) Forecast by Source, 2020-2035
  • Table 45: East Asia Market Value (USD Million) Forecast by Application, 2020-2035
  • Table 46: East Asia Market Volume in (tons) Forecast by Application, 2020-2035
  • Table 47: East Asia Market Value (USD Million) Forecast by Form, 2020-2035
  • Table 48: East Asia Market Volume in (tons) Forecast by Form, 2020-2035
  • Table 49: South Asia & Pacific Market Value (USD Million) Forecast by Country, 2020-2035
  • Table 50: South Asia & Pacific Market Volume in (tons) Forecast by Country, 2020-2035
  • Table 51: South Asia & Pacific Market Value (USD Million) Forecast by Source, 2020-2035
  • Table 52: South Asia & Pacific Market Volume in (tons) Forecast by Source, 2020-2035
  • Table 53: South Asia & Pacific Market Value (USD Million) Forecast by Application, 2020-2035
  • Table 54: South Asia & Pacific Market Volume in (tons) Forecast by Application, 2020-2035
  • Table 55: South Asia & Pacific Market Value (USD Million) Forecast by Form, 2020-2035
  • Table 56: South Asia & Pacific Market Volume in (tons) Forecast by Form, 2020-2035
  • Table 57: Middle East and Africa Market Value (USD Million) Forecast by Country, 2020-2035
  • Table 58: Middle East and Africa Market Volume in (tons) Forecast by Country, 2020-2035
  • Table 59: Middle East and Africa Market Value (USD Million) Forecast by Source, 2020-2035
  • Table 60: Middle East and Africa Market Volume in (tons) Forecast by Source, 2020-2035
  • Table 61: Middle East and Africa Market Value (USD Million) Forecast by Application, 2020-2035
  • Table 62: Middle East and Africa Market Volume in (tons) Forecast by Application, 2020-2035
  • Table 63: Middle East and Africa Market Value (USD Million) Forecast by Form, 2020-2035
  • Table 64: Middle East and Africa Market Volume in (tons) Forecast by Form, 2020-2035

List of Figures

  • Figure 1: Global Market Volume in (tons) Forecast 2020-2035
  • Figure 2: Global Market Pricing Analysis
  • Figure 3: Global Market Value (USD Million) Forecast 2020-2035
  • Figure 4: Global Market Value Share and BPS Analysis by Source, 2025 and 2035
  • Figure 5: Global Market Y-o-Y Growth Comparison by Source, 2025-2035
  • Figure 6: Global Market Attractiveness Analysis by Source
  • Figure 7: Global Market Value Share and BPS Analysis by Application, 2025 and 2035
  • Figure 8: Global Market Y-o-Y Growth Comparison by Application, 2025-2035
  • Figure 9: Global Market Attractiveness Analysis by Application
  • Figure 10: Global Market Value Share and BPS Analysis by Form, 2025 and 2035
  • Figure 11: Global Market Y-o-Y Growth Comparison by Form, 2025-2035
  • Figure 12: Global Market Attractiveness Analysis by Form
  • Figure 13: Global Market Value (USD Million) Share and BPS Analysis by Region, 2025 and 2035
  • Figure 14: Global Market Y-o-Y Growth Comparison by Region, 2025-2035
  • Figure 15: Global Market Attractiveness Analysis by Region
  • Figure 16: North America Market Incremental $ Opportunity, 2025-2035
  • Figure 17: Latin America Market Incremental $ Opportunity, 2025-2035
  • Figure 18: Western Europe Market Incremental $ Opportunity, 2025-2035
  • Figure 19: Eastern Europe Market Incremental $ Opportunity, 2025-2035
  • Figure 20: East Asia Market Incremental $ Opportunity, 2025-2035
  • Figure 21: South Asia & Pacific Market Incremental $ Opportunity, 2025-2035
  • Figure 22: Middle East and Africa Market Incremental $ Opportunity, 2025-2035
  • Figure 23: North America Market Value Share and BPS Analysis by Country, 2025 and 2035
  • Figure 24: North America Market Value Share and BPS Analysis by Source, 2025 and 2035
  • Figure 25: North America Market Y-o-Y Growth Comparison by Source, 2025-2035
  • Figure 26: North America Market Attractiveness Analysis by Source
  • Figure 27: North America Market Value Share and BPS Analysis by Application, 2025 and 2035
  • Figure 28: North America Market Y-o-Y Growth Comparison by Application, 2025-2035
  • Figure 29: North America Market Attractiveness Analysis by Application
  • Figure 30: North America Market Value Share and BPS Analysis by Form, 2025 and 2035
  • Figure 31: North America Market Y-o-Y Growth Comparison by Form, 2025-2035
  • Figure 32: North America Market Attractiveness Analysis by Form
  • Figure 33: Latin America Market Value Share and BPS Analysis by Country, 2025 and 2035
  • Figure 34: Latin America Market Value Share and BPS Analysis by Source, 2025 and 2035
  • Figure 35: Latin America Market Y-o-Y Growth Comparison by Source, 2025-2035
  • Figure 36: Latin America Market Attractiveness Analysis by Source
  • Figure 37: Latin America Market Value Share and BPS Analysis by Application, 2025 and 2035
  • Figure 38: Latin America Market Y-o-Y Growth Comparison by Application, 2025-2035
  • Figure 39: Latin America Market Attractiveness Analysis by Application
  • Figure 40: Latin America Market Value Share and BPS Analysis by Form, 2025 and 2035
  • Figure 41: Latin America Market Y-o-Y Growth Comparison by Form, 2025-2035
  • Figure 42: Latin America Market Attractiveness Analysis by Form
  • Figure 43: Western Europe Market Value Share and BPS Analysis by Country, 2025 and 2035
  • Figure 44: Western Europe Market Value Share and BPS Analysis by Source, 2025 and 2035
  • Figure 45: Western Europe Market Y-o-Y Growth Comparison by Source, 2025-2035
  • Figure 46: Western Europe Market Attractiveness Analysis by Source
  • Figure 47: Western Europe Market Value Share and BPS Analysis by Application, 2025 and 2035
  • Figure 48: Western Europe Market Y-o-Y Growth Comparison by Application, 2025-2035
  • Figure 49: Western Europe Market Attractiveness Analysis by Application
  • Figure 50: Western Europe Market Value Share and BPS Analysis by Form, 2025 and 2035
  • Figure 51: Western Europe Market Y-o-Y Growth Comparison by Form, 2025-2035
  • Figure 52: Western Europe Market Attractiveness Analysis by Form
  • Figure 53: Eastern Europe Market Value Share and BPS Analysis by Country, 2025 and 2035
  • Figure 54: Eastern Europe Market Value Share and BPS Analysis by Source, 2025 and 2035
  • Figure 55: Eastern Europe Market Y-o-Y Growth Comparison by Source, 2025-2035
  • Figure 56: Eastern Europe Market Attractiveness Analysis by Source
  • Figure 57: Eastern Europe Market Value Share and BPS Analysis by Application, 2025 and 2035
  • Figure 58: Eastern Europe Market Y-o-Y Growth Comparison by Application, 2025-2035
  • Figure 59: Eastern Europe Market Attractiveness Analysis by Application
  • Figure 60: Eastern Europe Market Value Share and BPS Analysis by Form, 2025 and 2035
  • Figure 61: Eastern Europe Market Y-o-Y Growth Comparison by Form, 2025-2035
  • Figure 62: Eastern Europe Market Attractiveness Analysis by Form
  • Figure 63: East Asia Market Value Share and BPS Analysis by Country, 2025 and 2035
  • Figure 64: East Asia Market Value Share and BPS Analysis by Source, 2025 and 2035
  • Figure 65: East Asia Market Y-o-Y Growth Comparison by Source, 2025-2035
  • Figure 66: East Asia Market Attractiveness Analysis by Source
  • Figure 67: East Asia Market Value Share and BPS Analysis by Application, 2025 and 2035
  • Figure 68: East Asia Market Y-o-Y Growth Comparison by Application, 2025-2035
  • Figure 69: East Asia Market Attractiveness Analysis by Application
  • Figure 70: East Asia Market Value Share and BPS Analysis by Form, 2025 and 2035
  • Figure 71: East Asia Market Y-o-Y Growth Comparison by Form, 2025-2035
  • Figure 72: East Asia Market Attractiveness Analysis by Form
  • Figure 73: South Asia & Pacific Market Value Share and BPS Analysis by Country, 2025 and 2035
  • Figure 74: South Asia & Pacific Market Value Share and BPS Analysis by Source, 2025 and 2035
  • Figure 75: South Asia & Pacific Market Y-o-Y Growth Comparison by Source, 2025-2035
  • Figure 76: South Asia & Pacific Market Attractiveness Analysis by Source
  • Figure 77: South Asia & Pacific Market Value Share and BPS Analysis by Application, 2025 and 2035
  • Figure 78: South Asia & Pacific Market Y-o-Y Growth Comparison by Application, 2025-2035
  • Figure 79: South Asia & Pacific Market Attractiveness Analysis by Application
  • Figure 80: South Asia & Pacific Market Value Share and BPS Analysis by Form, 2025 and 2035
  • Figure 81: South Asia & Pacific Market Y-o-Y Growth Comparison by Form, 2025-2035
  • Figure 82: South Asia & Pacific Market Attractiveness Analysis by Form
  • Figure 83: Middle East and Africa Market Value Share and BPS Analysis by Country, 2025 and 2035
  • Figure 84: Middle East and Africa Market Value Share and BPS Analysis by Source, 2025 and 2035
  • Figure 85: Middle East and Africa Market Y-o-Y Growth Comparison by Source, 2025-2035
  • Figure 86: Middle East and Africa Market Attractiveness Analysis by Source
  • Figure 87: Middle East and Africa Market Value Share and BPS Analysis by Application, 2025 and 2035
  • Figure 88: Middle East and Africa Market Y-o-Y Growth Comparison by Application, 2025-2035
  • Figure 89: Middle East and Africa Market Attractiveness Analysis by Application
  • Figure 90: Middle East and Africa Market Value Share and BPS Analysis by Form, 2025 and 2035
  • Figure 91: Middle East and Africa Market Y-o-Y Growth Comparison by Form, 2025-2035
  • Figure 92: Middle East and Africa Market Attractiveness Analysis by Form
  • Figure 93: Global Market - Tier Structure Analysis
  • Figure 94: Global Market - Company Share Analysis

Frequently Asked Questions

What is the estimated market size of the egg emulsifier industry in 2025?

The industry is valued at USD 261.4 million in 2025.

What is the projected industry size of the egg emulsifier industry by 2035?

It is forecasted to reach USD 492.3 million by 2035.

What is the expected CAGR for the egg emulsifier industry between 2025 and 2035?

The industry is anticipated to grow at a CAGR of 6.2% during this period.

Which segment is expected to lead the egg emulsifier market in 2025?

Egg Yolk are projected to lead the market with a 67.2% share in 2025.

Which region is expected to witness the highest growth in the egg emulsifier market?

Asia Pacific, particularly India, is expected to be the key growth region with a projected growth rate of 6.1%.

Explore Similar Insights

Future Market Insights

Egg Emulsifier Market