Powder Dispenser Market Size and Share Forecast Outlook from 2025 to 2035

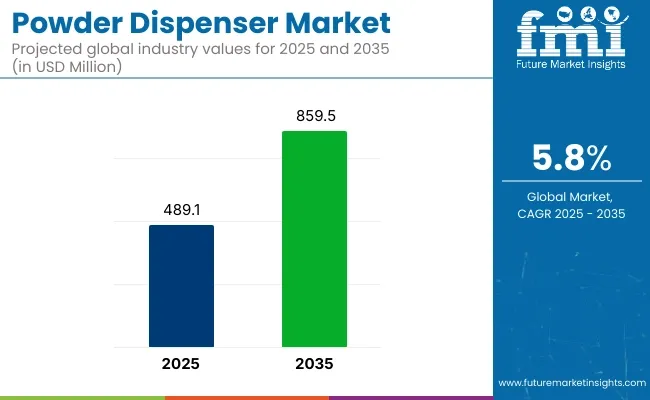
The powder dispenser market is projected to grow from USD 489.1 million in 2025 to USD 859.5 million by 2035, registering a CAGR of 5.8% during the forecast period. Sales in 2024 reached USD 462.2 million, underscoring the sector's resilience and growing demand across pharmaceuticals, food and beverage, cosmetics, and chemical industries. This growth is attributed to the increasing need for precise, hygienic, and efficient powder handling solutions that enhance product quality and meet stringent regulatory standards.
Powder Dispenser Market

Attributes Description
Estimated Market Size (2025E) USD 489.1 million
Projected Market Value (2035F) USD 859.5 million
Value-based CAGR (2025 to 2035) 5.8% 

GOJO announced introduction of the Next Generation in Dispensing Technology - the PURELL® ES10. The newest dispensing system offers less maintenance, less waste, a sleeker design, and a softer dispensing sound. "The ES10 Dispensing System is our simplest and most sustainable touch-free dispensing system and there is nothing like it in the industry today," said Stephanie Schneider, Chief Product Officer. "At GOJO, we are problem solvers.

Our team thrives on understanding important human problems and bringing innovative well-being solutions to our customers that meet their needs and provide the best hand hygiene solutions to their patrons, patients, and employees. It is this passion for learning that drove the development of our newest dispensing system that leapfrogs all other systems with less maintenance, less waste, and more ways to impress."

The shift towards sustainable and environmentally friendly solutions has significantly influenced the powder dispenser market. Manufacturers have been focusing on developing dispensers that are recyclable, biodegradable, and made from renewable resources. Innovations include the integration of biodegradable materials, modular designs, and the use of recycled components to reduce environmental impact.

These advancements align with global sustainability goals and regulatory requirements, making powder dispensers an attractive option for environmentally conscious industries. Additionally, the development of automated dispensing systems has enhanced efficiency and consistency in production processes, further driving market growth.

The powder dispenser market is poised for significant growth, driven by increasing demand in pharmaceuticals, food and beverage, and cosmetics industries. Companies investing in sustainable materials, innovative designs, and eco-friendly production processes are expected to gain a competitive edge.

As global supply chains expand and environmental regulations become more stringent, the adoption of powder dispensers is anticipated to rise, offering cost-effective and eco-friendly solutions for product packaging and dispensing. Furthermore, the integration of smart technologies and automation in powder dispenser applications is expected to enhance operational efficiency and meet the evolving needs of various industries.

Analyzing Powder Dispenser Market by Top Investment Segments

Automatic Dispensing Mode Expected to Dominate Due to Precision and Operational Efficiency

Automatic powder dispensers are projected to capture approximately 55.3% of the global powder dispenser market by 2025, as they have been widely integrated into industrial and commercial settings that require consistent dosing, reduced human intervention, and contamination-free processing. These dispensers have been engineered to support high-volume operations with minimal variance, especially in environments governed by hygiene and safety regulations.

Controlled dispensing has been enabled through programmable settings, load cell integration, and real-time monitoring systems. Touchless operation and automated shutoff functions have further contributed to their use in pharmaceutical compounding, food formulation, and manufacturing lines involving bulk powder transfer.
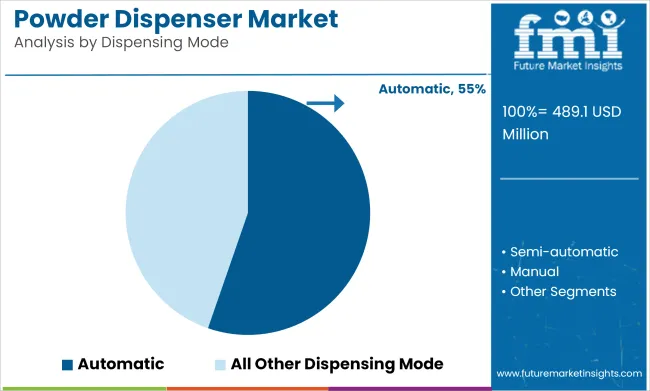
Powder Dispenser Market Analysis By Dispensing Mode

Automatic systems have been preferred in settings where workflow continuity, labor efficiency, and ingredient traceability are prioritized. Their compatibility with filling lines, mixing stations, and sealed containers has allowed seamless incorporation into automated production frameworks. As precision, product integrity, and cost-efficiency continue to shape material handling processes, automatic dispensers are expected to remain the most widely adopted dispensing mode, driven by their scalability, reliability, and compatibility with digital manufacturing systems.

Food and Beverages Segment Projected to Lead Owing to High-Volume Formulation and Quality Assurance Needs

The food and beverages industry is forecasted to dominate the powder dispenser market by 2025, holding an estimated 34.7% market share, due to its extensive use of powdered ingredients in the formulation of bakery products, instant beverages, dairy mixes, nutritional supplements, spices, and flavoring agents.

Powder dispensers have been employed to ensure consistent ingredient delivery, maintain batch accuracy, and meet hygiene standards across large-scale production facilities. Automated and semi-automated dispensers have been utilized in dry food blending operations, where measured dosing of powders such as flour, sugar, protein isolates, and thickeners has been required. These systems have supported HACCP-compliant processes, minimizing cross-contamination and operator exposure.
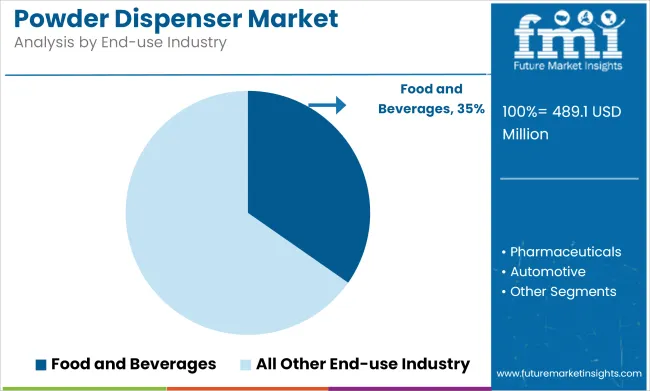
Powder Dispenser Market Analysis By End Use Industry

Dispenser systems have also been adopted in beverage manufacturing, particularly for powdered drink mixes, where uniformity, dust control, and moisture protection have been critical. The ability to pre-program dispensing cycles has facilitated seamless integration with continuous or batch production formats. As food processors continue to optimize quality control, throughput, and regulatory compliance, powder dispensers are expected to maintain strong relevance in this sector. Their deployment has been further supported by increasing demand for ready-to-eat, fortified, and personalized nutrition products worldwide.

Market Drivers

Pharma Companies Increase the Demand for Automatic Powder Dispensers

The need for accurate powder dispensing systems is being driven by pharmaceutical businesses' increasing use of automated manufacturing processes. This is especially critical for clinical trial materials and small-batch specialty drugs, where precision is essential. Maintaining high standards of quality requires accurate dispensing equipment, which is becoming increasingly important as more businesses move toward automation.

Personalized Nutrition Products Require Precise Powder Measurements

Rising consumer interest in personalized nutrition and supplements is fueling demand in health food stores and nutrition centers. These businesses require accurate powder dispensing systems to cater to specific dietary needs. Likewise, the expansion of coffee shops and specialty beverage retailers has created a market demand for powder dispensing systems that can precisely handle powdered ingredients like cocoa, protein supplements, and flavoring agents.

Research Labs and Industries Require Enclosed Powder Dispensers

Workplace safety is a prime focus for companies. There is a higher need for enclosed powder dispensing systems that lower exposure in industrial settings. For use in chemical and material science research, research labs are also looking for accurate powder dispensing devices. The need for user-friendly powder dispensing solutions for consumers buying dry goods and spices is also being fueled by the growth of self-service bulk grocery stores.

Market Restraints

High Initial Investment is a Deterrent for Small Businesses

High initial investment costs for automated powder dispensing systems are a significant challenge, especially for small businesses and startups. These high initial expenses makes it tough for smaller companies to invest, despite the long-term operational benefits. This financial barrier hinders adoption in many industries.

Maintaining Accuracy of Dispensing can be Challenging

Another significant issue is maintaining uniform dispensing accuracy across several powder kinds with differing densities and flow characteristics. Product quality may be impacted by dispensing errors brought on by the difficulty of managing such variations. In sectors like pharmaceuticals, where extreme precision is essential, this is especially worrisome. Furthermore, operations may be disrupted by the need for routine maintenance and possible downtime problems, particularly in high-volume applications where uptime is crucial.

Key Market Trend Highlights

The integration of IoT capabilities in industrial powder dispensing systems is a key trend, allowing for remote monitoring and automated inventory management. This technology enhances operational efficiency by providing real-time data on dispenser performance and stock levels, enabling businesses to optimize their supply chains and minimize downtime with proactive maintenance.

Modular dispensing systems are gaining traction, offering the flexibility to be reconfigured for different powder types and portion sizes. This adaptability is particularly beneficial for businesses with diverse product lines, allowing them to easily switch between powders without needing separate dispensers. Such systems enhance efficiency and reduce operational complexity.

Anti-static and moisture-control features are essential for dispensing hygroscopic and sensitive powders, ensuring product quality. Additionally, UV sterilization and antimicrobial surface treatments are being incorporated into food-grade dispensers to meet hygiene standards.

The adoption of smart calibration systems is also increasing, enabling automatic adjustments based on powder characteristics for optimal dispensing accuracy.

Consumer Trend Highlights

Due to hygienic considerations, touchless dispensing devices are becoming more and more popular in public and retail settings. In an effort to reduce the spread of germs, consumers are increasingly searching for contact-free alternatives. These systems are especially well-liked in busy places like cafes and grocery stores since they provide comfort and security.

Compact countertop dispensers have become popular, particularly for usage at home with goods like protein powders, coffee, and vitamins. These dispensers make it simple for customers to handle their portioning requirements. The growth is a reflection of the growing need for effective and personalized at-home solutions.

Additionally, consumers' growing awareness of sustainability is fueling the market for dispensing solutions with recyclable components and low waste. Furthermore, for accurate portion control, dispensers with digital displays and accurate measurement indicators are preferred. The adoption of subscription-based powder products, combined with compatible dispensing systems, is also on the rise, offering convenience and regular supply to customers.

Regional Insights

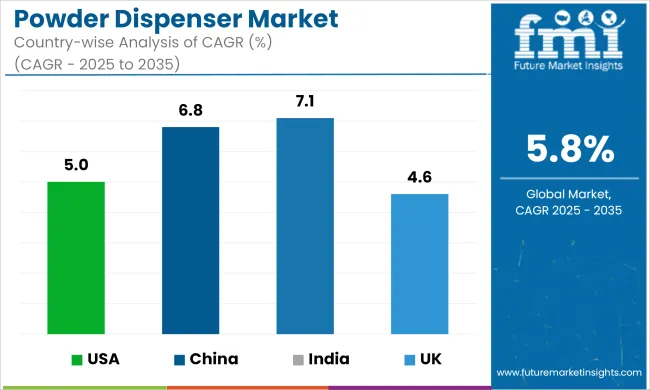
Countries CAGR
USA 5.0%
China 6.8%
India 7.1%
UK 4.6%
Powder Dispenser Market Cagr Analysis By Country

United States- Consumers Prefer Smart Powder Dispensers

Consumer preferences have shifted towards smart powder dispensers with IoT connectivity and mobile app integration, particularly in urban households and small businesses. Apogee Powder Systems and PowderTech Solutions have responded by introducing AI-enabled dispensers with predictive maintenance features and consumption tracking capabilities.

The market has seen increased demand for compact, aesthetically pleasing dispensers for home use, especially for coffee and nutritional supplements. Companies like AutoMeasure and SmartDose Technologies have focused on developing subscription-based models combining premium dispensers with regular powder deliveries.

China- Powder Dispensers Contribute to the Growth of Smart Vending Machines Sales

Chinese consumers have embraced automated powder dispensers in bubble tea shops and modern coffee chains, driving innovation in multi-powder dispensing systems. Local manufacturers like Shanghai PowderTech and Beijing AutoFill have developed specialized dispensers with touchscreen interfaces and QR code payment integration.

The market has experienced strong growth in smart vending machines featuring powder dispensers. Companies have focused on developing cloud-connected systems that enable remote monitoring and automated inventory management for commercial applications.

India- Affordable Powder Dispensers for Small Retail Shops are in Demand

Indian consumers have shown increasing interest in affordable powder dispensers for small retail shops and tea stalls. Companies like Pune Dispensing Solutions and Delhi AutoMech have introduced entry-level automated dispensers with basic features at competitive price points.

The market has seen growth in demand for dispensers with battery backup features due to power fluctuations. Manufacturers have focused on developing robust, low-maintenance systems suitable for harsh environmental conditions and heavy usage.

UK- User-friendly Interfaces Increase the Popularity of Powder Dispensers

British consumers have gravitated towards eco-friendly powder dispensers with reusable container compatibility and energy-efficient features. Market leaders like PrecisionPour UK and AutoDispense Systems have introduced recycling programs for old dispensers and developed energy-monitoring capabilities.

The focus has shifted to premium dispensers with customizable settings for specialty coffee shops and health food stores. Businesses have made investments in creating intuitive user interfaces and offering thorough training courses to clients.

Germany- Powder dispenser manufacturers place a high priority on precision.

For industrial and pharmaceutical applications in particular, German consumers have placed a high value on accuracy and dependability in powder dispensing systems. Companies like TechnoDispense and PräzisionSystem have focused on developing high-precision dispensers with advanced calibration features.

The market has seen increased adoption of modular dispensing systems allowing for easy upgrades and maintenance. Manufacturers have emphasized developing systems compliant with strict industrial standards while maintaining energy efficiency and minimal waste generation.

Key Companies

Company Name Company Expertise
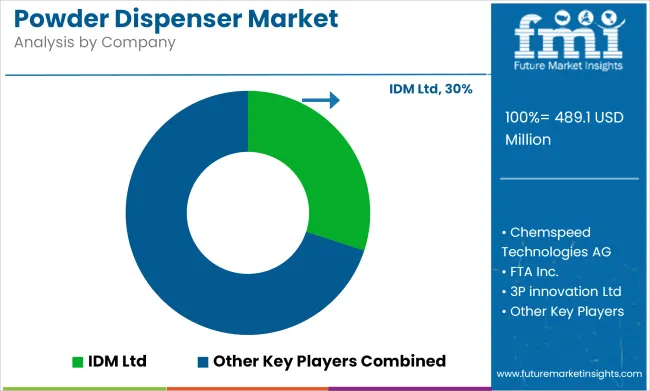
IDM Ltd Specializes in powder dispensing solutions for various industries.
Capsugel Expertise in capsule filling and powder dispensing systems, particularly in pharmaceuticals.
Chemspeed Technologies AG Focuses on automated dispensing and high-precision laboratory equipment.
FTA Inc. Known for powder dispensing technology for industrial and food applications.

Powder Dispenser Market Analysis By Company

Competitive Landscape

Software integration capabilities are becoming a crucial differentiator in the powder dispenser market. Established companies are producing in-house systems for tracking consumption of powders. This gives organizations a better control, and provides precise and effective dispensing. These cutting-edge systems are enhancing operations.

High-precision dispensers for pharmaceutical applications are being introduced by laboratory manufacturers, while coffee equipment manufacturers are taking advantage of their current connections with coffee shops to provide customized dispensers for powdered ingredients. In their respective domains, both segments are generating fierce competition. Both segments are creating strong competition in their respective fields.

Asian manufacturers are dominating the compact dispenser segment, especially for home use, by offering innovative designs and competitive pricing. These dispensers are increasingly popular due to their affordability and functionality. Additionally, startups focusing on IoT-enabled dispensers for the supplement and nutrition market have garnered significant investment, enhancing competition and innovation across the industry.

Market Strategies

One important trend is the creation of hybrid dispensing systems, which enables companies to manage several powder kinds with fast-change mechanisms. Businesses that frequently need to swap between different components will find this operational flexibility especially useful as it increases productivity and eliminates the need for additional dispensers.Subscription-based models are being implemented to reduce initial investment barriers for customers.

Due to their ability to improve customer service and operational efficiency, mobile apps for remote dispenser monitoring and maintenance scheduling are growing in popularity. Businesses may improve overall operational management and reduce downtime in high-demandareas by using these apps to analyze inventory levels, plan maintenance, and monitor dispenser function.

Powder producers and dispensing system suppliers are working together for providing adjusted and customized solutions for different products. Such partnerships ensure that dispensers are used according to the characteristics of specific powder types. This results in better handling, higher accuracy, and uniformity in dispensing. This also enhances product quality and reduces waste during the dispensing process.

High-end automated systems are now available for lease with maintenance packages, giving smaller enterprises more economical access to cutting-edge technology. Customers can also begin with basic models and progressively add functionality as their needs change thanks to modular upgrade paths. Recertification and refurbishment programs for second-hand dispensers further promote sustainability and cost-efficiency.

Key Players

  • IDM Ltd
  • Capsugel
  • Chemspeed Technologies AG
  • FTA Inc.
  • 3P innovation Ltd
  • Gironex
  • METTLER TOLEDO
  • Laboratorios Suavinex
  • XQ instruments
  • Lleal, S.A.U.

Segmentation

By Product Type:

  • Wall Mounted
  • Counter Top

By Size:

  • The market is sub-segmented into below 1 liter
  • 1 liter to 5 liter
  • 6 liters to 10 liters
  • 11 liters to 15 liters
  • and more than 15 liters

By Dispensing Mode:

  • The market is sub-segmented into automatic
  • Semi-automatic
  • Manual

By End-use Industry:

  • Pharmaceuticals
  • Food and beverages
  • Automotive
  • Textiles & apparel
  • Household
  • Healthcare
  • Cosmetics

By Region:

  • North America
  • Latin America
  • Western Europe
  • Eastern Europe
  • East Asia
  • South Asia and Pacific
  • Middle East and Africa

Table of Content

  1. Executive Summary
  2. Industry Introduction with Taxonomy and Market Definition
  3. Trends and Success Factors including Macro-economic Factors, Market Dynamics, Recent Industry Developments
  4. Global Market Demand Analysis 2020 to 2024 and Forecast 2025 to 2035, Historical Analysis, Future Projections
  5. Pricing Analysis
  6. Global Market Analysis 2020 to 2024 and Forecast 2025 to 2035
    • Product Type
    • Size
    • Dispensing Mode
    • End-use Industry
  7. Global Market Analysis 2020 to 2024 and Forecast 2025 to 2035, By Product Type
    • Wall Mounted
    • Counter Top
  8. Global Market Analysis 2020 to 2024 and Forecast 2025 to 2035, By Size
    • Below 1 Liter
    • 1 Liter to 5 Liter
    • 6 Liters to 10 Liters
    • 11 Liters to 15 Liters
    • More than 15 Liters
  9. Global Market Analysis 2020 to 2024 and Forecast 2025 to 2035, By Dispensing Mode
    • Automatic
    • Semi-automatic
    • Manual
  10. Global Market Analysis 2020 to 2024 and Forecast 2025 to 2035, By End-use Industry
    • Pharmaceuticals
    • Food and Beverages
    • Automotive
    • Textiles & Apparel
    • Household
    • Healthcare
    • Cosmetics
  11. Global Market Analysis 2020 to 2024 and Forecast 2025 to 2035, By Region
    • North America
    • Latin America
    • Western Europe
    • Eastern Europe
    • East Asia
    • South Asia and Pacific
    • Middle East and Africa
  12. North America Sales Analysis 2020 to 2024 and Forecast 2025 to 2035, by Key Segments and Countries
  13. Latin America Sales Analysis 2020 to 2024 and Forecast 2025 to 2035, by Key Segments and Countries
  14. Western Europe Sales Analysis 2020 to 2024 and Forecast 2025 to 2035, by Key Segments and Countries
  15. Eastern Europe Sales Analysis 2020 to 2024 and Forecast 2025 to 2035, by Key Segments and Countries
  16. East Asia Sales Analysis 2020 to 2024 and Forecast 2025 to 2035, by Key Segments and Countries
  17. South Asia and Pacific Sales Analysis 2020 to 2024 and Forecast 2025 to 2035, by Key Segments and Countries
  18. Middle East and Africa Sales Analysis 2020 to 2024 and Forecast 2025 to 2035, by Key Segments and Countries
  19. Sales Forecast to 2035 by Product Type, Size, Dispensing Mode, and End-use Industry for 30 Countries
  20. Competitive Assessment, Company Share Analysis by Key Players, and Competition Dashboard
  21. Company Profiles
    • IDM Ltd
    • Capsugel
    • Chemspeed Technologies AG
    • FTA Inc.
    • 3P innovation Ltd
    • Gironex
    • METTLER TOLEDO
    • Laboratorios Suavinex
    • XQ instruments
    • Lleal, S.A.U.

List of Tables

  • Table 01: Global Market Value (US$ Million) Forecast by Region, 2020 to 2035
  • Table 02: Global Market Volume (Units) Forecast by Region, 2020 to 2035
  • Table 03: Global Market Value (US$ Million) Forecast by Automation, 2020 to 2035
  • Table 04: Global Market Volume (Units) Forecast by Automation, 2020 to 2035
  • Table 05: Global Market Value (US$ Million) Forecast by End Use, 2020 to 2035
  • Table 06: Global Market Volume (Units) Forecast by End Use, 2020 to 2035
  • Table 07: Global Market Value (US$ Million) Forecast by End-user, 2020 to 2035
  • Table 08: Global Market Volume (Units) Forecast by End-user, 2020 to 2035
  • Table 09: North America Market Value (US$ Million) Forecast by Country, 2020 to 2035
  • Table 10: North America Market Volume (Units) Forecast by Country, 2020 to 2035
  • Table 11: North America Market Value (US$ Million) Forecast by Automation, 2020 to 2035
  • Table 12: North America Market Volume (Units) Forecast by Automation, 2020 to 2035
  • Table 13: North America Market Value (US$ Million) Forecast by End Use, 2020 to 2035
  • Table 14: North America Market Volume (Units) Forecast by End Use, 2020 to 2035
  • Table 15: North America Market Value (US$ Million) Forecast by End-user, 2020 to 2035
  • Table 16: North America Market Volume (Units) Forecast by End-user, 2020 to 2035
  • Table 17: Latin America Market Value (US$ Million) Forecast by Country, 2020 to 2035
  • Table 18: Latin America Market Volume (Units) Forecast by Country, 2020 to 2035
  • Table 19: Latin America Market Value (US$ Million) Forecast by Automation, 2020 to 2035
  • Table 20: Latin America Market Volume (Units) Forecast by Automation, 2020 to 2035
  • Table 21: Latin America Market Value (US$ Million) Forecast by End Use, 2020 to 2035
  • Table 22: Latin America Market Volume (Units) Forecast by End Use, 2020 to 2035
  • Table 23: Latin America Market Value (US$ Million) Forecast by End-user, 2020 to 2035
  • Table 24: Latin America Market Volume (Units) Forecast by End-user, 2020 to 2035
  • Table 25: Europe Market Value (US$ Million) Forecast by Country, 2020 to 2035
  • Table 26: Europe Market Volume (Units) Forecast by Country, 2020 to 2035
  • Table 27: Europe Market Value (US$ Million) Forecast by Automation, 2020 to 2035
  • Table 28: Europe Market Volume (Units) Forecast by Automation, 2020 to 2035
  • Table 29: Europe Market Value (US$ Million) Forecast by End Use, 2020 to 2035
  • Table 30: Europe Market Volume (Units) Forecast by End Use, 2020 to 2035
  • Table 31: Europe Market Value (US$ Million) Forecast by End-user, 2020 to 2035
  • Table 32: Europe Market Volume (Units) Forecast by End-user, 2020 to 2035
  • Table 33: East Asia Market Value (US$ Million) Forecast by Country, 2020 to 2035
  • Table 34: East Asia Market Volume (Units) Forecast by Country, 2020 to 2035
  • Table 35: East Asia Market Value (US$ Million) Forecast by Automation, 2020 to 2035
  • Table 36: East Asia Market Volume (Units) Forecast by Automation, 2020 to 2035
  • Table 37: East Asia Market Value (US$ Million) Forecast by End Use, 2020 to 2035
  • Table 38: East Asia Market Volume (Units) Forecast by End Use, 2020 to 2035
  • Table 39: East Asia Market Value (US$ Million) Forecast by End-user, 2020 to 2035
  • Table 40: East Asia Market Volume (Units) Forecast by End-user, 2020 to 2035
  • Table 41: South Asia Market Value (US$ Million) Forecast by Country, 2020 to 2035
  • Table 42: South Asia Market Volume (Units) Forecast by Country, 2020 to 2035
  • Table 43: South Asia Market Value (US$ Million) Forecast by Automation, 2020 to 2035
  • Table 44: South Asia Market Volume (Units) Forecast by Automation, 2020 to 2035
  • Table 45: South Asia Market Value (US$ Million) Forecast by End Use, 2020 to 2035
  • Table 46: South Asia Market Volume (Units) Forecast by End Use, 2020 to 2035
  • Table 47: South Asia Market Value (US$ Million) Forecast by End-user, 2020 to 2035
  • Table 48: South Asia Market Volume (Units) Forecast by End-user, 2020 to 2035
  • Table 49: Oceania Market Value (US$ Million) Forecast by Country, 2020 to 2035
  • Table 50: Oceania Market Volume (Units) Forecast by Country, 2020 to 2035
  • Table 51: Oceania Market Value (US$ Million) Forecast by Automation, 2020 to 2035
  • Table 52: Oceania Market Volume (Units) Forecast by Automation, 2020 to 2035
  • Table 53: Oceania Market Value (US$ Million) Forecast by End Use, 2020 to 2035
  • Table 54: Oceania Market Volume (Units) Forecast by End Use, 2020 to 2035
  • Table 55: Oceania Market Value (US$ Million) Forecast by End-user, 2020 to 2035
  • Table 56: Oceania Market Volume (Units) Forecast by End-user, 2020 to 2035
  • Table 57: Middle East and Africa Market Value (US$ Million) Forecast by Country, 2020 to 2035
  • Table 58: Middle East and Africa Market Volume (Units) Forecast by Country, 2020 to 2035
  • Table 59: Middle East and Africa Market Value (US$ Million) Forecast by Automation, 2020 to 2035
  • Table 60: Middle East and Africa Market Volume (Units) Forecast by Automation, 2020 to 2035
  • Table 61: Middle East and Africa Market Value (US$ Million) Forecast by End Use, 2020 to 2035
  • Table 62: Middle East and Africa Market Volume (Units) Forecast by End Use, 2020 to 2035
  • Table 63: Middle East and Africa Market Value (US$ Million) Forecast by End-user, 2020 to 2035
  • Table 64: Middle East and Africa Market Volume (Units) Forecast by End-user, 2020 to 2035
  • Table 65: USA Market Value (US$ Million) Forecast by Automation, End Use, and End-user (2025(E) & 2035(F))
  • Table 66: Canada Market Value (US$ Million) Forecast by Automation, End Use, and End-user (2025(E) & 2035(F))
  • Table 67: Brazil Market Value (US$ Million) Forecast by Automation, End Use, and End-user (2025(E) & 2035(F))
  • Table 68: Mexico Market Value (US$ Million) Forecast by Automation, End Use, and End-user (2025(E) & 2035(F))
  • Table 69: Germany Market Value (US$ Million) Forecast by Automation, End Use, and End-user (2025(E) & 2035(F))
  • Table 70: Italy Market Value (US$ Million) Forecast by Automation, End Use, and End-user (2025(E) & 2035(F))
  • Table 71: France Market Value (US$ Million) Forecast by Automation, End Use, and End-user (2025(E) & 2035(F))
  • Table 72: Spain Market Value (US$ Million) Forecast by Automation, End Use, and End-user (2025(E) & 2035(F))
  • Table 73: UK Market Value (US$ Million) Forecast by Automation, End Use, and End-user (2025(E) & 2035(F))
  • Table 74: Russia Market Value (US$ Million) Forecast by Automation, End Use, and End-user (2025(E) & 2035(F))
  • Table 75: China Market Value (US$ Million) Forecast by Automation, End Use, and End-user (2025(E) & 2035(F))
  • Table 76: Japan Market Value (US$ Million) Forecast by Automation, End Use, and End-user (2025(E) & 2035(F))
  • Table 77: India Market Value (US$ Million) Forecast by Automation, End Use, and End-user (2025(E) & 2035(F))
  • Table 78: GCC Countries Market Value (US$ Million) Forecast by Automation, End Use, and End-user (2025(E) & 2035(F))
  • Table 79: Australia Market Value (US$ Million) Forecast by Automation, End Use, and End-user (2025(E) & 2035(F))

List of Figures

  • Figure 01: Global Market Value (US$ Million) by Automation, 2025 to 2035
  • Figure 02: Global Market Value (US$ Million) by End Use, 2025 to 2035
  • Figure 03: Global Market Value (US$ Million) by End-user, 2025 to 2035
  • Figure 04: Global Market Value (US$ Million) by Region, 2025 to 2035
  • Figure 05: Global Market Value (US$ Million) Analysis by Region, 2020 to 2024
  • Figure 06: Global Market Volume (Units) Analysis by Region, 2020 to 2035
  • Figure 07: Global Market Value Share (%) and BPS Analysis by Region, 2025 to 2035
  • Figure 08: Global Market Y-o-Y Growth (%) Projections by Region, 2025 to 2035
  • Figure 09: Global Market Value (US$ Million) Analysis by Automation, 2020 to 2024
  • Figure 10: Global Market Volume (Units) Analysis by Automation, 2020 to 2035
  • Figure 11: Global Market Value Share (%) and BPS Analysis by Automation, 2025 to 2035
  • Figure 12: Global Market Y-o-Y Growth (%) Projections by Automation, 2025 to 2035
  • Figure 13: Global Market Value (US$ Million) Analysis by End Use, 2020 to 2024
  • Figure 14: Global Market Volume (Units) Analysis by End Use, 2020 to 2035
  • Figure 15: Global Market Value Share (%) and BPS Analysis by End Use, 2025 to 2035
  • Figure 16: Global Market Y-o-Y Growth (%) Projections by End Use, 2025 to 2035
  • Figure 17: Global Market Value (US$ Million) Analysis by End-user, 2020 to 2024
  • Figure 18: Global Market Volume (Units) Analysis by End-user, 2020 to 2035
  • Figure 19: Global Market Value Share (%) and BPS Analysis by End-user, 2025 to 2035
  • Figure 20: Global Market Y-o-Y Growth (%) Projections by End-user, 2025 to 2035
  • Figure 21: Global Market Attractiveness by Automation, 2025 to 2035
  • Figure 22: Global Market Attractiveness by End Use, 2025 to 2035
  • Figure 23: Global Market Attractiveness by End-user, 2025 to 2035
  • Figure 24: Global Market Attractiveness by End-user, 2025 to 2035
  • Figure 25: Global Market Attractiveness by Region, 2025 to 2035
  • Figure 26: North America Market Value (US$ Million) by Automation, 2025 to 2035
  • Figure 27: North America Market Value (US$ Million) by End Use, 2025 to 2035
  • Figure 28: North America Market Value (US$ Million) by End-user, 2025 to 2035
  • Figure 29: North America Market Value (US$ Million) by Country, 2025 to 2035
  • Figure 30: North America Market Value (US$ Million) Analysis by Country, 2020 to 2024
  • Figure 31: North America Market Volume (Units) Analysis by Country, 2020 to 2035
  • Figure 32: North America Market Value Share (%) and BPS Analysis by Country, 2025 to 2035
  • Figure 33: North America Market Y-o-Y Growth (%) Projections by Country, 2025 to 2035
  • Figure 34: North America Market Value (US$ Million) Analysis by Automation, 2020 to 2024
  • Figure 35: North America Market Volume (Units) Analysis by Automation, 2020 to 2035
  • Figure 36: North America Market Value Share (%) and BPS Analysis by Automation, 2025 to 2035
  • Figure 37: North America Market Y-o-Y Growth (%) Projections by Automation, 2025 to 2035
  • Figure 38: North America Market Value (US$ Million) Analysis by End Use, 2020 to 2024
  • Figure 39: North America Market Volume (Units) Analysis by End Use, 2020 to 2035
  • Figure 40: North America Market Value Share (%) and BPS Analysis by End Use, 2025 to 2035
  • Figure 41: North America Market Y-o-Y Growth (%) Projections by End Use, 2025 to 2035
  • Figure 42: North America Market Value (US$ Million) Analysis by End-user, 2020 to 2024
  • Figure 43: North America Market Volume (Units) Analysis by End-user, 2020 to 2035
  • Figure 44: North America Market Value Share (%) and BPS Analysis by End-user, 2025 to 2035
  • Figure 45: North America Market Y-o-Y Growth (%) Projections by End-user, 2025 to 2035
  • Figure 46: North America Market Attractiveness by Automation, 2025 to 2035
  • Figure 47: North America Market Attractiveness by End Use, 2025 to 2035
  • Figure 48: North America Market Attractiveness by End-user, 2025 to 2035
  • Figure 49: North America Market Attractiveness by Country, 2025 to 2035
  • Figure 50: Latin America Market Value (US$ Million) by Automation, 2025 to 2035
  • Figure 51: Latin America Market Value (US$ Million) by End Use, 2025 to 2035
  • Figure 52: Latin America Market Value (US$ Million) by End-user, 2025 to 2035
  • Figure 53: Latin America Market Value (US$ Million) by Country, 2025 to 2035
  • Figure 54: Latin America Market Value (US$ Million) Analysis by Country, 2020 to 2024
  • Figure 55: Latin America Market Volume (Units) Analysis by Country, 2020 to 2035
  • Figure 56: Latin America Market Value Share (%) and BPS Analysis by Country, 2025 to 2035
  • Figure 57: Latin America Market Y-o-Y Growth (%) Projections by Country, 2025 to 2035
  • Figure 58: Latin America Market Value (US$ Million) Analysis by Automation, 2020 to 2024
  • Figure 59: Latin America Market Volume (Units) Analysis by Automation, 2020 to 2035
  • Figure 60: Latin America Market Value Share (%) and BPS Analysis by Automation, 2025 to 2035
  • Figure 61: Latin America Market Y-o-Y Growth (%) Projections by Automation, 2025 to 2035
  • Figure 62: Latin America Market Value (US$ Million) Analysis by End Use, 2020 to 2024
  • Figure 63: Latin America Market Volume (Units) Analysis by End Use, 2020 to 2035
  • Figure 64: Latin America Market Value Share (%) and BPS Analysis by End Use, 2025 to 2035
  • Figure 65: Latin America Market Y-o-Y Growth (%) Projections by End Use, 2025 to 2035
  • Figure 66: Latin America Market Value (US$ Million) Analysis by End-user, 2020 to 2024
  • Figure 67: Latin America Market Volume (Units) Analysis by End-user, 2020 to 2035
  • Figure 68: Latin America Market Value Share (%) and BPS Analysis by End-user, 2025 to 2035
  • Figure 69: Latin America Market Y-o-Y Growth (%) Projections by End-user, 2025 to 2035
  • Figure 70: Latin America Market Attractiveness by Automation, 2025 to 2035
  • Figure 71: Latin America Market Attractiveness by End Use, 2025 to 2035
  • Figure 72: Latin America Market Attractiveness by End-user, 2025 to 2035
  • Figure 73: Latin America Market Attractiveness by Country, 2025 to 2035
  • Figure 74: Europe Market Value (US$ Million) by Automation, 2025 to 2035
  • Figure 75: Europe Market Value (US$ Million) by End Use, 2025 to 2035
  • Figure 76: Europe Market Value (US$ Million) by End-user, 2025 to 2035
  • Figure 77: Europe Market Value (US$ Million) by Country, 2025 to 2035
  • Figure 78: Europe Market Value (US$ Million) Analysis by Country, 2020 to 2024
  • Figure 79: Europe Market Volume (Units) Analysis by Country, 2020 to 2035
  • Figure 80: Europe Market Value Share (%) and BPS Analysis by Country, 2025 to 2035
  • Figure 81: Europe Market Y-o-Y Growth (%) Projections by Country, 2025 to 2035
  • Figure 82: Europe Market Value (US$ Million) Analysis by Automation, 2020 to 2024
  • Figure 83: Europe Market Volume (Units) Analysis by Automation, 2020 to 2035
  • Figure 84: Europe Market Value Share (%) and BPS Analysis by Automation, 2025 to 2035
  • Figure 85: Europe Market Y-o-Y Growth (%) Projections by Automation, 2025 to 2035
  • Figure 86: Europe Market Value (US$ Million) Analysis by End Use, 2020 to 2024
  • Figure 87: Europe Market Volume (Units) Analysis by End Use, 2020 to 2035
  • Figure 88: Europe Market Value Share (%) and BPS Analysis by End Use, 2025 to 2035
  • Figure 89: Europe Market Y-o-Y Growth (%) Projections by End Use, 2025 to 2035
  • Figure 90: Europe Market Value (US$ Million) Analysis by End-user, 2020 to 2024
  • Figure 91: Europe Market Volume (Units) Analysis by End-user, 2020 to 2035
  • Figure 92: Europe Market Value Share (%) and BPS Analysis by End-user, 2025 to 2035
  • Figure 93: Europe Market Y-o-Y Growth (%) Projections by End-user, 2025 to 2035
  • Figure 94: Europe Market Attractiveness by Automation, 2025 to 2035
  • Figure 95: Europe Market Attractiveness by End Use, 2025 to 2035
  • Figure 96: Europe Market Attractiveness by End-user, 2025 to 2035
  • Figure 97: Europe Market Attractiveness by Country, 2025 to 2035
  • Figure 98: East Asia Market Value (US$ Million) by Automation, 2025 to 2035
  • Figure 99: East Asia Market Value (US$ Million) by End Use, 2025 to 2035
  • Figure 100: East Asia Market Value (US$ Million) by End-user, 2025 to 2035
  • Figure 101: East Asia Market Value (US$ Million) by Country, 2025 to 2035
  • Figure 102: East Asia Market Value (US$ Million) Analysis by Country, 2020 to 2024
  • Figure 103: East Asia Market Volume (Units) Analysis by Country, 2020 to 2035
  • Figure 104: East Asia Market Value Share (%) and BPS Analysis by Country, 2025 to 2035
  • Figure 105: East Asia Market Y-o-Y Growth (%) Projections by Country, 2025 to 2035
  • Figure 106: East Asia Market Value (US$ Million) Analysis by Automation, 2020 to 2024
  • Figure 107: East Asia Market Volume (Units) Analysis by Automation, 2020 to 2035
  • Figure 108: East Asia Market Value Share (%) and BPS Analysis by Automation, 2025 to 2035
  • Figure 109: East Asia Market Y-o-Y Growth (%) Projections by Automation, 2025 to 2035
  • Figure 110: East Asia Market Value (US$ Million) Analysis by End Use, 2020 to 2024
  • Figure 111: East Asia Market Volume (Units) Analysis by End Use, 2020 to 2035
  • Figure 112: East Asia Market Value Share (%) and BPS Analysis by End Use, 2025 to 2035
  • Figure 113: East Asia Market Y-o-Y Growth (%) Projections by End Use, 2025 to 2035
  • Figure 114: East Asia Market Value (US$ Million) Analysis by End-user, 2020 to 2024
  • Figure 115: East Asia Market Volume (Units) Analysis by End-user, 2020 to 2035
  • Figure 116: East Asia Market Value Share (%) and BPS Analysis by End-user, 2025 to 2035
  • Figure 117: East Asia Market Y-o-Y Growth (%) Projections by End-user, 2025 to 2035
  • Figure 118: East Asia Market Attractiveness by Automation, 2025 to 2035
  • Figure 119: East Asia Market Attractiveness by End Use, 2025 to 2035
  • Figure 120: East Asia Market Attractiveness by End-user, 2025 to 2035
  • Figure 121: East Asia Market Attractiveness by Country, 2025 to 2035
  • Figure 122: South Asia Market Value (US$ Million) by Automation, 2025 to 2035
  • Figure 123: South Asia Market Value (US$ Million) by End Use, 2025 to 2035
  • Figure 124: South Asia Market Value (US$ Million) by End-user, 2025 to 2035
  • Figure 125: South Asia Market Value (US$ Million) by Country, 2025 to 2035
  • Figure 126: South Asia Market Value (US$ Million) Analysis by Country, 2020 to 2024
  • Figure 127: South Asia Market Volume (Units) Analysis by Country, 2020 to 2035
  • Figure 128: South Asia Market Value Share (%) and BPS Analysis by Country, 2025 to 2035
  • Figure 129: South Asia Market Y-o-Y Growth (%) Projections by Country, 2025 to 2035
  • Figure 130: South Asia Market Value (US$ Million) Analysis by Automation, 2020 to 2024
  • Figure 131: South Asia Market Volume (Units) Analysis by Automation, 2020 to 2035
  • Figure 132: South Asia Market Value Share (%) and BPS Analysis by Automation, 2025 to 2035
  • Figure 133: South Asia Market Y-o-Y Growth (%) Projections by Automation, 2025 to 2035
  • Figure 134: South Asia Market Value (US$ Million) Analysis by End Use, 2020 to 2024
  • Figure 135: South Asia Market Volume (Units) Analysis by End Use, 2020 to 2035
  • Figure 136: South Asia Market Value Share (%) and BPS Analysis by End Use, 2025 to 2035
  • Figure 137: South Asia Market Y-o-Y Growth (%) Projections by End Use, 2025 to 2035
  • Figure 138: South Asia Market Value (US$ Million) Analysis by End-user, 2020 to 2024
  • Figure 139: South Asia Market Volume (Units) Analysis by End-user, 2020 to 2035
  • Figure 140: South Asia Market Value Share (%) and BPS Analysis by End-user, 2025 to 2035
  • Figure 141: South Asia Market Y-o-Y Growth (%) Projections by End-user, 2025 to 2035
  • Figure 142: South Asia Market Attractiveness by Automation, 2025 to 2035
  • Figure 143: South Asia Market Attractiveness by End Use, 2025 to 2035
  • Figure 144: South Asia Market Attractiveness by End-user, 2025 to 2035
  • Figure 145: South Asia Market Attractiveness by Country, 2025 to 2035
  • Figure 146: Oceania Market Value (US$ Million) by Automation, 2025 to 2035
  • Figure 147: Oceania Market Value (US$ Million) by End Use, 2025 to 2035
  • Figure 148: Oceania Market Value (US$ Million) by End-user, 2025 to 2035
  • Figure 149: Oceania Market Value (US$ Million) by Country, 2025 to 2035
  • Figure 150: Oceania Market Value (US$ Million) Analysis by Country, 2020 to 2024
  • Figure 151: Oceania Market Volume (Units) Analysis by Country, 2020 to 2035
  • Figure 152: Oceania Market Value Share (%) and BPS Analysis by Country, 2025 to 2035
  • Figure 153: Oceania Market Y-o-Y Growth (%) Projections by Country, 2025 to 2035
  • Figure 154: Oceania Market Value (US$ Million) Analysis by Automation, 2020 to 2024
  • Figure 155: Oceania Market Volume (Units) Analysis by Automation, 2020 to 2035
  • Figure 156: Oceania Market Value Share (%) and BPS Analysis by Automation, 2025 to 2035
  • Figure 157: Oceania Market Y-o-Y Growth (%) Projections by Automation, 2025 to 2035
  • Figure 158: Oceania Market Value (US$ Million) Analysis by End Use, 2020 to 2024
  • Figure 159: Oceania Market Volume (Units) Analysis by End Use, 2020 to 2035
  • Figure 160: Oceania Market Value Share (%) and BPS Analysis by End Use, 2025 to 2035
  • Figure 161: Oceania Market Y-o-Y Growth (%) Projections by End Use, 2025 to 2035
  • Figure 162: Oceania Market Value (US$ Million) Analysis by End-user, 2020 to 2024
  • Figure 163: Oceania Market Volume (Units) Analysis by End-user, 2020 to 2035
  • Figure 164: Oceania Market Value Share (%) and BPS Analysis by End-user, 2025 to 2035
  • Figure 165: Oceania Market Y-o-Y Growth (%) Projections by End-user, 2025 to 2035
  • Figure 166: Oceania Market Attractiveness by Automation, 2025 to 2035
  • Figure 167: Oceania Market Attractiveness by End Use, 2025 to 2035
  • Figure 168: Oceania Market Attractiveness by End-user, 2025 to 2035
  • Figure 169: Oceania Market Attractiveness by Country, 2025 to 2035
  • Figure 170: Middle East and Africa Market Value (US$ Million) by Automation, 2025 to 2035
  • Figure 171: Middle East and Africa Market Value (US$ Million) by End Use, 2025 to 2035
  • Figure 172: Middle East and Africa Market Value (US$ Million) by End-user, 2025 to 2035
  • Figure 173: Middle East and Africa Market Value (US$ Million) by Country, 2025 to 2035
  • Figure 174: Middle East and Africa Market Value (US$ Million) Analysis by Country, 2020 to 2024
  • Figure 175: Middle East and Africa Market Volume (Units) Analysis by Country, 2020 to 2035
  • Figure 176: Middle East and Africa Market Value Share (%) and BPS Analysis by Country, 2025 to 2035
  • Figure 177: Middle East and Africa Market Y-o-Y Growth (%) Projections by Country, 2025 to 2035
  • Figure 178: Middle East and Africa Market Value (US$ Million) Analysis by Automation, 2020 to 2024
  • Figure 179: Middle East and Africa Market Volume (Units) Analysis by Automation, 2020 to 2035
  • Figure 180: Middle East and Africa Market Value Share (%) and BPS Analysis by Automation, 2025 to 2035
  • Figure 181: Middle East and Africa Market Y-o-Y Growth (%) Projections by Automation, 2025 to 2035
  • Figure 182: Middle East and Africa Market Value (US$ Million) Analysis by End Use, 2020 to 2024
  • Figure 183: Middle East and Africa Market Volume (Units) Analysis by End Use, 2020 to 2035
  • Figure 184: Middle East and Africa Market Value Share (%) and BPS Analysis by End Use, 2025 to 2035
  • Figure 185: Middle East and Africa Market Y-o-Y Growth (%) Projections by End Use, 2025 to 2035
  • Figure 186: Middle East and Africa Market Value (US$ Million) Analysis by End-user, 2020 to 2024
  • Figure 187: Middle East and Africa Market Volume (Units) Analysis by End-user, 2020 to 2035
  • Figure 188: Middle East and Africa Market Value Share (%) and BPS Analysis by End-user, 2025 to 2035
  • Figure 189: Middle East and Africa Market Y-o-Y Growth (%) Projections by End-user, 2025 to 2035
  • Figure 190: Middle East and Africa Market Attractiveness by Automation, 2025 to 2035
  • Figure 191: Middle East and Africa Market Attractiveness by End Use, 2025 to 2035
  • Figure 192: Middle East and Africa Market Attractiveness by End-user, 2025 to 2035
  • Figure 193: Middle East and Africa Market Attractiveness by Country, 2025 to 2035

Frequently Asked Questions

How big is the powder dispenser market?

The market was valued at USD 489.1 million in 2025.

What is the outlook on powder dispenser sales?

The market is predicted to reach a size of USD 859.5 million by 2035.

Who are the major powder dispenser manufacturers?

Some of the key companies manufacturing powder dispensers include IDM Ltd, Capsugel, Chemspeed Technologies AG, and others.

Which region is likely to create lucrative opportunities for powder dispenser manufacturers?

India is expected to be a prominent hub for powder dispenser manufacturers.

Explore Similar Insights

Future Market Insights

Powder Dispenser Market