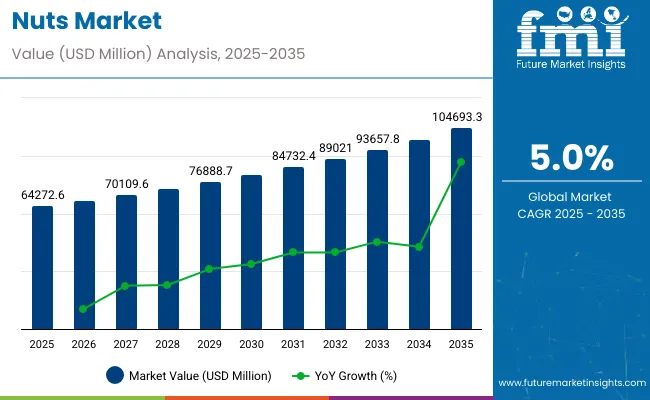
The global nuts market is estimated to account for USD 64,272.60 million in 2025. It is anticipated to grow at a CAGR of 5.0% during the assessment period and reach a value of USD 104,693.3 million by 2035.
Market Outlook
Attributes | Description |
---|---|
Estimated Global Nuts Market Size (2025E) | USD 64,272.60 million |
Projected Global Nuts Market Value (2035F) | USD 104,693.3 million |
Value-based CAGR (2025 to 2035) | 5.0% |
2020 to 2024 | 2025 to 2035 |
---|---|
The nuts market experienced steady growth driven by rising consumer awareness about health benefits, increasing demand for plant-based proteins, and expanding applications in the food and beverage sector. Growth was also supported by innovations in packaging and value-added nut-based products. | The market is expected to witness accelerated growth due to increasing preference for plant-based diets, higher demand for sustainable and ethically sourced nuts, and expansion in emerging markets. Advanced processing technologies and automation will further enhance production efficiency and supply chain resilience. |
Health-conscious consumers, plant-based eating trends, increasing use of nuts in dairy alternatives (such as almond milk and cashew cheese), and growing popularity of premium and organic nut varieties. The COVID-19 pandemic also heightened demand for immune-boosting and nutritious foods. | Sustainability concerns, rising demand for functional foods with specific health benefits (such as heart health and brain function), advancements in precision agriculture for better yield, and government policies promoting sustainable farming and fair trade practices. |
Almonds, walnuts, cashews, and pistachios were the most in-demand nuts, with significant growth in consumption due to their use in snacks, bakery, and dairy alternatives. High-protein and low-carb diets also supported the demand for certain nuts like almonds. | Macadamia nuts, Brazil nuts, and hazelnuts are expected to gain more traction due to increasing use in high-end confectionery and premium health foods. Exotic and lesser-known nuts may enter mainstream markets as consumers seek variety and sustainability in their choices. |
North America and Europe dominated the market due to high consumer awareness and strong distribution networks. Asia-Pacific saw rapid growth due to increasing middle-class income and changing dietary habits. The Middle East also witnessed rising demand for nuts in confectionery and traditional foods. | Africa and Latin America will experience higher market penetration due to increased investments in sustainable farming and processing facilities. Asia-Pacific will continue its expansion, particularly in China and India, as demand for healthy and functional foods rises. |
The industry made early efforts in sustainable farming, with initiatives to reduce pesticide use, improve water management, and introduce biodegradable packaging. However, widespread adoption remained slow due to high costs. | Advanced sustainability practices will become a necessity, with regenerative agriculture, carbon-neutral production, and eco-friendly packaging becoming industry standards. Companies will be under greater pressure to ensure ethical sourcing and fair labor practices. |
AI-driven sorting and quality control systems were increasingly adopted to improve efficiency and reduce waste. Blockchain technology began gaining attention for enhancing supply chain transparency, but adoption remained limited. | Blockchain and IoT (Internet of Things) will be fully integrated into the supply chain to enhance traceability, ensure food safety, and optimize logistics. Robotics and automation will play a bigger role in nut processing and packaging, improving efficiency and reducing labor costs. |
Climate change negatively affected nut yields, with unpredictable weather patterns leading to supply fluctuations. Water scarcity was a growing concern, particularly for water- intensive nuts like almonds. Supply chain disruptions, particularly due to the COVID-19 pandemic, caused price volatility. | Water scarcity and land-use conflicts will continue to pose challenges, with stricter environmental regulations impacting large-scale nut farming. Sustainability compliance and ethical sourcing requirements will become more rigorous, forcing producers to adopt greener practices. |
Increased snacking culture, rising demand for high-protein, plant-based, and keto-friendly diets, and growing preference for organic and minimally processed nuts. Consumers showed a greater inclination toward convenient, single-serve nut packaging for on-the-go consumption. | Functional nutrition will drive demand, with nuts being marketed for specific health benefits like cognitive function, heart health, and immunity boosting. Clean-label, organic, and non-GMO certifications will become essential, and personalized nutrition will influence product offerings based on consumer health data. |
Nut prices fluctuated due to supply chain disruptions, trade restrictions, and climate-related production challenges. However, demand remained strong, helping the industry recover from temporary setbacks. | Prices are expected to stabilize as production efficiency improves and supply chain management becomes more resilient. However, premium and organic nuts will continue to command higher prices due to increased consumer willingness to pay for quality and sustainability. |
Stricter regulations on pesticide use, food safety standards, and environmental sustainability influenced production and supply chains. Trade policies and tariffs affected global nut exports and imports. | Governments worldwide will implement stricter sustainability and fair-trade compliance measures, affecting large-scale producers. Regulations on carbon emissions, ethical sourcing, and sustainable packaging will shape the future of the industry. |
Growing Demand for Premium Nuts
As per FMI analysis, consumers are looking more and more toward premium and specialty nuts as a result of high disposable incomes and changing preferences for taste. Tastes such as Macadamia, Brazil nuts, and flavored or coated almonds are being purchased more by consumers, particularly those in the urban areas seeking gourmand snacks. Exotic seasonings used in artisanal and small-batch roasted nuts, including truffle, matcha, and chili-lime, are now in vogue.
In terms of nut type, the widely consumed nuts are peanuts. Peanuts are inexpensive, widely available, and versatile. They are used in snacks, peanut butter, cooking oils, and confectionery. Due to their high protein content, they are also popular among health-conscious consumers and athletes. Peanuts are a staple ingredient in many Asian, African, and American cuisines.
Attributes | Details |
---|---|
Top Product Type | Powder |
Market Share in 2025 | 30.0% |
Nut powders retain the necessary vitamins, minerals, and healthy fats found in whole nuts. Thus, it can be easily taken as a convenient source of plant-based protein, fiber, and antioxidants. They are more popular among bodybuilders, vegetarians, and consumers seeking healthy foods for heart health or high protein intake.
Attributes | Details |
---|---|
Top End-use Industry | Food Processing |
Market Share in 2025 | 35.0% |
The food processing industry is expected to remain the leader in the nut market as producers continue to add nuts to more types of foods. These nuts are increasingly utilized in dairy alternative formulations, plant-based meat substitute preparations, confectionery applications, and bakery products due to growing demand for healthy and functional ingredients.
Premiumization trends and consumer predisposition toward healthy indulgence are expected to spur the growth of premium nut-based products, such as artisanal chocolates, protein-enriched granola, and specialty nut butters. Growth in vegan and flexitarian diets will also benefit the use of nuts in developing plant-based food, further growing market opportunities for food processors.
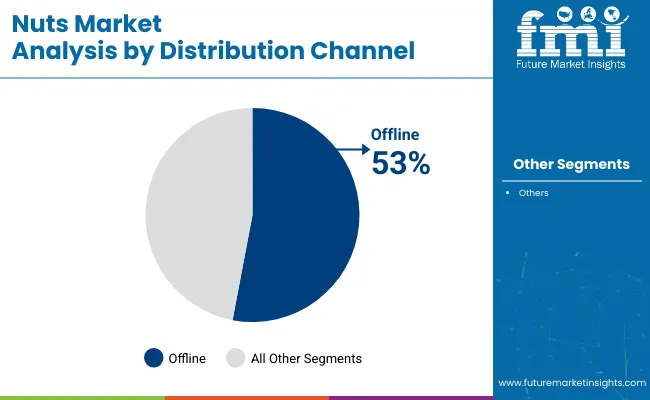
Offline Segment: Supermarkets and specialty stores will continue to dominate nut sales due to consumer preference for in-store selection, bulk buying options, and private-label offerings. However, the segment’s growth may slow as e-commerce penetration rises.
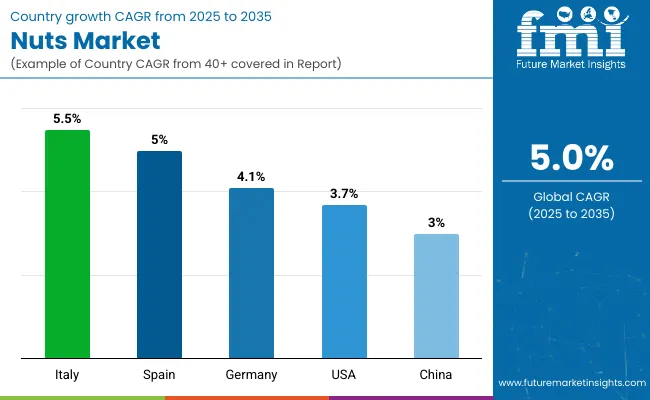
Countries | CAGR (2025 to 2035) |
---|---|
United States | 3.7% |
Germany | 4.1% |
China | 3.0% |
Spain | 5.0% |
Italy | 5.5% |
The United States nut market is projected to grow at a CAGR of 3.7% during 2025 to 2035. Rising cafes and bakeries in the United States will drive the market in the United States. Nuts are integral ingredients in baked goods, desserts, and artisanal candies.
With health-conscious awareness in the American consumer's psyche, nut-based protein bars, energy snacks, and organic nut blends have grown in popularity. Almonds, walnuts, and cashews are now becoming staple items for everyday consumption as the western world turns more and more toward plant-based diets and alternative sources of protein.
Growth in mergers and acquisitions, the expected way since 4.1% CAGR would prevail from 2025 to 2035. Companies in Germany pick up as many start-ups possible to upgrade their stakes in this premium nut market. Organics and special products like Naughty Nuts, also acquired by Bulgarian Smart Organic look for acquiring and merging.
Recently, almonds, cashews, and walnuts have been a part of functional foods and dietary supplements, therefore high demand has been observed in the market. Higher recognition regarding health benefits for cardiovascular and cognitive stature boosts up the sale of nuts in Germany.
China is anticipated to experience CAGR of 3.0% during the period of 2025 to 2035 for the nuts market. Demand is expected to surge for macadamia nuts. The nut, which is highly healthy and easy to consume as a snack, is increasing market size.
Consumer integration of nuts into their diet is rising since the richness of nuts with proteins, fiber, and healthy fats has increased the demand for it. Its usage in bakery and confectionery products is also increasing, particularly in premium desserts and festive sweets. Nut-based packaged snacks such as trail mixes and nut bars are growing fast in China owing to the busy urban lifestyle.
The market in Spain is likely to grow at a 5.0% CAGR between 2025 and 2035, primarily driven by the tremendous growth in the production of almonds in the country. The country is adding very high areas to almond cultivation and is likely to add more than 16,000 new hectares to the market.
Organic nuts, especially almonds and hazelnuts, are sought after by health-conscious consumers. This includes an increase in nuts use within the bakery, confectionery, and dairy industries, which positively impact sales in Spain. Other positive factors driving the market are plant-based diets and natural protein sources preferences.
The market is expected to be growing at 5.5% CAGR in the years between 2025 and 2035 based on the growth of health benefit awareness. One of the principal consumers of Italy is hazelnuts and almonds, whose consumption has increased incrementally over time. Recently, the demand for protein bars and nut-based snack foods has risen as a more healthy substitute compared to the common snack foods.
While functional food manufacturers are opting for nuts as part of their product lines, they would also attract health-conscious consumers. Italian confectionery is increasingly using nuts in chocolate and dessert preparations, which will help in increasing the market size.
The nut market in India is expected to grow between 2025 and 2035 with the rise in consumption of nut-based sweets and snacks.. Demand for nut-enriched protein bars and energy snacks increases among the fit enthusiasts and professionals. Festivals are now being complemented with almond, cashew, and pistachio-sweet confections.
Companies are launching innovation nut-based products in the categories of confectionery that adapts changing demands of the market. For example, Kookie Jar launched a caramelized nuts and honey-flavored Diwali special dessert in November 2023, which reflects an increased use of nuts in the food culture in India.
The global nut industry is dominated by a few of the players that have significant ownership positions across the majority of the production, processing, and distribution chain. Nuts are grown worldwide; however, because Tier 1 companies hold supply chains in which they vertically integrate, because of proprietary breeding practices, and have large retail relationships, these Tier 1 players have significant sway.
The concentration of the almond industry is mostly in California. Firms, for example, Blue Diamond Growers, take center stage processing and exporting it. Advanced agriculture techniques, rigid quality control mechanisms, and the largest global network of distribution establish standards for an industry like the firms of Blue Diamond. Analogous to that, large-scale corporations controlling the pistachio industry have their grip on supplies with vertically integrated operations from growing to retail packaging.
Cashews are mainly produced in Vietnam, India, and Africa, relying on a few major processors for shelling and refining to maintain quality and adhere to international standards. Hazelnuts, which are mainly grown in Turkey, are also largely controlled by a few processing firms that have supply contracts with the large multinational food and confectionery companies for long-term supply.
Strategic investments in research and development enable Tier 1 companies to increase productivity, manage climate risks, and develop new varietals that are optimized for higher yields and pest resistance. Advanced logistics further solidifies the position of industry leaders through temperature-controlled storage and just-in-time shipping to ensure consistent supply to major retailers.
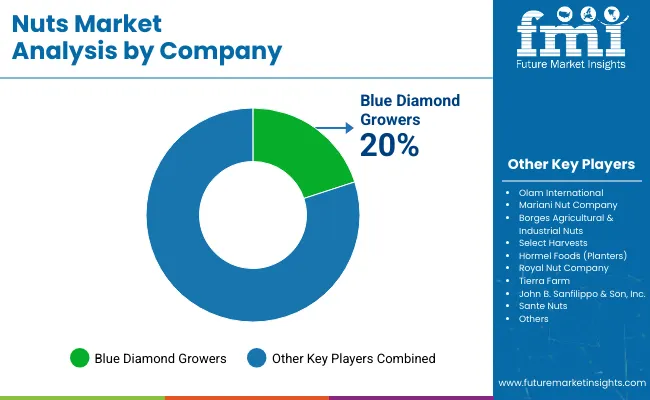
The market is highly competitive in 2024, where key players, such as Mondelez International and Olam Group, innovated their portfolios. In this regard, Mondelez introduced new flavors and healthier options to meet the growing demand for snacks that match consumer health trends, while Olam Group emphasized organic and sustainably sourced almonds, responding to the rising preference of consumers for ethical products.
Companies such as Hormel Foods and Kraft Heinz also made strategic moves. For instance, Hormel acquired a local almond-based snack brand for enhancing its presence in the marketplace, while Kraft Heinz tied up with a health-focused startup to develop nut spreads based on plants. Sustainability has become one of the primary differentiators of the industry with Diamond Foods in the lead; it invested significantly in eco-friendly packaging and brought down its carbon footprint.
Treehouse Foods also got an edge in competition by sourcing nuts through regenerative agricultural practices, which appeals to the environmentally conscious consumer.
Major Developments
BSS crossed the USD 1 billion mark in sales for the first time in its history during fiscal year 2024. Net sales grew 6.7% to USD 1.07 billion. In the first quarter of fiscal year 2025, net sales grew 18.0% to USD 276.2 million.
By Nut Type:
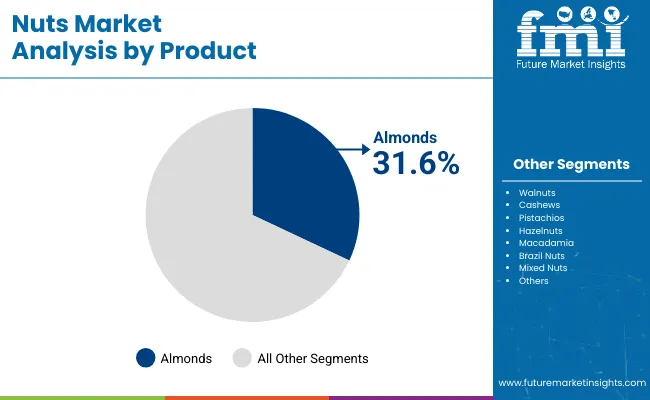
With respect to nut type, the market is classified into peanut, almond, walnut, cashew, hazelnut, pistachio, brazil nuts, chestnut, pecan, macadamia nuts, and pine nuts.
In terms of product type, the market is segmented into shelled nut, powder, splits (slice or dice), and paste.
In terms of distribution channels, the market is segmented into off lines and online.
In terms of end user, the market is divided into food processing, bakery and confectionery, breakfast solutions, bars and snacks, butter and spreads, dairy and desserts, beverages processing, and food service/HoReCa.
In terms of region, the market is segmented into North America, Europe, Asia Pacific, and Middle-East and Africa.
Table 1: Global Market Value (US$ Million) Forecast by Region, 2019 to 2034
Table 2: Global Market Volume (Tons) Forecast by Region, 2019 to 2034
Table 3: Global Market Value (US$ Million) Forecast by Product, 2019 to 2034
Table 4: Global Market Volume (Tons) Forecast by Product, 2019 to 2034
Table 5: Global Market Value (US$ Million) Forecast by Distribution Channel, 2019 to 2034
Table 6: Global Market Volume (Tons) Forecast by Distribution Channel, 2019 to 2034
Table 7: North America Market Value (US$ Million) Forecast by Country, 2019 to 2034
Table 8: North America Market Volume (Tons) Forecast by Country, 2019 to 2034
Table 9: North America Market Value (US$ Million) Forecast by Product, 2019 to 2034
Table 10: North America Market Volume (Tons) Forecast by Product, 2019 to 2034
Table 11: North America Market Value (US$ Million) Forecast by Distribution Channel, 2019 to 2034
Table 12: North America Market Volume (Tons) Forecast by Distribution Channel, 2019 to 2034
Table 13: Latin America Market Value (US$ Million) Forecast by Country, 2019 to 2034
Table 14: Latin America Market Volume (Tons) Forecast by Country, 2019 to 2034
Table 15: Latin America Market Value (US$ Million) Forecast by Product, 2019 to 2034
Table 16: Latin America Market Volume (Tons) Forecast by Product, 2019 to 2034
Table 17: Latin America Market Value (US$ Million) Forecast by Distribution Channel, 2019 to 2034
Table 18: Latin America Market Volume (Tons) Forecast by Distribution Channel, 2019 to 2034
Table 19: Western Europe Market Value (US$ Million) Forecast by Country, 2019 to 2034
Table 20: Western Europe Market Volume (Tons) Forecast by Country, 2019 to 2034
Table 21: Western Europe Market Value (US$ Million) Forecast by Product, 2019 to 2034
Table 22: Western Europe Market Volume (Tons) Forecast by Product, 2019 to 2034
Table 23: Western Europe Market Value (US$ Million) Forecast by Distribution Channel, 2019 to 2034
Table 24: Western Europe Market Volume (Tons) Forecast by Distribution Channel, 2019 to 2034
Table 25: Eastern Europe Market Value (US$ Million) Forecast by Country, 2019 to 2034
Table 26: Eastern Europe Market Volume (Tons) Forecast by Country, 2019 to 2034
Table 27: Eastern Europe Market Value (US$ Million) Forecast by Product, 2019 to 2034
Table 28: Eastern Europe Market Volume (Tons) Forecast by Product, 2019 to 2034
Table 29: Eastern Europe Market Value (US$ Million) Forecast by Distribution Channel, 2019 to 2034
Table 30: Eastern Europe Market Volume (Tons) Forecast by Distribution Channel, 2019 to 2034
Table 31: South Asia and Pacific Market Value (US$ Million) Forecast by Country, 2019 to 2034
Table 32: South Asia and Pacific Market Volume (Tons) Forecast by Country, 2019 to 2034
Table 33: South Asia and Pacific Market Value (US$ Million) Forecast by Product, 2019 to 2034
Table 34: South Asia and Pacific Market Volume (Tons) Forecast by Product, 2019 to 2034
Table 35: South Asia and Pacific Market Value (US$ Million) Forecast by Distribution Channel, 2019 to 2034
Table 36: South Asia and Pacific Market Volume (Tons) Forecast by Distribution Channel, 2019 to 2034
Table 37: East Asia Market Value (US$ Million) Forecast by Country, 2019 to 2034
Table 38: East Asia Market Volume (Tons) Forecast by Country, 2019 to 2034
Table 39: East Asia Market Value (US$ Million) Forecast by Product, 2019 to 2034
Table 40: East Asia Market Volume (Tons) Forecast by Product, 2019 to 2034
Table 41: East Asia Market Value (US$ Million) Forecast by Distribution Channel, 2019 to 2034
Table 42: East Asia Market Volume (Tons) Forecast by Distribution Channel, 2019 to 2034
Table 43: Middle East and Africa Market Value (US$ Million) Forecast by Country, 2019 to 2034
Table 44: Middle East and Africa Market Volume (Tons) Forecast by Country, 2019 to 2034
Table 45: Middle East and Africa Market Value (US$ Million) Forecast by Product, 2019 to 2034
Table 46: Middle East and Africa Market Volume (Tons) Forecast by Product, 2019 to 2034
Table 47: Middle East and Africa Market Value (US$ Million) Forecast by Distribution Channel, 2019 to 2034
Table 48: Middle East and Africa Market Volume (Tons) Forecast by Distribution Channel, 2019 to 2034
Figure 1: Global Market Value (US$ Million) by Product, 2024 to 2034
Figure 2: Global Market Value (US$ Million) by Distribution Channel, 2024 to 2034
Figure 3: Global Market Value (US$ Million) by Region, 2024 to 2034
Figure 4: Global Market Value (US$ Million) Analysis by Region, 2019 to 2034
Figure 5: Global Market Volume (Tons) Analysis by Region, 2019 to 2034
Figure 6: Global Market Value Share (%) and BPS Analysis by Region, 2024 to 2034
Figure 7: Global Market Y-o-Y Growth (%) Projections by Region, 2024 to 2034
Figure 8: Global Market Value (US$ Million) Analysis by Product, 2019 to 2034
Figure 9: Global Market Volume (Tons) Analysis by Product, 2019 to 2034
Figure 10: Global Market Value Share (%) and BPS Analysis by Product, 2024 to 2034
Figure 11: Global Market Y-o-Y Growth (%) Projections by Product, 2024 to 2034
Figure 12: Global Market Value (US$ Million) Analysis by Distribution Channel, 2019 to 2034
Figure 13: Global Market Volume (Tons) Analysis by Distribution Channel, 2019 to 2034
Figure 14: Global Market Value Share (%) and BPS Analysis by Distribution Channel, 2024 to 2034
Figure 15: Global Market Y-o-Y Growth (%) Projections by Distribution Channel, 2024 to 2034
Figure 16: Global Market Attractiveness by Product, 2024 to 2034
Figure 17: Global Market Attractiveness by Distribution Channel, 2024 to 2034
Figure 18: Global Market Attractiveness by Region, 2024 to 2034
Figure 19: North America Market Value (US$ Million) by Product, 2024 to 2034
Figure 20: North America Market Value (US$ Million) by Distribution Channel, 2024 to 2034
Figure 21: North America Market Value (US$ Million) by Country, 2024 to 2034
Figure 22: North America Market Value (US$ Million) Analysis by Country, 2019 to 2034
Figure 23: North America Market Volume (Tons) Analysis by Country, 2019 to 2034
Figure 24: North America Market Value Share (%) and BPS Analysis by Country, 2024 to 2034
Figure 25: North America Market Y-o-Y Growth (%) Projections by Country, 2024 to 2034
Figure 26: North America Market Value (US$ Million) Analysis by Product, 2019 to 2034
Figure 27: North America Market Volume (Tons) Analysis by Product, 2019 to 2034
Figure 28: North America Market Value Share (%) and BPS Analysis by Product, 2024 to 2034
Figure 29: North America Market Y-o-Y Growth (%) Projections by Product, 2024 to 2034
Figure 30: North America Market Value (US$ Million) Analysis by Distribution Channel, 2019 to 2034
Figure 31: North America Market Volume (Tons) Analysis by Distribution Channel, 2019 to 2034
Figure 32: North America Market Value Share (%) and BPS Analysis by Distribution Channel, 2024 to 2034
Figure 33: North America Market Y-o-Y Growth (%) Projections by Distribution Channel, 2024 to 2034
Figure 34: North America Market Attractiveness by Product, 2024 to 2034
Figure 35: North America Market Attractiveness by Distribution Channel, 2024 to 2034
Figure 36: North America Market Attractiveness by Country, 2024 to 2034
Figure 37: Latin America Market Value (US$ Million) by Product, 2024 to 2034
Figure 38: Latin America Market Value (US$ Million) by Distribution Channel, 2024 to 2034
Figure 39: Latin America Market Value (US$ Million) by Country, 2024 to 2034
Figure 40: Latin America Market Value (US$ Million) Analysis by Country, 2019 to 2034
Figure 41: Latin America Market Volume (Tons) Analysis by Country, 2019 to 2034
Figure 42: Latin America Market Value Share (%) and BPS Analysis by Country, 2024 to 2034
Figure 43: Latin America Market Y-o-Y Growth (%) Projections by Country, 2024 to 2034
Figure 44: Latin America Market Value (US$ Million) Analysis by Product, 2019 to 2034
Figure 45: Latin America Market Volume (Tons) Analysis by Product, 2019 to 2034
Figure 46: Latin America Market Value Share (%) and BPS Analysis by Product, 2024 to 2034
Figure 47: Latin America Market Y-o-Y Growth (%) Projections by Product, 2024 to 2034
Figure 48: Latin America Market Value (US$ Million) Analysis by Distribution Channel, 2019 to 2034
Figure 49: Latin America Market Volume (Tons) Analysis by Distribution Channel, 2019 to 2034
Figure 50: Latin America Market Value Share (%) and BPS Analysis by Distribution Channel, 2024 to 2034
Figure 51: Latin America Market Y-o-Y Growth (%) Projections by Distribution Channel, 2024 to 2034
Figure 52: Latin America Market Attractiveness by Product, 2024 to 2034
Figure 53: Latin America Market Attractiveness by Distribution Channel, 2024 to 2034
Figure 54: Latin America Market Attractiveness by Country, 2024 to 2034
Figure 55: Western Europe Market Value (US$ Million) by Product, 2024 to 2034
Figure 56: Western Europe Market Value (US$ Million) by Distribution Channel, 2024 to 2034
Figure 57: Western Europe Market Value (US$ Million) by Country, 2024 to 2034
Figure 58: Western Europe Market Value (US$ Million) Analysis by Country, 2019 to 2034
Figure 59: Western Europe Market Volume (Tons) Analysis by Country, 2019 to 2034
Figure 60: Western Europe Market Value Share (%) and BPS Analysis by Country, 2024 to 2034
Figure 61: Western Europe Market Y-o-Y Growth (%) Projections by Country, 2024 to 2034
Figure 62: Western Europe Market Value (US$ Million) Analysis by Product, 2019 to 2034
Figure 63: Western Europe Market Volume (Tons) Analysis by Product, 2019 to 2034
Figure 64: Western Europe Market Value Share (%) and BPS Analysis by Product, 2024 to 2034
Figure 65: Western Europe Market Y-o-Y Growth (%) Projections by Product, 2024 to 2034
Figure 66: Western Europe Market Value (US$ Million) Analysis by Distribution Channel, 2019 to 2034
Figure 67: Western Europe Market Volume (Tons) Analysis by Distribution Channel, 2019 to 2034
Figure 68: Western Europe Market Value Share (%) and BPS Analysis by Distribution Channel, 2024 to 2034
Figure 69: Western Europe Market Y-o-Y Growth (%) Projections by Distribution Channel, 2024 to 2034
Figure 70: Western Europe Market Attractiveness by Product, 2024 to 2034
Figure 71: Western Europe Market Attractiveness by Distribution Channel, 2024 to 2034
Figure 72: Western Europe Market Attractiveness by Country, 2024 to 2034
Figure 73: Eastern Europe Market Value (US$ Million) by Product, 2024 to 2034
Figure 74: Eastern Europe Market Value (US$ Million) by Distribution Channel, 2024 to 2034
Figure 75: Eastern Europe Market Value (US$ Million) by Country, 2024 to 2034
Figure 76: Eastern Europe Market Value (US$ Million) Analysis by Country, 2019 to 2034
Figure 77: Eastern Europe Market Volume (Tons) Analysis by Country, 2019 to 2034
Figure 78: Eastern Europe Market Value Share (%) and BPS Analysis by Country, 2024 to 2034
Figure 79: Eastern Europe Market Y-o-Y Growth (%) Projections by Country, 2024 to 2034
Figure 80: Eastern Europe Market Value (US$ Million) Analysis by Product, 2019 to 2034
Figure 81: Eastern Europe Market Volume (Tons) Analysis by Product, 2019 to 2034
Figure 82: Eastern Europe Market Value Share (%) and BPS Analysis by Product, 2024 to 2034
Figure 83: Eastern Europe Market Y-o-Y Growth (%) Projections by Product, 2024 to 2034
Figure 84: Eastern Europe Market Value (US$ Million) Analysis by Distribution Channel, 2019 to 2034
Figure 85: Eastern Europe Market Volume (Tons) Analysis by Distribution Channel, 2019 to 2034
Figure 86: Eastern Europe Market Value Share (%) and BPS Analysis by Distribution Channel, 2024 to 2034
Figure 87: Eastern Europe Market Y-o-Y Growth (%) Projections by Distribution Channel, 2024 to 2034
Figure 88: Eastern Europe Market Attractiveness by Product, 2024 to 2034
Figure 89: Eastern Europe Market Attractiveness by Distribution Channel, 2024 to 2034
Figure 90: Eastern Europe Market Attractiveness by Country, 2024 to 2034
Figure 91: South Asia and Pacific Market Value (US$ Million) by Product, 2024 to 2034
Figure 92: South Asia and Pacific Market Value (US$ Million) by Distribution Channel, 2024 to 2034
Figure 93: South Asia and Pacific Market Value (US$ Million) by Country, 2024 to 2034
Figure 94: South Asia and Pacific Market Value (US$ Million) Analysis by Country, 2019 to 2034
Figure 95: South Asia and Pacific Market Volume (Tons) Analysis by Country, 2019 to 2034
Figure 96: South Asia and Pacific Market Value Share (%) and BPS Analysis by Country, 2024 to 2034
Figure 97: South Asia and Pacific Market Y-o-Y Growth (%) Projections by Country, 2024 to 2034
Figure 98: South Asia and Pacific Market Value (US$ Million) Analysis by Product, 2019 to 2034
Figure 99: South Asia and Pacific Market Volume (Tons) Analysis by Product, 2019 to 2034
Figure 100: South Asia and Pacific Market Value Share (%) and BPS Analysis by Product, 2024 to 2034
Figure 101: South Asia and Pacific Market Y-o-Y Growth (%) Projections by Product, 2024 to 2034
Figure 102: South Asia and Pacific Market Value (US$ Million) Analysis by Distribution Channel, 2019 to 2034
Figure 103: South Asia and Pacific Market Volume (Tons) Analysis by Distribution Channel, 2019 to 2034
Figure 104: South Asia and Pacific Market Value Share (%) and BPS Analysis by Distribution Channel, 2024 to 2034
Figure 105: South Asia and Pacific Market Y-o-Y Growth (%) Projections by Distribution Channel, 2024 to 2034
Figure 106: South Asia and Pacific Market Attractiveness by Product, 2024 to 2034
Figure 107: South Asia and Pacific Market Attractiveness by Distribution Channel, 2024 to 2034
Figure 108: South Asia and Pacific Market Attractiveness by Country, 2024 to 2034
Figure 109: East Asia Market Value (US$ Million) by Product, 2024 to 2034
Figure 110: East Asia Market Value (US$ Million) by Distribution Channel, 2024 to 2034
Figure 111: East Asia Market Value (US$ Million) by Country, 2024 to 2034
Figure 112: East Asia Market Value (US$ Million) Analysis by Country, 2019 to 2034
Figure 113: East Asia Market Volume (Tons) Analysis by Country, 2019 to 2034
Figure 114: East Asia Market Value Share (%) and BPS Analysis by Country, 2024 to 2034
Figure 115: East Asia Market Y-o-Y Growth (%) Projections by Country, 2024 to 2034
Figure 116: East Asia Market Value (US$ Million) Analysis by Product, 2019 to 2034
Figure 117: East Asia Market Volume (Tons) Analysis by Product, 2019 to 2034
Figure 118: East Asia Market Value Share (%) and BPS Analysis by Product, 2024 to 2034
Figure 119: East Asia Market Y-o-Y Growth (%) Projections by Product, 2024 to 2034
Figure 120: East Asia Market Value (US$ Million) Analysis by Distribution Channel, 2019 to 2034
Figure 121: East Asia Market Volume (Tons) Analysis by Distribution Channel, 2019 to 2034
Figure 122: East Asia Market Value Share (%) and BPS Analysis by Distribution Channel, 2024 to 2034
Figure 123: East Asia Market Y-o-Y Growth (%) Projections by Distribution Channel, 2024 to 2034
Figure 124: East Asia Market Attractiveness by Product, 2024 to 2034
Figure 125: East Asia Market Attractiveness by Distribution Channel, 2024 to 2034
Figure 126: East Asia Market Attractiveness by Country, 2024 to 2034
Figure 127: Middle East and Africa Market Value (US$ Million) by Product, 2024 to 2034
Figure 128: Middle East and Africa Market Value (US$ Million) by Distribution Channel, 2024 to 2034
Figure 129: Middle East and Africa Market Value (US$ Million) by Country, 2024 to 2034
Figure 130: Middle East and Africa Market Value (US$ Million) Analysis by Country, 2019 to 2034
Figure 131: Middle East and Africa Market Volume (Tons) Analysis by Country, 2019 to 2034
Figure 132: Middle East and Africa Market Value Share (%) and BPS Analysis by Country, 2024 to 2034
Figure 133: Middle East and Africa Market Y-o-Y Growth (%) Projections by Country, 2024 to 2034
Figure 134: Middle East and Africa Market Value (US$ Million) Analysis by Product, 2019 to 2034
Figure 135: Middle East and Africa Market Volume (Tons) Analysis by Product, 2019 to 2034
Figure 136: Middle East and Africa Market Value Share (%) and BPS Analysis by Product, 2024 to 2034
Figure 137: Middle East and Africa Market Y-o-Y Growth (%) Projections by Product, 2024 to 2034
Figure 138: Middle East and Africa Market Value (US$ Million) Analysis by Distribution Channel, 2019 to 2034
Figure 139: Middle East and Africa Market Volume (Tons) Analysis by Distribution Channel, 2019 to 2034
Figure 140: Middle East and Africa Market Value Share (%) and BPS Analysis by Distribution Channel, 2024 to 2034
Figure 141: Middle East and Africa Market Y-o-Y Growth (%) Projections by Distribution Channel, 2024 to 2034
Figure 142: Middle East and Africa Market Attractiveness by Product, 2024 to 2034
Figure 143: Middle East and Africa Market Attractiveness by Distribution Channel, 2024 to 2034
Figure 144: Middle East and Africa Market Attractiveness by Country, 2024 to 2034
The nuts market is expected to grow at 5.0% CAGR during the study period.
The factor is rising demand for premium nuts.
Peanut is being widely bought in the country owing to its rising demand among consumers who are willing to pay more for premium products.
Prominent players include Diamond Foods, Inc., Mariani Nut Company, and others.
Explore Similar Insights
Thank you!
You will receive an email from our Business Development Manager. Please be sure to check your SPAM/JUNK folder too.