Demand for Nuts as snacks and ingredients in US Size and Share Forecast Outlook 2025 to 2035

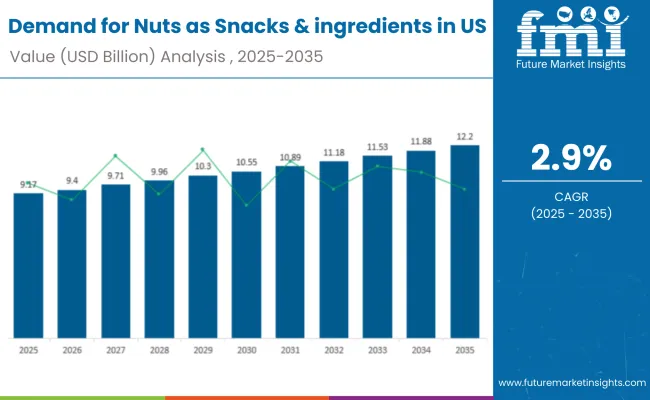
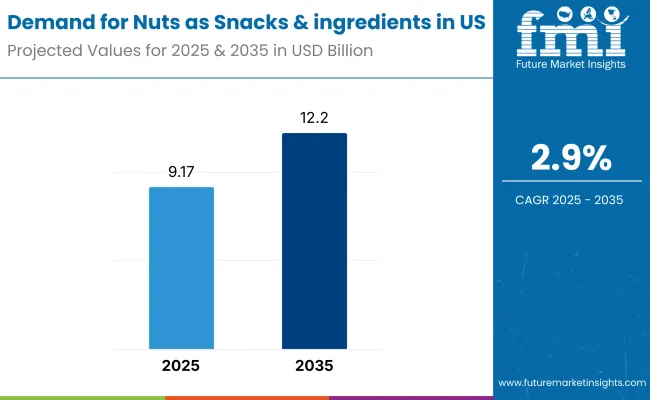
Demand for nuts as snacks and ingredients in the United States is estimated at USD 9.17 billion in 2025, with projections indicating a rise to USD 12.20 billion by 2035, reflecting a CAGR of approximately 2.9% over the forecast period. This growth reflects both a broadening consumer base and increased per capita consumption in key urban centers.
Demand For Nuts As Snacks And Ingredients In Us

US Nuts as Snacks & Ingredients Demand Analysis: Key Takeaways

  • Nuts Demand Value (2025): USD 9.17 billion
  • Nuts Forecast Value (2035): USD 12.20 billion
  • Nuts Forecast CAGR (2025 to 2035): 2.9%
  • Leading Segment in Nuts by Application (2035): Snacks (47%)
  • Leading Segment in Nuts by Distribution (2035): Supermarkets (52%)
  • Fastest Growing Nut Types: Almonds, Walnuts
  • Top Key Players in Nuts Sales: Blue Diamond Growers, Wonderful Pistachios, Planters (Hormel), Kind Snacks, Sahale Snacks

Demand For Nuts As Snacks And Ingredients In Us 1

The rise in demand is linked to shifting dietary preferences, growing awareness of health benefits, and evolving snacking trends. By 2025, per capita consumption in leading USA states such as California, Texas, and Florida averages between 2.8 to 3.2 kilograms, with projections reaching 3.5 kilograms by 2035. California leads among states, expected to generate USD 1.39 billion in nut demand by 2035, followed by Texas (USD 1.04 billion), Florida (USD 0.75 billion), New York (USD 0.69 billion), and Pennsylvania (USD 0.46 billion).

The largest contribution to demand continues to come from direct-to-consumer snacking applications, which are expected to account for 47% of total sales in 2035, owing to strong shelf presence, convenience packaging, and consumer preference for healthy snacking alternatives. By distribution channel, supermarkets represent the dominant retail format, responsible for 52% of all sales, while online retail platforms are expanding rapidly.

Consumer adoption is particularly concentrated among health-conscious millennials and busy professionals, with income and urban density emerging as significant drivers of demand. While premium organic varieties command higher prices, the average price premium over conventional nuts has stabilized around 15-20% in 2025.

Continued improvements in supply chain efficiency and private label offerings are expected to accelerate affordability and access across mid-income households. Regional disparities persist, but per capita demand in high-growth Sun Belt states is narrowing the gap with traditionally strong coastal consumption hubs.

Nuts as Snacks & Ingredients in the US: Segmentation

The nuts as snacks and ingredients segment in the USA is classified across several segments. By application, the key categories include direct-to-consumer snacks, ingredient and foodservice applications, bakery and confectionery uses, and dairy alternatives. By distribution channel, the segment spans supermarkets and hypermarkets, convenience and specialty stores, online retail platforms, and foodservice and industrial channels. By nut type, formulations include almonds, peanuts, cashews, walnuts, pistachios, and mixed varieties. By nature, the segment covers raw nuts, roasted and flavored varieties, salted options, organic certified products, and conventional processing. By region, states such as California, Texas, Florida, New York, and Pennsylvania are included, along with coverage across all 50 states.

By Application, Snacks to Lead with 47% Share

Direct-to-consumer snacking applications are projected to dominate demand in 2035, supported by portable packaging, health positioning, and category familiarity. Other applications such as ingredients, bakery uses, and dairy alternatives serve distinct consumption needs.

  • Snacks are expected to hold a 47% value share in 2035, driven by high unit turnover in retail channels, strong brand participation, and consumer preference for convenient, protein-rich snacking options across almonds, cashews, and mixed nut varieties.
  • Ingredient and foodservice applications maintain steady demand among food manufacturers and restaurant chains, especially for bulk purchasing and custom blending, supported by cost efficiency and supply chain reliability in commercial kitchens.
  • Bakery and confectionery uses show consistent traction in premium baked goods and artisanal chocolate applications, with 15% share tied to seasonal demand patterns and demand for texture enhancement in cookies, cakes, and candy formulations.
  • Dairy alternatives and other applications appeal to health-conscious consumers seeking plant-based milk, cheese, and protein alternatives; while still emerging, they offer high margins and strong consumer satisfaction in specialty retail channels.

By Distribution, Supermarkets to Lead with 52% Share

Nuts as snacks and ingredients in the USA. are distributed through a mix of mainstream retail and alternative sales channels. Supermarkets are expected to remain the primary point of sale in 2035, followed by convenience stores and online retail. Distribution strategies are evolving to match consumer shopping behavior, with growth coming from both physical and digital formats.
  • Supermarkets are projected to account for 52% of total sales in 2035, supported by wide product availability, strong visibility in snack and baking aisles, and the growing inclusion of private label and premium SKUs in chains such as Kroger, Whole Foods, and Safeway.
  • Convenience and specialty stores maintain their role through grab-and-go packaging, single-serve portions, and impulse purchase positioning, targeting busy consumers and commuters with growing interest in healthy snacking alternatives.
  • Online retail and e-commerce platforms are forecast to grow to 17% share by 2035, fueled by subscription services, bulk purchasing options, and direct-to-consumer brands offering exclusive varieties and same-day delivery in major metro areas.
  • Foodservice and industrial channels serve restaurants, bakeries, and food manufacturers with bulk packaging and custom processing, appealing to commercial buyers seeking consistent quality and competitive pricing for ingredient applications.

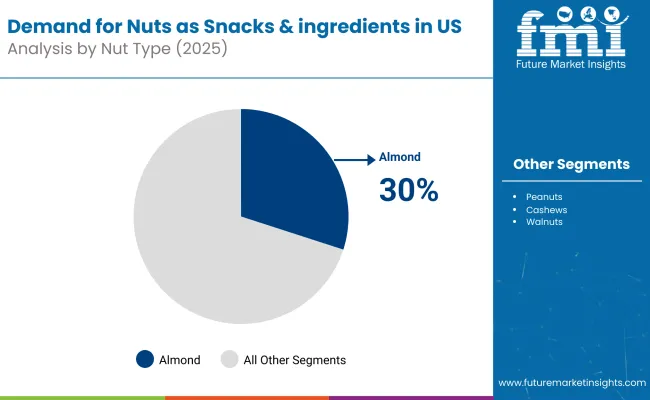
By Nut Type, Almonds to Hold 30% Share in 2025

Demand For Nuts As Snacks And Ingredients In Us Analysis By Nut Type

Nuts as snacks and ingredients in the USA utilize a variety of nut types, selected for taste profile, nutritional content, shelf stability, and processing versatility. Almonds remain the most widely consumed nut, though peanuts and cashews maintain strong positions across different consumer segments.
  • Almonds, including whole, sliced, and flavored varieties, are expected to grow to 30% share in 2025 due to their versatility, heart-health positioning, and strong performance in both snacking and ingredient applications across retail and foodservice channels.
  • Peanuts maintain a 22% share in 2035, anchored by familiar taste profiles, affordability, and strong presence in children's snacking, though facing competition from tree nuts in health-conscious adult segments.
  • Cashews offer premium positioning and creamy texture, favored for dairy alternative applications and gourmet snacking, maintaining 15% share with consistent demand in urban markets and specialty retail.
  • Walnuts show growth to 11% share, supported by omega-3 health claims and increased usage in baking applications, particularly in premium and organic product segments.
  • Pistachios maintain 8% share with strong brand loyalty and distinctive positioning, while mixed varieties and specialty nuts capture emerging consumer interest in flavor exploration and premium snacking experiences.

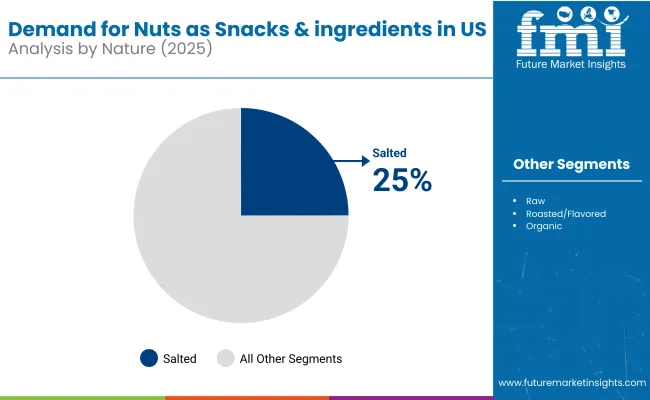
By Nature, Salted to Hold 25% Share in 2025

Demand For Nuts As Snacks And Ingredients In Us Analysis By Nature

The nuts category appeals to diverse taste preferences and health priorities across processing methods. Roasted and flavored options dominate consumer preference, while raw and organic segments serve specific dietary and lifestyle needs.
  • Roasted and flavored nuts represent 40% of demand, prioritizing taste enhancement and shelf appeal; this segment responds well to seasonal flavors, premium positioning, and innovative packaging that maintains freshness and crunch.
  • Salted varieties account for 25% of sales, providing familiar taste profiles and broad consumer appeal across age groups, with consistent performance in both branded and private label offerings.
  • Raw nuts capture 20% of demand among health-focused consumers seeking minimal processing, often purchased in bulk for home preparation, baking ingredients, and specialty diet applications.
  • Organic nuts maintain 5% share with premium pricing, appealing to environmentally conscious consumers willing to pay price premiums for certified sustainable and chemical-free growing practices.

Demand for Nuts as Snacks & Ingredients in US by Region

Country Wise Analysis Of Demand For Nuts As Snacks And Ingredients In Us

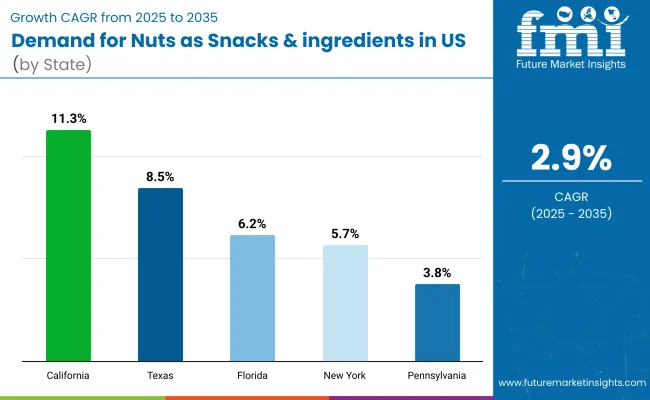
Nuts demand will not grow uniformly across every state. Rising population inflows and established consumption patterns in traditional nut-producing regions give California and Texas measurable advantages, while emerging consumption states expand more modestly from smaller bases. The table below shows the compound annual growth rate (CAGR) each of the five largest states is expected to record between 2025 and 2035.

Between 2025 and 2035, demand for nuts as snacks and ingredients is projected to expand across all major USA states, with growth rates clustering around the national average of 2.9%. California is expected to register the fastest compound annual growth rate (CAGR) of 2.95%, maintaining its position as the dominant consumption state while benefiting from both local production advantages and diverse demographic growth. The state's leadership reflects established almond and walnut growing regions, health-conscious consumer base, and extensive retail distribution networks spanning urban and suburban markets.

Texas follows closely with a CAGR of 2.90%, driven by population growth, expanding Hispanic consumer segments with strong nut consumption traditions, and increasing retail penetration across major metropolitan areas including Houston, Dallas, and Austin. Per capita consumption in Texas is projected to rise from 2.8 kg in 2025 to 3.2 kg by 2035, supported by growing awareness of nuts as convenient protein sources.

New York maintains steady growth at 2.89% CAGR, reflecting mature consumption patterns and premium product adoption in urban markets. The state benefits from established retail infrastructure and consumer willingness to pay premium prices for organic and specialty nut varieties.

Florida and Pennsylvania show slightly more moderate growth at 2.87% and 2.88% respectively, with Florida benefiting from retiree populations focused on heart-healthy snacking, while Pennsylvania maintains consistent demand across both urban centers and rural markets with established snacking traditions.

Notable Players and Strategies in US Nuts as Snacks & Ingredients Space

Demand For Nuts As Snacks Ingredients In The Us (1)

The competitive environment is characterized by a mix of agricultural cooperatives, established snack food manufacturers, and emerging health-focused brands. Distribution breadth and supply chain control remain decisive success factors: the five largest suppliers collectively reach more than 40,000 retail outlets nationwide and account for a majority of shelf facings across snack and baking aisles.

Blue Diamond Growers, as a cooperative of California almond farmers, maintains the strongest position in almond-based products with over 200 SKUs spanning raw, roasted, flavored, and ingredient applications. Its vertical integration from farming through processing gives it cost advantages and quality control, while brand recognition supports premium positioning in retail channels.

Wonderful Pistachios, part of The Wonderful Company, leverages integrated farming and processing operations to control pistachio supply chains from orchard to package. Post-harvest investments in processing technology have enabled flavored varieties and portion-controlled packaging that commands premium pricing compared to commodity nuts.

Planters, owned by Hormel Foods since 2021, benefits from established distribution relationships and iconic brand recognition spanning multiple nut categories. Recent launches focus on protein positioning and clean-label reformulations targeting health-conscious consumers while maintaining accessibility through mass retail channels.

Kind Snacks, acquired by Mars in 2020, represents the premium healthy snacking segment with nut-based bars and clusters that command significant price premiums. The brand's success in positioning nuts as wholesome ingredients rather than indulgent snacks has influenced category marketing across multiple competitors.

Emerging players include Sahale Snacks with globally-inspired flavor profiles, and numerous private label programs at Costco (Kirkland), Kroger (Simple Truth), and Target (Good & Gather) offering comparable quality at 15-20% price discounts. Consolidation continues as retail concentration increases buyer power and operational scale becomes critical for maintaining distribution access.

Key Players in US Nuts as Snacks & Ingredients Space

  • Blue Diamond Growers
  • Wonderful Pistachios & Almonds
  • Planters (Hormel Foods)
  • Kind Snacks (Mars)
  • Sahale Snacks (Amazon)
  • Fisher Nuts
  • Emerald Nuts
  • Diamond Foods
  • Paramount Farms
  • Setton Pistachio
  • Kirkland Signature (Costco)
  • Simple Truth (Kroger)
  • Good & Gather (Target)
  • 365 by Whole Foods
  • Great Value (Walmart)
Attribute Details
Study Coverage USA demand and consumption of nuts as snacks and ingredients from 2020 to 2035
Base Year 2025
Historical Data 2020
Forecast Period 2025 to 2035
Units of Measurement USD (sales), Metric Tonnes (volume), Kilograms per capita (consumption)
Geography Covered All 50 USA states; state-level analysis
Top States Analyzed California, Texas, Florida, New York, Pennsylvania
By Application Snacks, Ingredient/Foodservice, Bakery & Confectionery, Dairy Alternatives
By Distribution Channel Supermarkets/Hypermarkets, Convenience/Specialty, Online/E-commerce, Foodservice/Industrial
By Nut Type Almonds, Peanuts, Cashews, Walnuts, Pistachios, Mixed/Others
By Nature Raw, Roasted/Flavored, Salted, Organic, Conventional
Metrics Provided Sales (USD), Volume (MT), Per capita consumption (kg), CAGR (2025 to 2035), Share by segment
Price Analysis Average unit prices by nut type and processing method
Competitive Landscape Company profiles, private label strategies, cooperative vs. corporate structures
Forecast Drivers Health awareness trends, snacking behavior evolution, supply chain optimization

Key Segmentation

By Nut Type:

  • Almonds
  • Peanuts
  • Cashews
  • Walnuts
  • Pistachios
  • Mixed/Others

By Nature:

  • Raw
  • Roasted/Flavored
  • Salted
  • Organic
  • Conventional

By Application:

  • Snacks (Direct-to-consumer)
  • Ingredient/Foodservice
  • Bakery & Confectionery
  • Dairy Alternatives/Others

By Distribution Channel:

  • Supermarkets/Hypermarkets
  • Convenience/Specialty Stores
  • Online/Retail-Ecommerce
  • Food Service/Industrial

By State:

  • California
  • Texas
  • Florida
  • New York
  • Pennsylvania
  • Others (All states)

Table of Content

  1. Executive Summary
    • Global Market Outlook
    • Demand-side Trends
    • Supply-side Trends
    • Technology Roadmap Analysis
    • Analysis and Recommendations
  2. Market Overview
    • Market Coverage / Taxonomy
    • Market Definition / Scope / Limitations
  3. Market Background
    • Market Dynamics
      • Drivers
      • Restraints
      • Opportunity
      • Trends
    • Scenario Forecast
      • Demand in Optimistic Scenario
      • Demand in Likely Scenario
      • Demand in Conservative Scenario
    • Opportunity Map Analysis
    • Product Life Cycle Analysis
    • Supply Chain Analysis
      • Supply Side Participants and their Roles
        • Producers
        • Mid-Level Participants (Traders/ Agents/ Brokers)
        • Wholesalers and Distributors
      • Value Added and Value Created at Node in the Supply Chain
      • List of Raw Material Suppliers
      • List of Existing and Potential Buyer's
    • Investment Feasibility Matrix
    • Value Chain Analysis
      • Profit Margin Analysis
      • Wholesalers and Distributors
      • Retailers
    • PESTLE and Porter's Analysis
    • Regulatory Landscape
      • By Key Regions
      • By Key Countries
    • Regional Parent Market Outlook
    • Production and Consumption Statistics
    • Import and Export Statistics
  4. Analysis 2025 to 2035 and Forecast
    • Historical Market Size Value (USD Billion) Analysis, 2020 to 2024
    • Current and Future Market Size Value (USD Billion) Projections, 2025 to 2035
      • Y-o-Y Growth Trend Analysis
      • Absolute $ Opportunity Analysis
  5. Pricing Analysis 2025 to 2035
  6. Analysis 2025 to 2035, By Nut Type
    • Introduction / Key Findings
    • Historical Market Size Value (USD Billion) Analysis By Nut Type, 2020 to 2024
    • Current and Future Market Size Value (USD Billion) Analysis and Forecast By Nut Type, 2025 to 2035
      • Almonds
      • Peanuts
      • Cashews
      • Walnuts
      • Pistachios
      • Mixed/Others
    • Y-o-Y Growth Trend Analysis By Nut Type, 2020 to 2024
    • Absolute $ Opportunity Analysis By Nut Type, 2025 to 2035
  7. Analysis 2025 to 2035, By Nature
    • Introduction / Key Findings
    • Historical Market Size Value (USD Billion) Analysis By Nature, 2020 to 2024
    • Current and Future Market Size Value (USD Billion) Analysis and Forecast By Nature, 2025 to 2035
      • Raw
      • Roasted/Flavored
      • Salted
      • Organic
      • Conventional
    • Y-o-Y Growth Trend Analysis By Nature, 2020 to 2024
    • Absolute $ Opportunity Analysis By Nature, 2025 to 2035
  8. Analysis 2025 to 2035, By Application
    • Introduction / Key Findings
    • Historical Market Size Value (USD Billion) Analysis By Application, 2020 to 2024
    • Current and Future Market Size Value (USD Billion) Analysis and Forecast By Application, 2025 to 2035
      • Snacks (Direct-to-consumer)
      • Ingredient/Foodservice
      • Bakery & Confectionery
      • Dairy Alternatives/Others
    • Y-o-Y Growth Trend Analysis By Application, 2020 to 2024
    • Absolute $ Opportunity Analysis By Application, 2025 to 2035
  9. Analysis 2025 to 2035, By Distribution Channel
    • Introduction / Key Findings
    • Historical Market Size Value (USD Billion) Analysis By Distribution Channel, 2020 to 2024
    • Current and Future Market Size Value (USD Billion) Analysis and Forecast By Distribution Channel, 2025 to 2035
      • Supermarkets/Hypermarkets
      • Convenience/Specialty Stores
      • Online/Retail-Ecommerce
      • Food Service/Industrial
    • Y-o-Y Growth Trend Analysis By Distribution Channel, 2020 to 2024
    • Absolute $ Opportunity Analysis By Distribution Channel, 2025 to 2035
  10. Analysis 2025 to 2035, By State
    • Introduction
    • Historical Market Size Value (USD Billion) Analysis By State, 2020 to 2024
    • Current Market Size Value (USD Billion) Analysis and Forecast By State, 2025 to 2035
      • California
      • Texas
      • Florida
      • New York
      • Pennsylvania
      • Others (All states)
    • Market Attractiveness Analysis By State
  11. Key States Nuts as Snacks & Ingredients Market Analysis
    • California
      • Pricing Analysis
      • Market Share Analysis, 2025
        • By Nut Type
        • By Nature
        • By Application
        • By Distribution Channel
    • Texas
      • Pricing Analysis
      • Market Share Analysis, 2025
        • By Nut Type
        • By Nature
        • By Application
        • By Distribution Channel
    • Florida
      • Pricing Analysis
      • Market Share Analysis, 2025
        • By Nut Type
        • By Nature
        • By Application
        • By Distribution Channel
    • New York
      • Pricing Analysis
      • Market Share Analysis, 2025
        • By Nut Type
        • By Nature
        • By Application
        • By Distribution Channel
    • Pennsylvania
      • Pricing Analysis
      • Market Share Analysis, 2025
        • By Nut Type
        • By Nature
        • By Application
        • By Distribution Channel
  12. Market Structure Analysis
    • Competition Dashboard
    • Competition Benchmarking
    • Market Share Analysis of Top Players
      • By State
      • By Nut Type
      • By Nature
      • By Application
      • By Distribution Channel
  13. Competition Analysis
    • Competition Deep Dive
      • Blue Diamond Growers
        • Overview
        • Product Portfolio
        • Profitability by Market Segments (Product/Age/Sales Channel/Region)
        • Sales Footprint
        • Strategy Overview
          • Marketing Strategy
          • Product Strategy
          • Channel Strategy
      • Planters (Kraft Heinz)
        • Overview
        • Product Portfolio
        • Profitability by Market Segments (Product/Age/Sales Channel/Region)
        • Sales Footprint
        • Strategy Overview
          • Marketing Strategy
          • Product Strategy
          • Channel Strategy
      • Diamond Foods (Snyder's-Lance)
        • Overview
        • Product Portfolio
        • Profitability by Market Segments (Product/Age/Sales Channel/Region)
        • Sales Footprint
        • Strategy Overview
          • Marketing Strategy
          • Product Strategy
          • Channel Strategy
      • Wonderful Pistachios & Almonds
        • Overview
        • Product Portfolio
        • Profitability by Market Segments (Product/Age/Sales Channel/Region)
        • Sales Footprint
        • Strategy Overview
          • Marketing Strategy
          • Product Strategy
          • Channel Strategy
      • Tree Top Inc.
        • Overview
        • Product Portfolio
        • Profitability by Market Segments (Product/Age/Sales Channel/Region)
        • Sales Footprint
        • Strategy Overview
          • Marketing Strategy
          • Product Strategy
          • Channel Strategy
      • Sahale Snacks (Mondelez International)
        • Overview
        • Product Portfolio
        • Profitability by Market Segments (Product/Age/Sales Channel/Region)
        • Sales Footprint
        • Strategy Overview
          • Marketing Strategy
          • Product Strategy
          • Channel Strategy
      • Kellogg Company
        • Overview
        • Product Portfolio
        • Profitability by Market Segments (Product/Age/Sales Channel/Region)
        • Sales Footprint
        • Strategy Overview
          • Marketing Strategy
          • Product Strategy
          • Channel Strategy
      • General Mills Inc.
        • Overview
        • Product Portfolio
        • Profitability by Market Segments (Product/Age/Sales Channel/Region)
        • Sales Footprint
        • Strategy Overview
          • Marketing Strategy
          • Product Strategy
          • Channel Strategy
      • Hormel Foods Corporation
        • Overview
        • Product Portfolio
        • Profitability by Market Segments (Product/Age/Sales Channel/Region)
        • Sales Footprint
        • Strategy Overview
          • Marketing Strategy
          • Product Strategy
          • Channel Strategy
      • Eden Foods Inc.
        • Overview
        • Product Portfolio
        • Profitability by Market Segments (Product/Age/Sales Channel/Region)
        • Sales Footprint
        • Strategy Overview
          • Marketing Strategy
          • Product Strategy
          • Channel Strategy
  14. Assumptions & Acronyms Used
  15. Research Methodology

List of Tables

  • Table 1:Market Value (USD Billion) Annual Forecast, 2025-2035
  • Table 2:Market Year-over-Year Growth Rate (%), 2025-2035
  • Table 3:Market CAGR Analysis by Forecast Period, 2025-2035
  • Table 4:Market Value (USD Billion) Forecast by State, 2025-2035
  • Table 5:Market Share (%) Forecast by State, 2025-2035
  • Table 6: California Nuts Market Value (USD Billion) and Share (%) Forecast, 2025-2035
  • Table 7: Texas Nuts Market Value (USD Billion) and Share (%) Forecast, 2025-2035
  • Table 8: Florida Nuts Market Value (USD Billion) and Share (%) Forecast, 2025-2035
  • Table 9: New York Nuts Market Value (USD Billion) and Share (%) Forecast, 2025-2035
  • Table 10: Pennsylvania Nuts Market Value (USD Billion) and Share (%) Forecast, 2025-2035
  • Table 11: Top 5 States Nuts Market Value (USD Billion) and Share (%) Forecast, 2025-2035
  • Table 12: Other States (Combined) Nuts Market Value (USD Billion) and Share (%) Forecast, 2025-2035
  • Table 13: State-wise Market Growth Rate Analysis, 2025-2035
  • Table 14: Regional Market Concentration Index by State, 2025-2035
  • Table 15:Market Share (%) Forecast by Nature, 2025-2035
  • Table 16: Raw Nuts Market Value (USD Billion) and Share (%) Forecast, 2025-2035
  • Table 17: Roasted/Flavored Nuts Market Value (USD Billion) and Share (%) Forecast, 2025-2035
  • Table 18: Salted Nuts Market Value (USD Billion) and Share (%) Forecast, 2025-2035
  • Table 19: Organic Nuts Market Value (USD Billion) and Share (%) Forecast, 2025-2035
  • Table 20: Conventional Nuts Market Value (USD Billion) and Share (%) Forecast, 2025-2035
  • Table 21: Nature Segment Growth Rate Analysis, 2025-2035
  • Table 22: Premium vs Standard Processing Market Split, 2025-2035
  • Table 23:Market Share (%) Forecast by Nut Type, 2025-2035
  • Table 24: Almonds Market Value (USD Billion) and Share (%) Forecast, 2025-2035
  • Table 25: Peanuts Market Value (USD Billion) and Share (%) Forecast, 2025-2035
  • Table 26: Cashews Market Value (USD Billion) and Share (%) Forecast, 2025-2035
  • Table 27: Walnuts Market Value (USD Billion) and Share (%) Forecast, 2025-2035
  • Table 28: Pistachios Market Value (USD Billion) and Share (%) Forecast, 2025-2035
  • Table 29: Mixed/Other Nuts Market Value (USD Billion) and Share (%) Forecast, 2025-2035
  • Table 30: Nut Type Market Growth Rate Analysis, 2025-2035
  • Table 31: Premium Nut Types vs Traditional Market Split, 2025-2035
  • Table 32:Market Share (%) Forecast by Application, 2025-2035
  • Table 33: Snacks (Direct-to-consumer) Market Value (USD Billion) and Share (%) Forecast, 2025-2035
  • Table 34: Ingredient/Foodservice Market Value (USD Billion) and Share (%) Forecast, 2025-2035
  • Table 35: Bakery & Confectionery Market Value (USD Billion) and Share (%) Forecast, 2025-2035
  • Table 36: Dairy Alternatives/Others Market Value (USD Billion) and Share (%) Forecast, 2025-2035
  • Table 37: Application Segment Growth Rate Analysis, 2025-2035
  • Table 38: B2C vs B2B Market Split Analysis, 2025-2035
  • Table 39:Market Share (%) Forecast by Distribution Channel, 2025-2035
  • Table 40: Supermarkets/Hypermarkets Market Value (USD Billion) and Share (%) Forecast, 2025-2035
  • Table 41: Convenience/Specialty Stores Market Value (USD Billion) and Share (%) Forecast, 2025-2035
  • Table 42: Online/Retail-Ecommerce Market Value (USD Billion) and Share (%) Forecast, 2025-2035
  • Table 43: Food Service/Industrial Market Value (USD Billion) and Share (%) Forecast, 2025-2035
  • Table 44: Distribution Channel Growth Rate Analysis, 2025-2035
  • Table 45: Traditional vs Digital Channel Market Split, 2025-2035
  • Table 46: California Market by Nut Type Breakdown, 2025 vs 2035
  • Table 47: Texas Market by Application Segment Breakdown, 2025 vs 2035
  • Table 48: Almonds Market by State Distribution, 2025 vs 2035
  • Table 49: Peanuts Market by Distribution Channel, 2025 vs 2035
  • Table 50: Organic Segment by State Performance, 2025 vs 2035
  • Table 51: Snacks Application by Nut Type Mix, 2025 vs 2035
  • Table 52: Ingredient/Foodservice by Nature Processing, 2025 vs 2035
  • Table 53: Online Channel by Nut Type Performance, 2025 vs 2035
  • Table 54: Supermarket Channel by State Coverage, 2025 vs 2035
  • Table 55: Premium Processing by Application Split, 2025 vs 2035
  • Table 56: Year-over-Year Growth Analysis by Segment, 2025-2035
  • Table 57: Market Share Stability Index by Category, 2025-2035
  • Table 58: Growth Rate Variance Analysis by State, 2025-2035
  • Table 59: Segment Performance Matrix, 2025 vs 2035
  • Table 60: Market Concentration Ratios by Category, 2025-2035
  • Table 61: Emerging vs Mature Segment Classification, 2025-2035
  • Table 62: High Growth vs Stable Growth Segments, 2025-2035
  • Table 63: Regional Performance vs National Average, 2025-2035
  • Table 64: California Annual Market Value Progression, 2025-2035
  • Table 65: Almonds Annual Market Share Evolution, 2025-2035
  • Table 66: Snacks Application Annual Growth Trajectory, 2025-2035
  • Table 67: Online Channel Annual Market Penetration, 2025-2035
  • Table 68: Organic Segment Annual Value Growth, 2025-2035
  • Table 69: Top 5 States Combined Annual Performance, 2025-2035
  • Table 70: Traditional Channels Annual Market Retention, 2025-2035
  • Table 71: Leading States Market Performance Comparison, 2025-2035
  • Table 72: Top Nut Types Market Share Comparison, 2025-2035
  • Table 73: Primary Applications Growth Rate Comparison, 2025-2035
  • Table 74: Major Channels Market Evolution Comparison, 2025-2035
  • Table 75: Processing Types Market Stability Comparison, 2025-2035
  • Table 76: Premium vs Standard Segments Performance, 2025-2035
  • Table 77: B2C vs B2B Market Growth Comparison, 2025-2035
  • Table 78: Traditional vs Modern Channels Evolution, 2025-2035
  • Table 79: Base Case vs Optimistic Scenario by State, 2025-2035
  • Table 80: Base Case vs Conservative Scenario by Nut Type, 2025-2035
  • Table 81: Market Sensitivity Analysis by Key Segments, 2025-2035
  • Table 82: Growth Rate Sensitivity by External Factors, 2025-2035
  • Table 83: Market Size Confidence Intervals by Category, 2025-2035
  • Table 84: Forecast Reliability Index by Segment Type, 2025-2035

List of Figures

  • Figure 1: Market Volume (Metric Tonnes) Forecast 2020-2035
  • Figure 2: Market Pricing Analysis
  • Figure 3: Market Value (USD Billion) Forecast 2020-2035
  • Figure 4: Market Value Share and BPS Analysis by Nut Type, 2025 and 2035
  • Figure 5: Market Y-o-Y Growth Comparison by Nut Type, 2025-2035
  • Figure 6: Market Attractiveness Analysis by Nut Type
  • Figure 7: Market Value Share and BPS Analysis by Nature, 2025 and 2035
  • Figure 8: Market Y-o-Y Growth Comparison by Nature, 2025-2035
  • Figure 9: Market Attractiveness Analysis by Nature
  • Figure 10: Market Value Share and BPS Analysis by Application, 2025 and 2035
  • Figure 11: Market Y-o-Y Growth Comparison by Application, 2025-2035
  • Figure 12: Market Attractiveness Analysis by Application
  • Figure 13: Market Value Share and BPS Analysis by Distribution Channel, 2025 and 2035
  • Figure 14: Market Y-o-Y Growth Comparison by Distribution Channel, 2025-2035
  • Figure 15: Market Attractiveness Analysis by Distribution Channel
  • Figure 16: Market Value (USD Billion) Share and BPS Analysis by State, 2025 and 2035
  • Figure 17: Market Y-o-Y Growth Comparison by State, 2025-2035
  • Figure 18: Market Attractiveness Analysis by State
  • Figure 19: Market -- Tier Structure Analysis
  • Figure 20: Market -- Company Share Analysis

Frequently Asked Questions

What is the projected demand value of nuts as snacks and ingredients in the USA by 2035?

By 2035, total USA demand for nuts as snacks and ingredients is projected to reach USD 12.20 billion, up from USD 9.17 billion in 2025, reflecting a CAGR of approximately 2.9%.

Which application segments dominate the USA nuts category?

Direct-to-consumer snacks hold the leading share, accounting for approximately 47% of total demand in 2035, followed by ingredient and foodservice applications at 28%.

What are the fastest-growing states for nuts consumption?

California leads in projected growth with a CAGR of 2.95% between 2025 and 2035, followed by Texas at 2.90%, due to population growth and established consumption patterns.

Which distribution channels are most effective for nuts in the USA?

Supermarkets and hypermarkets are the dominant sales channel (52% share in 2035), while online retail platforms are growing rapidly to reach 17% share by 2035.

Who are the key companies driving nuts demand in the USA?

Major players include Blue Diamond Growers, Wonderful Pistachios, Planters (Hormel), Kind Snacks (Mars), and Sahale Snacks, with growing competition from private label brands like Costco's Kirkland and Kroger's Simple Truth.

Explore Similar Insights

Future Market Insights

Demand for Nuts as snacks and ingredients in US