Demand for no-acid whey strained dairy processing concepts in the European Union is estimated at USD 2.8 billion in 2025, with projections indicating a rise to USD 4.6 billion by 2035, reflecting a CAGR of approximately 5.1% over the forecast period.
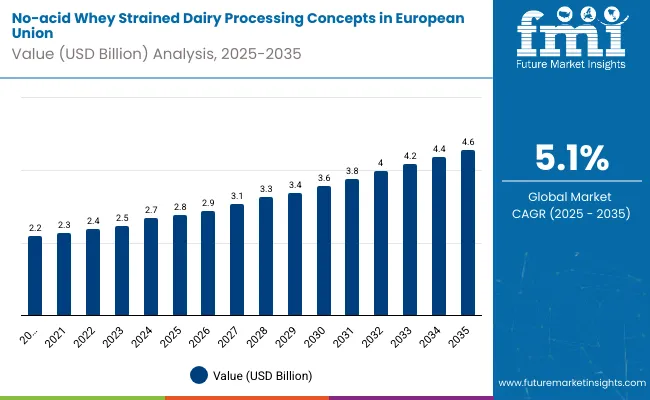
| Metric | Value |
|---|---|
| Industry Size (2025E) | USD 2.8 billion |
| Industry Value (2035F) | USD 4.6 billion |
| CAGR (2025 to 2035) | 5.1% |
This growth reflects both a broadening consumer base and increased per capita consumption in key metropolitan centres. The rise in demand is linked to shifting dietary preferences, growing awareness of protein benefits, and evolving health-conscious trends. By 2025, per capita consumption in leading EU countries such as Germany, France, and Italy averages between 2.8 to 3.2 kilograms, with projections reaching 4.1 kilograms by 2035.
Berlin leads among metropolitan areas, expected to generate USD 315 million in no-acid whey strained dairy sales by 2035, followed by Paris (USD 248 million), Rome (USD 186 million), Madrid (USD 142 million), and Amsterdam (USD 118 million).
The largest contribution to demand continues to come from Greek-style yogurt products, which are expected to account for 38% of total sales in 2025, owing to strong shelf presence, extended storage life, and consumer familiarity. By distribution channel, supermarkets and hypermarkets represent the dominant retail format, responsible for 50% of all sales, while e-commerce platforms and specialty dairy stores are expanding rapidly.
Consumer adoption is particularly concentrated among health-conscious consumers and high-protein diet followers, with fitness awareness and nutritional benefits emerging as significant drivers of demand. While price remains a consideration, the average price premium over conventional dairy products has declined from 18% in 2020 to 12% in 2025.
Continued improvements in processing scale and private label offerings are expected to accelerate affordability and access across mid-income households. Regional disparities persist, but per capita demand in emerging EU territories is narrowing the gap with traditionally strong Western European hubs.
The no-acid whey strained dairy processing concepts segment in the EU is classified across several segments. By product type, the key categories include Greek-style yogurt, strained yogurt drinks, high-protein dairy desserts, strained cheese products, and others. By processing method, the segment spans ultrafiltration, microfiltration, reverse osmosis, and other straining technologies. By distribution channel, the segment covers supermarkets and hypermarkets, specialty dairy stores, e-commerce platforms, convenience stores, and others. By consumer profile, the segment includes health-conscious consumers, high-protein diet followers, sports and fitness enthusiasts, and others. By region, countries such as Germany, France, Italy, Spain, and Netherlands are included, along with coverage across all 27 EU member states.
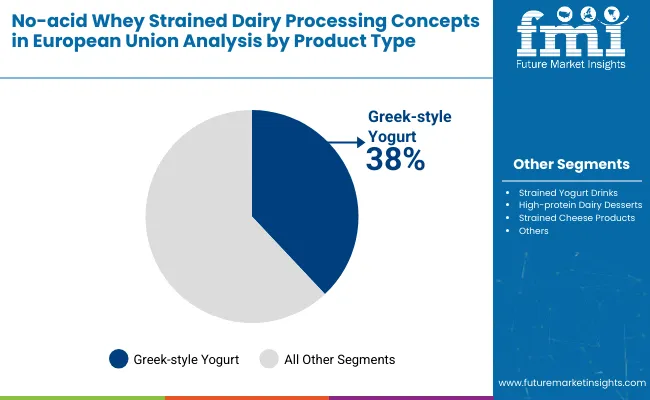
Greek-style yogurt is projected to dominate demand in 2025, supported by widespread consumer acceptance, premium positioning, and established retail presence. Other formats such as strained drinks, desserts, and cheese products are growing steadily, each serving distinct consumption occasions.
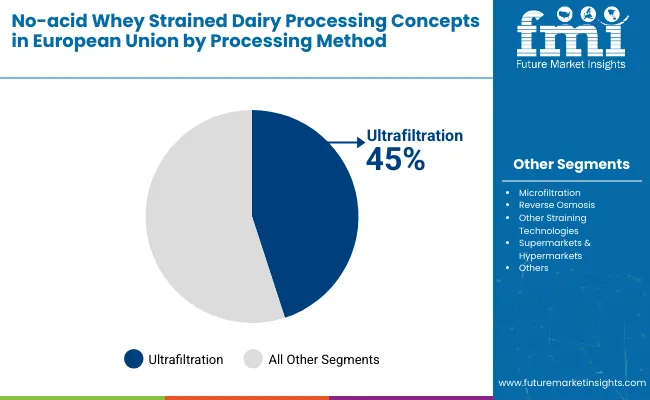
No-acid whey strained dairy processing concepts in the EU utilize various filtration technologies, selected for efficiency, protein retention, and final product characteristics. Ultrafiltration remains the most widely adopted processing method, though alternatives like microfiltration and reverse osmosis are gaining adoption for specific applications.
No-acid whey strained dairy processing concepts in the EU are distributed through a mix of traditional retail and emerging sales channels. Supermarkets and hypermarkets are expected to remain the primary point of sale in 2025, followed by specialty dairy stores and e-commerce platforms. Distribution strategies are evolving to match consumer shopping behavior, with growth coming from both physical and digital formats.
The no-acid whey strained dairy processing concepts category appeals to a diverse consumer base across age groups, income levels, and lifestyle preferences. While motivations vary from fitness to nutrition to taste, demand is concentrated among three key demographic clusters. Each group brings distinct purchase behaviors, channel preferences, and product expectations.
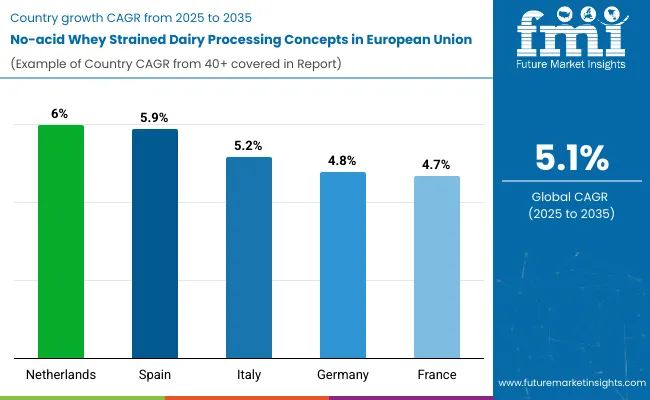
Regional demand patterns reflect varying consumer preferences, retail development, and dietary traditions across the European Union. Germany leads in absolute terms due to population size and strong health consciousness, while emerging regions show faster growth rates from lower baseline consumption levels.
Germany dominates with 25% of total EU demand, driven by its large population base, established health food culture, and strong retail infrastructure. German consumers show particular preference for organic and bio-certified strained dairy products, supporting premium pricing and specialized product lines.
France accounts for 20% of demand, with consumption concentrated in metropolitan areas and among fitness-oriented demographics. The French preference for artisanal dairy products has supported growth in specialty cheese applications and premium yogurt segments.
Italy represents 15% of regional demand, with strong growth in high-protein dessert categories and traditional cheese applications. Italian consumers value authentic production methods and regional specialties, driving demand for locally-sourced strained dairy products.
Spain captures 12% share with rapidly expanding consumption among younger demographics and urban populations. The Spanish demand shows strong growth in convenient, portable formats aligned with active lifestyles and on-the-go consumption.
Netherlands holds 10% of demand despite its smaller population, reflecting high per capita consumption and advanced dairy processing capabilities. Dutch consumers lead in adoption of innovative formats and sustainable packaging solutions.
Other EU countries collectively represent 18% of demand, with notable growth in Nordic countries, Austria, and Belgium, driven by increasing health awareness and expanding retail availability.
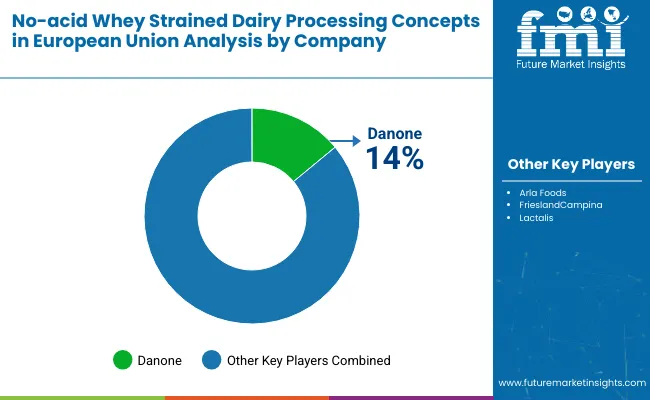
The competitive environment is characterized by a mix of established dairy giants and specialized health-focused brands. Processing capability and distribution reach remain decisive success factors, with the five largest suppliers collectively serving more than 45,000 retail outlets across the EU and accounting for a majority of chilled dairy shelf space in the category.
Danone leads through its Two Good and Oikos product lines, leveraging extensive European distribution networks and strong brand recognition in health-positioned dairy. The company's focus on protein content and probiotic benefits resonates well with health-conscious consumers across multiple EU territories.
Nestlé maintains significant presence through its Greek yogurt portfolio and strategic acquisitions, utilizing its pan-European supply chain to deliver consistent quality and competitive pricing. The company's investment in sustainable packaging and local sourcing supports premium positioning in environmentally conscious segments.
Arla Foods benefits from cooperative dairy farmer networks across Northern Europe, enabling traceable sourcing and authentic positioning. Recent expansion into organic strained dairy products and protein-enhanced formats targets the growing sports nutrition segment.
FrieslandCampina leverages advanced processing technologies and ingredient expertise to supply both branded products and private label manufacturing. The company's focus on functional dairy ingredients supports innovation in high-protein dessert applications.
Lactalis utilizes its extensive European presence and processing capabilities to offer value-positioned strained dairy products across multiple retail channels. Strategic partnerships with major supermarket chains enable widespread distribution and competitive shelf pricing.
| Attribute | Details |
| Study Coverage | EU demand and consumption of no-acid whey strained dairy processing concepts from 2020 to 2035 |
| Base Year | 2025 |
| Historical Data | 2020 |
| Forecast Period | 2025-2035 |
| Units of Measurement | USD (sales), Metric Tonnes (volume), Kilograms per capita (consumption) |
| Geography Covered | All 27 EU member states; country-level and city-level granularity |
| Top Countries Analyzed | Germany, France, Italy, Spain, Netherlands, 22+ others |
| Top Cities Analyzed | Berlin, Paris, Rome, Madrid, Amsterdam and 50+ |
| By Product Type | Greek-style yogurt, Strained yogurt drinks, High-protein dairy desserts, Strained cheese products |
| By Processing Method | Ultrafiltration, Microfiltration, Reverse osmosis, Other straining technologies |
| By Distribution Channel | Supermarkets/hypermarkets, Specialty dairy stores, E-commerce, Convenience stores |
| By Consumer Profile | Health-conscious consumers, High-protein diet followers, Sports & fitness enthusiasts |
| Metrics Provided | Sales (USD), Volume (MT), Per capita consumption (kg), CAGR (2025-2035), Share by segment |
| Price Analysis | Average unit prices by product type and region |
| Competitive Landscape | Company profiles, private label strategies, processing capabilities, regional presence |
| Forecast Drivers | Health trends, protein awareness, processing innovation, retail expansion |
By 2035, total EU demand for no-acid whey strained dairy processing concepts is projected to reach USD 4.6 billion, up from USD 2.8 billion in 2025, reflecting a CAGR of approximately 5.1%.
Greek-style yogurt holds the leading share, accounting for approximately 38% of total demand in 2025, followed by strained yogurt drinks at 25% and high-protein dairy desserts at 18%.
Netherlands and Spain lead in projected growth rates, driven by increasing health consciousness and expanding retail distribution networks across these territories.
Ultrafiltration dominates with 45% share due to its efficiency and protein retention capabilities, while microfiltration (25%) and reverse osmosis (20%) serve specialized applications.
Major players include Danone, Nestlé, Arla Foods, FrieslandCampina, and Lactalis, with growing competition from private label brands and specialty organic producers across the region.


Our Research Products

The "Full Research Suite" delivers actionable market intel, deep dives on markets or technologies, so clients act faster, cut risk, and unlock growth.

The Leaderboard benchmarks and ranks top vendors, classifying them as Established Leaders, Leading Challengers, or Disruptors & Challengers.

Locates where complements amplify value and substitutes erode it, forecasting net impact by horizon

We deliver granular, decision-grade intel: market sizing, 5-year forecasts, pricing, adoption, usage, revenue, and operational KPIs—plus competitor tracking, regulation, and value chains—across 60 countries broadly.

Spot the shifts before they hit your P&L. We track inflection points, adoption curves, pricing moves, and ecosystem plays to show where demand is heading, why it is changing, and what to do next across high-growth markets and disruptive tech

Real-time reads of user behavior. We track shifting priorities, perceptions of today’s and next-gen services, and provider experience, then pace how fast tech moves from trial to adoption, blending buyer, consumer, and channel inputs with social signals (#WhySwitch, #UX).

Partner with our analyst team to build a custom report designed around your business priorities. From analysing market trends to assessing competitors or crafting bespoke datasets, we tailor insights to your needs.
Supplier Intelligence
Discovery & Profiling
Capacity & Footprint
Performance & Risk
Compliance & Governance
Commercial Readiness
Who Supplies Whom
Scorecards & Shortlists
Playbooks & Docs
Category Intelligence
Definition & Scope
Demand & Use Cases
Cost Drivers
Market Structure
Supply Chain Map
Trade & Policy
Operating Norms
Deliverables
Buyer Intelligence
Account Basics
Spend & Scope
Procurement Model
Vendor Requirements
Terms & Policies
Entry Strategy
Pain Points & Triggers
Outputs
Pricing Analysis
Benchmarks
Trends
Should-Cost
Indexation
Landed Cost
Commercial Terms
Deliverables
Brand Analysis
Positioning & Value Prop
Share & Presence
Customer Evidence
Go-to-Market
Digital & Reputation
Compliance & Trust
KPIs & Gaps
Outputs
Full Research Suite comprises of:
Market outlook & trends analysis
Interviews & case studies
Strategic recommendations
Vendor profiles & capabilities analysis
5-year forecasts
8 regions and 60+ country-level data splits
Market segment data splits
12 months of continuous data updates
DELIVERED AS:
PDF EXCEL ONLINE
Demand for PMMA/ASA Composite Material in UK Size and Share Forecast Outlook 2025 to 2035
Demand for Electric Aircraft Sensors in UK Size and Share Forecast Outlook 2025 to 2035
Demand for Disposable Drills in UK Size and Share Forecast Outlook 2025 to 2035
Demand for DC Surge Arrester in USA Size and Share Forecast Outlook 2025 to 2035
Demand for Direct Fast Dyes in UK Size and Share Forecast Outlook 2025 to 2035
Demand for D-Mannose Supplements in UK Size and Share Forecast Outlook 2025 to 2035
Demand for Corrugated Cardboard Cutting Machine in USA Size and Share Forecast Outlook 2025 to 2035
Demand for Cobalt Salt Adhesion Promoter for Tires in USA Size and Share Forecast Outlook 2025 to 2035
Demand for CO2-reduced Concrete in USA Size and Share Forecast Outlook 2025 to 2035
Demand for CO2-based Polycarbonate Polyol in USA Size and Share Forecast Outlook 2025 to 2035
Demand for Chaga Mushroom Powder in UK Size and Share Forecast Outlook 2025 to 2035
Demand for Car OS in USA Size and Share Forecast Outlook 2025 to 2035
Demand for Central Computing Architecture Vehicle OS in USA Size and Share Forecast Outlook 2025 to 2035
Demand for Automotive Dynamic Map Data in USA Size and Share Forecast Outlook 2025 to 2035
Demand for Automotive Hoses and Assemblies for OEM in USA Size and Share Forecast Outlook 2025 to 2035
Demand for Biomass Hot Air Generator Furnace in Middle East & Africa Size and Share Forecast Outlook 2025 to 2035
Demand for Vacuum Heat Shrink Film in UK Size and Share Forecast Outlook 2025 to 2035
Demand for Unidirectional ESD Diode in USA Size and Share Forecast Outlook 2025 to 2035
Demand for SMT Solder Powder in UK Size and Share Forecast Outlook 2025 to 2035
Demand for Slitting Machine in USA Size and Share Forecast Outlook 2025 to 2035

Thank you!
You will receive an email from our Business Development Manager. Please be sure to check your SPAM/JUNK folder too.
Chat With
MaRIA