Paper Cup Market Size and Sales Outlook in Korea (2023 to 2033)

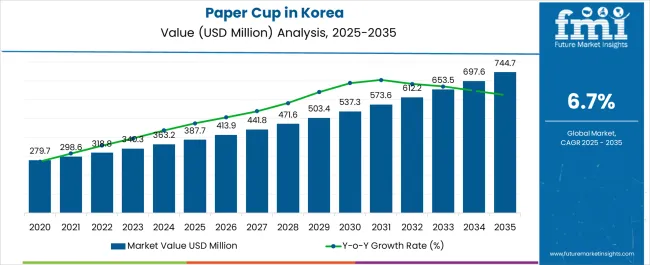
The adoption of paper cup in Korea is estimated to increase at a CAGR of 7.1% through 2033. Paper cup sales in Korea are poised to experience a rise to a valuation of USD 338 million in 2023. Demand for paper cup from coffee shops and convenience stores is likely to remain significant during the forecast period. This trend is likely to fuel the industry to a valuation of USD 671.4 million by 2033.

Key Trends- Highlights to Understand Emerging Key Opportunities

  • As consumers and businesses prioritize sustainability, Korea is witnessing a growing demand for eco-friendly paper cups. Concerns over plastic waste and environmental conservation drive this shift.
  • The food service sector, including cafes, restaurants, and fast-food chains, remains the primary revenue channel, driving paper cup sales.
  • Manufacturers are focusing on offering customizable and branded paper cups to help businesses promote their image and stand out in a competitive landscape. Unique designs and branding are becoming more significant.
  • Stringent regulations and policies on single-use plastics and food safety influence the industry. Manufacturers are investing in compliance to meet these standards, reshaping product designs and materials used in paper cup production.
Attributes Details
Industry Size of Korea in 2023 USD 338 million
Expected Industry Size of Korea by 2033 USD 671.4 million
Forecasted CAGR from 2023 to 2033 7.1%

Emerging Trends Supporting Paper Cup Demand Growth in Korea

  • There is a growing preference for eco-friendly alternatives with increasing awareness about environmental issues. Paper cup, being biodegradable and recyclable, is gaining popularity as businesses and consumers seek sustainable choices, driven by a desire to reduce plastic waste and minimize ecological impact.
  • Changing lifestyles, particularly the rise of on-the-go culture and food delivery services, have significantly boosted the demand for paper cups. The convenience factor associated with disposable paper cups aligns with the fast-paced lifestyles of modern consumers.
  • Government regulations aimed at curbing single-use plastics have accelerated the shift toward paper cups. Many businesses are proactively adopting sustainable practices to align with corporate social responsibility goals. In turn, promoting the usage of paper cups contributes to the overall industry demand.

Paper Cup Industry Analysis by Top Investment Segments in Korea

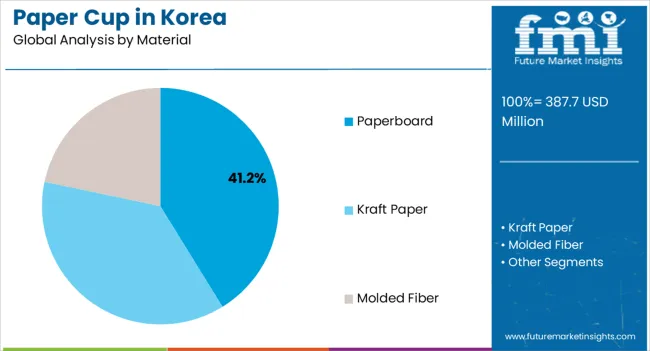
The table indicates that the paperboard segment dominates the industry by material type, acquiring a share of 55.1% in 2023. The table further details end use category and show that the beverage segment leads with a value share of 68.5% in 2023.

Category Industry Share in 2023
Paperboard 55.1%
Beverages 68.5%

Traditional Customs and Environmental Consciousness Drive Demand for Paperboard Cups in Korea

South Korea has been actively promoting eco-friendly practices, and there is a growing trend towards sustainable materials. Paperboard cups align well with this ethos, as they are biodegradable and recyclable. Moreover, cultural preferences also come into play. Traditional Korean dining customs often involve hot beverages like tea or coffee, and paperboard cups provide a convenient and practical solution for takeout or on-the-go consumption. As Korea's hospitality industry gears itself for a new deposit program in December 2022, the number of paperboard cups supplied across 14 café chains and four fast-food restaurants has surged 30% since the pandemic began.

The local paper industry in Korea has seen considerable advancements in technology and infrastructure. This has led to the production of high-quality paperboard material that meets the stringent standards set by both regulatory bodies and consumers. This quality assurance has bolstered the confidence of businesses and consumers in choosing paperboard cups.

Paper Cups Rise to the Top as Individuals Embrace On-the-go Beverage Options

The culture of coffee is well entrenched in Korea. The country has one of the maximum per-capita coffee consumption rates in the world. Consumers in this country favor takeout coffee due to their passion for on-the-go lifestyles, which has increased demand for paper cups. The growth of coffee shop chains, both local and foreign, throughout urban areas only serves to further support this tendency.

Korea's culture of convenience stores is prominent. These shops, which are common in cities, sell a variety of drinks. Customers want grab-and-go alternatives because of how quickly modern life moves; thus, paper cups are the container of choice.

Analysis of Top Regions Using Paper Cups in Korea

Established Companies to Propel the Industry in South Gyeongsang

South Gyeongsang province in South Korea is a significant hub for various industries, including the paper cup industry. The province is home to numerous manufacturers, ranging from small enterprises to large-scale companies, producing a wide range of paper cup products. These businesses contribute significantly to the local economy and also play a role in the larger context of South Korea's export-oriented manufacturing sector.

The industry in South Gyeongsang province is likely to be influenced by global trends such as the shift toward eco-friendly and sustainable packaging. Local companies might face challenges related to compliance with international quality standards and evolving environmental regulations.

South Gyeongsang, North Jeolla, South Jeolla, and Jeju are other regions playing key roles in the Korea paper cup industry.
Competitive Landscape and Market Positioning

The paper cup industry in Korea has become more dispersed. Customers are open to new ideas, making it simple for new businesses to enter Korea for paper cup. Gaining consumer loyalty is tough at first appearance. To retain customers, reputable brands continue to deliver the taste of fresh features powered by technology.

When emerging firms form alliances with leading corporations, they are likely to acquire significant exposure. Deploying technology correctly can aid in route optimization, assuring efficient delivery.

The emergence of super applications is another important competitive touchpoint. Key players in Korea keep expanding their operations beyond a particular category to provide their users with an all-inclusive approach.

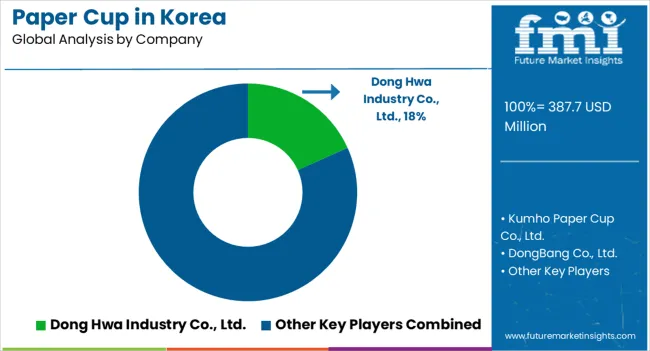
  • Dong Hwa Industry Co., Ltd. - They are one of the key paper cup manufacturers in South Korea, producing a wide range of disposable paper products, including cups, bowls, and containers.
  • Kumho Paper Cup Co., Ltd. - They specialize in manufacturing paper cups for various purposes, including hot and cold beverages. They are known for their quality and customization options.
  • DongBang Co., Ltd. - They are a leading supplier of paper cups and other disposable food service items in South Korea. They produce different paper cups suitable for different industries.
  • Daesung Paper Cup Co., Ltd - They are engaged in the production of paper cups for both domestic and international markets. They offer a range of sizes and customization features.

Leading Companies in the Korea Paper Cup Industry

  • Dong Hwa Industry Co., Ltd.
  • Kumho Paper Cup Co., Ltd.
  • DongBang Co., Ltd.
  • Daesung Paper Cup Co., Ltd.
  • Woosung Paper Co., Ltd.
  • Hwaseung Industries Co., Ltd.
  • Hwasung Paper Co., Ltd.

Scope and Coverage of the Korea Paper Cup Market Report

Attributes Details
Industry Size of Korea in 2023 USD 338 million
Expected Industry Size in 2033 USD 671.4 million
CAGR from 2023 to 2033 7.1%
Historical Analysis of Demand for Paper Cup in Korea 2018 to 2022
Demand Forecast for Paper Cup in Korea 2023 to 2033
Report Coverage Industry Size, Industry Trends, Analysis of key factors influencing Paper Cup Adoption in Korea, Insights on Industry Players and their Industry Strategy in Korea, Ecosystem Analysis of Local and Regional Korea Providers
Key Regions Analyzed While Studying Opportunities in Paper Cup in Korea South Gyeongsang, North Jeolla, South Jeolla, Jeju
Key Companies Profiled Dong Hwa Industry Co., Ltd.; Kumho Paper Cup Co., Ltd.; DongBang Co., Ltd.; Daesung Paper Cup Co., Ltd.; Woosung Paper Co., Ltd.; Hwaseung Industries Co., Ltd.; Hwasung Paper Co., Ltd.

Top Segments Studied in the Korea Paper Cup Market

By Capacity:

  • 4 Oz
  • 8 Oz
  • 12 Oz
  • 16 Oz
  • 20 Oz
  • Other Capacities

By Material:

  • Paperboard
  • Kraft Paper
  • Molded Fiber

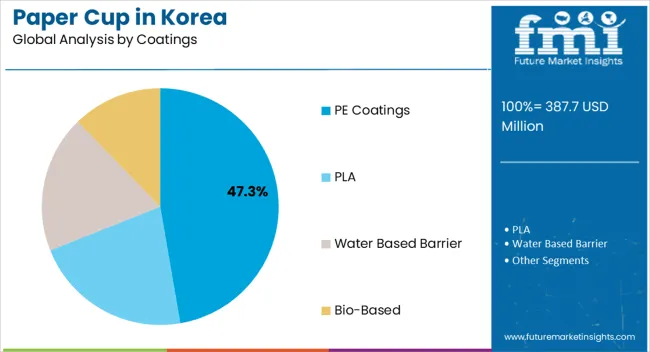
By Coatings:

  • PE Coatings
  • PLA
  • Water Based Barrier
  • Biobased

By Distribution Channel:

  • Manufacturers
  • Retail
  • Hypermarket
  • Supermarkets
  • Convenience Stores
  • Specialty Stores
  • Distributors
  • Online

By Application:

  • Beverages
    • Cold
    • Hot
  • Food
    • Spreads
    • Sausages & Dressings
    • Confectionary
  • Dairy
    • Ice Cream
    • Yogurt
    • Drinks

By End-use:

  • Commercial Use
    • Hotels
    • Cafes
    • Full Service restaurants
    • Quick Service Restaurants
    • Venue Caterings
    • Mobile Food Vendors
    • Bakery and Patisserie
  • Institutional Use
    • School Colleges
    • Offices
    • Hospitals
    • Airports and Railway
  • Household Use

By Cities/Provinces:

  • South Gyeongsang
  • North Jeolla
  • South Jeolla
  • Jeju

Table of Content

  • 1. Executive Summary
  • 2. Market Overview
  • 3. Market Background
  • 4. Korea Industry Analysis and Outlook 2018 to 2022 and Forecast, 2023 to 2033
  • 5. Korea Industry Analysis and Outlook 2018 to 2022 and Forecast 2023 to 2033, By Capacity
    • 5.1. 4 Oz
    • 5.2. 8 Oz
    • 5.3. 12 Oz
    • 5.4. 16 Oz
    • 5.5. 20 Oz
    • 5.6. Other Capacities
  • 6. Korea Industry Analysis and Outlook 2018 to 2022 and Forecast 2023 to 2033, By Material
    • 6.1. Paperboard
    • 6.2. Kraft Paper
    • 6.3. Molded Fiber
  • 7. Korea Industry Analysis and Outlook 2018 to 2022 and Forecast 2023 to 2033, By Coatings
    • 7.1. PE Coatings
    • 7.2. PLA
    • 7.3. Water Based Barrier
    • 7.4. Bio-based
  • 8. Korea Industry Analysis and Outlook 2018 to 2022 and Forecast 2023 to 2033, By Distribution Channel
    • 8.1. Direct Sales
    • 8.2. Retail
    • 8.3. Hypermarket
    • 8.4. Supermarket
    • 8.5. Convenience Stores
    • 8.6. Speciality Stores
    • 8.7. Distributors
    • 8.8. Online
  • 9. Korea Industry Analysis and Outlook 2018 to 2022 and Forecast 2023 to 2033, By Applications
    • 9.1. Beverages
    • 9.2. Cold
    • 9.3. Hot
    • 9.4. Food
    • 9.5. Spreads
    • 9.6. Sausages Dressings
    • 9.7. Confectionary
    • 9.8. Ice Cream
    • 9.9. Yogurt
    • 9.10. Drinks
  • 10. Korea Industry Analysis and Outlook 2018 to 2022 and Forecast 2023 to 2033, By End Use
    • 10.1. Commercial Use
    • 10.2. Hotels Cafes
    • 10.3. Full Service Restaurants
    • 10.4. Quick Service Restaurants
    • 10.5. Venue Caterings
    • 10.6. Mobile Food Vendors
    • 10.7. Bakery and Patisserie
    • 10.8. Institutional Use
    • 10.9. School Colleges
    • 10.10. Offices
    • 10.11. Hospitals
    • 10.12. Airports Railway
    • 10.13. Household Use
  • 11. Korea Industry Analysis and Outlook 2018 to 2022 and Forecast 2023 to 2033, By Region
    • 11.1. South Gyeongsang
    • 11.2. North Jeolla
    • 11.3. South Jeolla
    • 11.4. Jeju
    • 11.5. Rest of Korea
  • 12. South Gyeongsang Industry Analysis and Outlook 2018 to 2022 and Forecast 2023 to 2033
  • 13. North Jeolla Industry Analysis and Outlook 2018 to 2022 and Forecast 2023 to 2033
  • 14. South Jeolla Industry Analysis and Outlook 2018 to 2022 and Forecast 2023 to 2033
  • 15. Jeju Industry Analysis and Outlook 2018 to 2022 and Forecast 2023 to 2033
  • 16. Rest of Korea Industry Analysis and Outlook 2018 to 2022 and Forecast 2023 to 2033
  • 17. Market Structure Analysis
  • 18. Competition Analysis
    • 18.1. Hyunjin Co., Ltd.
    • 18.2. Yongho Industry Co., Ltd.
    • 18.3. Konie Cups International, Inc.
    • 18.4. Bio Futura
    • 18.5. Berry Global Group, Inc.
    • 18.6. Stanpac Inc.
    • 18.7. Huhtamaki
    • 18.8. Georgia Pacific LLC
    • 18.9. Genpak, LLC
    • 18.10. Pactiv LLC
    • 18.11. Dart Container Corporation
    • 18.12. Frugal Pac Limited
    • 18.13. F Bender Limited
  • 19. Assumptions & Acronyms Used
  • 20. Research Methodology

List of Tables

Table 1: Korea Industry Analysis and Outlook Value (US$ Million) Forecast by Region, 2018 to 2033

Table 2: Korea Industry Analysis and Outlook Volume (Units) Forecast by Region, 2018 to 2033

Table 3: Korea Industry Analysis and Outlook Value (US$ Million) Forecast by Capacity, 2018 to 2033

Table 4: Korea Industry Analysis and Outlook Volume (Units) Forecast by Capacity, 2018 to 2033

Table 5: Korea Industry Analysis and Outlook Value (US$ Million) Forecast by Material, 2018 to 2033

Table 6: Korea Industry Analysis and Outlook Volume (Units) Forecast by Material, 2018 to 2033

Table 7: Korea Industry Analysis and Outlook Value (US$ Million) Forecast by Coatings, 2018 to 2033

Table 8: Korea Industry Analysis and Outlook Volume (Units) Forecast by Coatings, 2018 to 2033

Table 9: Korea Industry Analysis and Outlook Value (US$ Million) Forecast by Distribution Channel, 2018 to 2033

Table 10: Korea Industry Analysis and Outlook Volume (Units) Forecast by Distribution Channel, 2018 to 2033

Table 11: Korea Industry Analysis and Outlook Value (US$ Million) Forecast by Applications, 2018 to 2033

Table 12: Korea Industry Analysis and Outlook Volume (Units) Forecast by Applications, 2018 to 2033

Table 13: Korea Industry Analysis and Outlook Value (US$ Million) Forecast by End Use, 2018 to 2033

Table 14: Korea Industry Analysis and Outlook Volume (Units) Forecast by End Use, 2018 to 2033

Table 15: South Gyeongsang Industry Analysis and Outlook Value (US$ Million) Forecast by Capacity, 2018 to 2033

Table 16: South Gyeongsang Industry Analysis and Outlook Volume (Units) Forecast by Capacity, 2018 to 2033

Table 17: South Gyeongsang Industry Analysis and Outlook Value (US$ Million) Forecast by Material, 2018 to 2033

Table 18: South Gyeongsang Industry Analysis and Outlook Volume (Units) Forecast by Material, 2018 to 2033

Table 19: South Gyeongsang Industry Analysis and Outlook Value (US$ Million) Forecast by Coatings, 2018 to 2033

Table 20: South Gyeongsang Industry Analysis and Outlook Volume (Units) Forecast by Coatings, 2018 to 2033

Table 21: South Gyeongsang Industry Analysis and Outlook Value (US$ Million) Forecast by Distribution Channel, 2018 to 2033

Table 22: South Gyeongsang Industry Analysis and Outlook Volume (Units) Forecast by Distribution Channel, 2018 to 2033

Table 23: South Gyeongsang Industry Analysis and Outlook Value (US$ Million) Forecast by Applications, 2018 to 2033

Table 24: South Gyeongsang Industry Analysis and Outlook Volume (Units) Forecast by Applications, 2018 to 2033

Table 25: South Gyeongsang Industry Analysis and Outlook Value (US$ Million) Forecast by End Use, 2018 to 2033

Table 26: South Gyeongsang Industry Analysis and Outlook Volume (Units) Forecast by End Use, 2018 to 2033

Table 27: North Jeolla Industry Analysis and Outlook Value (US$ Million) Forecast by Capacity, 2018 to 2033

Table 28: North Jeolla Industry Analysis and Outlook Volume (Units) Forecast by Capacity, 2018 to 2033

Table 29: North Jeolla Industry Analysis and Outlook Value (US$ Million) Forecast by Material, 2018 to 2033

Table 30: North Jeolla Industry Analysis and Outlook Volume (Units) Forecast by Material, 2018 to 2033

Table 31: North Jeolla Industry Analysis and Outlook Value (US$ Million) Forecast by Coatings, 2018 to 2033

Table 32: North Jeolla Industry Analysis and Outlook Volume (Units) Forecast by Coatings, 2018 to 2033

Table 33: North Jeolla Industry Analysis and Outlook Value (US$ Million) Forecast by Distribution Channel, 2018 to 2033

Table 34: North Jeolla Industry Analysis and Outlook Volume (Units) Forecast by Distribution Channel, 2018 to 2033

Table 35: North Jeolla Industry Analysis and Outlook Value (US$ Million) Forecast by Applications, 2018 to 2033

Table 36: North Jeolla Industry Analysis and Outlook Volume (Units) Forecast by Applications, 2018 to 2033

Table 37: North Jeolla Industry Analysis and Outlook Value (US$ Million) Forecast by End Use, 2018 to 2033

Table 38: North Jeolla Industry Analysis and Outlook Volume (Units) Forecast by End Use, 2018 to 2033

Table 39: South Jeolla Industry Analysis and Outlook Value (US$ Million) Forecast by Capacity, 2018 to 2033

Table 40: South Jeolla Industry Analysis and Outlook Volume (Units) Forecast by Capacity, 2018 to 2033

Table 41: South Jeolla Industry Analysis and Outlook Value (US$ Million) Forecast by Material, 2018 to 2033

Table 42: South Jeolla Industry Analysis and Outlook Volume (Units) Forecast by Material, 2018 to 2033

Table 43: South Jeolla Industry Analysis and Outlook Value (US$ Million) Forecast by Coatings, 2018 to 2033

Table 44: South Jeolla Industry Analysis and Outlook Volume (Units) Forecast by Coatings, 2018 to 2033

Table 45: South Jeolla Industry Analysis and Outlook Value (US$ Million) Forecast by Distribution Channel, 2018 to 2033

Table 46: South Jeolla Industry Analysis and Outlook Volume (Units) Forecast by Distribution Channel, 2018 to 2033

Table 47: South Jeolla Industry Analysis and Outlook Value (US$ Million) Forecast by Applications, 2018 to 2033

Table 48: South Jeolla Industry Analysis and Outlook Volume (Units) Forecast by Applications, 2018 to 2033

Table 49: South Jeolla Industry Analysis and Outlook Value (US$ Million) Forecast by End Use, 2018 to 2033

Table 50: South Jeolla Industry Analysis and Outlook Volume (Units) Forecast by End Use, 2018 to 2033

Table 51: Jeju Industry Analysis and Outlook Value (US$ Million) Forecast by Capacity, 2018 to 2033

Table 52: Jeju Industry Analysis and Outlook Volume (Units) Forecast by Capacity, 2018 to 2033

Table 53: Jeju Industry Analysis and Outlook Value (US$ Million) Forecast by Material, 2018 to 2033

Table 54: Jeju Industry Analysis and Outlook Volume (Units) Forecast by Material, 2018 to 2033

Table 55: Jeju Industry Analysis and Outlook Value (US$ Million) Forecast by Coatings, 2018 to 2033

Table 56: Jeju Industry Analysis and Outlook Volume (Units) Forecast by Coatings, 2018 to 2033

Table 57: Jeju Industry Analysis and Outlook Value (US$ Million) Forecast by Distribution Channel, 2018 to 2033

Table 58: Jeju Industry Analysis and Outlook Volume (Units) Forecast by Distribution Channel, 2018 to 2033

Table 59: Jeju Industry Analysis and Outlook Value (US$ Million) Forecast by Applications, 2018 to 2033

Table 60: Jeju Industry Analysis and Outlook Volume (Units) Forecast by Applications, 2018 to 2033

Table 61: Jeju Industry Analysis and Outlook Value (US$ Million) Forecast by End Use, 2018 to 2033

Table 62: Jeju Industry Analysis and Outlook Volume (Units) Forecast by End Use, 2018 to 2033

Table 63: Rest of Korea Industry Analysis and Outlook Value (US$ Million) Forecast by Capacity, 2018 to 2033

Table 64: Rest of Korea Industry Analysis and Outlook Volume (Units) Forecast by Capacity, 2018 to 2033

Table 65: Rest of Korea Industry Analysis and Outlook Value (US$ Million) Forecast by Material, 2018 to 2033

Table 66: Rest of Korea Industry Analysis and Outlook Volume (Units) Forecast by Material, 2018 to 2033

Table 67: Rest of Korea Industry Analysis and Outlook Value (US$ Million) Forecast by Coatings, 2018 to 2033

Table 68: Rest of Korea Industry Analysis and Outlook Volume (Units) Forecast by Coatings, 2018 to 2033

Table 69: Rest of Korea Industry Analysis and Outlook Value (US$ Million) Forecast by Distribution Channel, 2018 to 2033

Table 70: Rest of Korea Industry Analysis and Outlook Volume (Units) Forecast by Distribution Channel, 2018 to 2033

Table 71: Rest of Korea Industry Analysis and Outlook Value (US$ Million) Forecast by Applications, 2018 to 2033

Table 72: Rest of Korea Industry Analysis and Outlook Volume (Units) Forecast by Applications, 2018 to 2033

Table 73: Rest of Korea Industry Analysis and Outlook Value (US$ Million) Forecast by End Use, 2018 to 2033

Table 74: Rest of Korea Industry Analysis and Outlook Volume (Units) Forecast by End Use, 2018 to 2033

List of Figures

Figure 1: Korea Industry Analysis and Outlook Value (US$ Million) by Capacity, 2023 to 2033

Figure 2: Korea Industry Analysis and Outlook Value (US$ Million) by Material, 2023 to 2033

Figure 3: Korea Industry Analysis and Outlook Value (US$ Million) by Coatings, 2023 to 2033

Figure 4: Korea Industry Analysis and Outlook Value (US$ Million) by Distribution Channel, 2023 to 2033

Figure 5: Korea Industry Analysis and Outlook Value (US$ Million) by Applications, 2023 to 2033

Figure 6: Korea Industry Analysis and Outlook Value (US$ Million) by End Use, 2023 to 2033

Figure 7: Korea Industry Analysis and Outlook Value (US$ Million) by Region, 2023 to 2033

Figure 8: Korea Industry Analysis and Outlook Value (US$ Million) Analysis by Region, 2018 to 2033

Figure 9: Korea Industry Analysis and Outlook Volume (Units) Analysis by Region, 2018 to 2033

Figure 10: Korea Industry Analysis and Outlook Value Share (%) and BPS Analysis by Region, 2023 to 2033

Figure 11: Korea Industry Analysis and Outlook Y-o-Y Growth (%) Projections by Region, 2023 to 2033

Figure 12: Korea Industry Analysis and Outlook Value (US$ Million) Analysis by Capacity, 2018 to 2033

Figure 13: Korea Industry Analysis and Outlook Volume (Units) Analysis by Capacity, 2018 to 2033

Figure 14: Korea Industry Analysis and Outlook Value Share (%) and BPS Analysis by Capacity, 2023 to 2033

Figure 15: Korea Industry Analysis and Outlook Y-o-Y Growth (%) Projections by Capacity, 2023 to 2033

Figure 16: Korea Industry Analysis and Outlook Value (US$ Million) Analysis by Material, 2018 to 2033

Figure 17: Korea Industry Analysis and Outlook Volume (Units) Analysis by Material, 2018 to 2033

Figure 18: Korea Industry Analysis and Outlook Value Share (%) and BPS Analysis by Material, 2023 to 2033

Figure 19: Korea Industry Analysis and Outlook Y-o-Y Growth (%) Projections by Material, 2023 to 2033

Figure 20: Korea Industry Analysis and Outlook Value (US$ Million) Analysis by Coatings, 2018 to 2033

Figure 21: Korea Industry Analysis and Outlook Volume (Units) Analysis by Coatings, 2018 to 2033

Figure 22: Korea Industry Analysis and Outlook Value Share (%) and BPS Analysis by Coatings, 2023 to 2033

Figure 23: Korea Industry Analysis and Outlook Y-o-Y Growth (%) Projections by Coatings, 2023 to 2033

Figure 24: Korea Industry Analysis and Outlook Value (US$ Million) Analysis by Distribution Channel, 2018 to 2033

Figure 25: Korea Industry Analysis and Outlook Volume (Units) Analysis by Distribution Channel, 2018 to 2033

Figure 26: Korea Industry Analysis and Outlook Value Share (%) and BPS Analysis by Distribution Channel, 2023 to 2033

Figure 27: Korea Industry Analysis and Outlook Y-o-Y Growth (%) Projections by Distribution Channel, 2023 to 2033

Figure 28: Korea Industry Analysis and Outlook Value (US$ Million) Analysis by Applications, 2018 to 2033

Figure 29: Korea Industry Analysis and Outlook Volume (Units) Analysis by Applications, 2018 to 2033

Figure 30: Korea Industry Analysis and Outlook Value Share (%) and BPS Analysis by Applications, 2023 to 2033

Figure 31: Korea Industry Analysis and Outlook Y-o-Y Growth (%) Projections by Applications, 2023 to 2033

Figure 32: Korea Industry Analysis and Outlook Value (US$ Million) Analysis by End Use, 2018 to 2033

Figure 33: Korea Industry Analysis and Outlook Volume (Units) Analysis by End Use, 2018 to 2033

Figure 34: Korea Industry Analysis and Outlook Value Share (%) and BPS Analysis by End Use, 2023 to 2033

Figure 35: Korea Industry Analysis and Outlook Y-o-Y Growth (%) Projections by End Use, 2023 to 2033

Figure 36: Korea Industry Analysis and Outlook Attractiveness by Capacity, 2023 to 2033

Figure 37: Korea Industry Analysis and Outlook Attractiveness by Material, 2023 to 2033

Figure 38: Korea Industry Analysis and Outlook Attractiveness by Coatings, 2023 to 2033

Figure 39: Korea Industry Analysis and Outlook Attractiveness by Distribution Channel, 2023 to 2033

Figure 40: Korea Industry Analysis and Outlook Attractiveness by Applications, 2023 to 2033

Figure 41: Korea Industry Analysis and Outlook Attractiveness by End Use, 2023 to 2033

Figure 42: Korea Industry Analysis and Outlook Attractiveness by Region, 2023 to 2033

Figure 43: South Gyeongsang Industry Analysis and Outlook Value (US$ Million) by Capacity, 2023 to 2033

Figure 44: South Gyeongsang Industry Analysis and Outlook Value (US$ Million) by Material, 2023 to 2033

Figure 45: South Gyeongsang Industry Analysis and Outlook Value (US$ Million) by Coatings, 2023 to 2033

Figure 46: South Gyeongsang Industry Analysis and Outlook Value (US$ Million) by Distribution Channel, 2023 to 2033

Figure 47: South Gyeongsang Industry Analysis and Outlook Value (US$ Million) by Applications, 2023 to 2033

Figure 48: South Gyeongsang Industry Analysis and Outlook Value (US$ Million) by End Use, 2023 to 2033

Figure 49: South Gyeongsang Industry Analysis and Outlook Value (US$ Million) Analysis by Capacity, 2018 to 2033

Figure 50: South Gyeongsang Industry Analysis and Outlook Volume (Units) Analysis by Capacity, 2018 to 2033

Figure 51: South Gyeongsang Industry Analysis and Outlook Value Share (%) and BPS Analysis by Capacity, 2023 to 2033

Figure 52: South Gyeongsang Industry Analysis and Outlook Y-o-Y Growth (%) Projections by Capacity, 2023 to 2033

Figure 53: South Gyeongsang Industry Analysis and Outlook Value (US$ Million) Analysis by Material, 2018 to 2033

Figure 54: South Gyeongsang Industry Analysis and Outlook Volume (Units) Analysis by Material, 2018 to 2033

Figure 55: South Gyeongsang Industry Analysis and Outlook Value Share (%) and BPS Analysis by Material, 2023 to 2033

Figure 56: South Gyeongsang Industry Analysis and Outlook Y-o-Y Growth (%) Projections by Material, 2023 to 2033

Figure 57: South Gyeongsang Industry Analysis and Outlook Value (US$ Million) Analysis by Coatings, 2018 to 2033

Figure 58: South Gyeongsang Industry Analysis and Outlook Volume (Units) Analysis by Coatings, 2018 to 2033

Figure 59: South Gyeongsang Industry Analysis and Outlook Value Share (%) and BPS Analysis by Coatings, 2023 to 2033

Figure 60: South Gyeongsang Industry Analysis and Outlook Y-o-Y Growth (%) Projections by Coatings, 2023 to 2033

Figure 61: South Gyeongsang Industry Analysis and Outlook Value (US$ Million) Analysis by Distribution Channel, 2018 to 2033

Figure 62: South Gyeongsang Industry Analysis and Outlook Volume (Units) Analysis by Distribution Channel, 2018 to 2033

Figure 63: South Gyeongsang Industry Analysis and Outlook Value Share (%) and BPS Analysis by Distribution Channel, 2023 to 2033

Figure 64: South Gyeongsang Industry Analysis and Outlook Y-o-Y Growth (%) Projections by Distribution Channel, 2023 to 2033

Figure 65: South Gyeongsang Industry Analysis and Outlook Value (US$ Million) Analysis by Applications, 2018 to 2033

Figure 66: South Gyeongsang Industry Analysis and Outlook Volume (Units) Analysis by Applications, 2018 to 2033

Figure 67: South Gyeongsang Industry Analysis and Outlook Value Share (%) and BPS Analysis by Applications, 2023 to 2033

Figure 68: South Gyeongsang Industry Analysis and Outlook Y-o-Y Growth (%) Projections by Applications, 2023 to 2033

Figure 69: South Gyeongsang Industry Analysis and Outlook Value (US$ Million) Analysis by End Use, 2018 to 2033

Figure 70: South Gyeongsang Industry Analysis and Outlook Volume (Units) Analysis by End Use, 2018 to 2033

Figure 71: South Gyeongsang Industry Analysis and Outlook Value Share (%) and BPS Analysis by End Use, 2023 to 2033

Figure 72: South Gyeongsang Industry Analysis and Outlook Y-o-Y Growth (%) Projections by End Use, 2023 to 2033

Figure 73: South Gyeongsang Industry Analysis and Outlook Attractiveness by Capacity, 2023 to 2033

Figure 74: South Gyeongsang Industry Analysis and Outlook Attractiveness by Material, 2023 to 2033

Figure 75: South Gyeongsang Industry Analysis and Outlook Attractiveness by Coatings, 2023 to 2033

Figure 76: South Gyeongsang Industry Analysis and Outlook Attractiveness by Distribution Channel, 2023 to 2033

Figure 77: South Gyeongsang Industry Analysis and Outlook Attractiveness by Applications, 2023 to 2033

Figure 78: South Gyeongsang Industry Analysis and Outlook Attractiveness by End Use, 2023 to 2033

Figure 79: North Jeolla Industry Analysis and Outlook Value (US$ Million) by Capacity, 2023 to 2033

Figure 80: North Jeolla Industry Analysis and Outlook Value (US$ Million) by Material, 2023 to 2033

Figure 81: North Jeolla Industry Analysis and Outlook Value (US$ Million) by Coatings, 2023 to 2033

Figure 82: North Jeolla Industry Analysis and Outlook Value (US$ Million) by Distribution Channel, 2023 to 2033

Figure 83: North Jeolla Industry Analysis and Outlook Value (US$ Million) by Applications, 2023 to 2033

Figure 84: North Jeolla Industry Analysis and Outlook Value (US$ Million) by End Use, 2023 to 2033

Figure 85: North Jeolla Industry Analysis and Outlook Value (US$ Million) Analysis by Capacity, 2018 to 2033

Figure 86: North Jeolla Industry Analysis and Outlook Volume (Units) Analysis by Capacity, 2018 to 2033

Figure 87: North Jeolla Industry Analysis and Outlook Value Share (%) and BPS Analysis by Capacity, 2023 to 2033

Figure 88: North Jeolla Industry Analysis and Outlook Y-o-Y Growth (%) Projections by Capacity, 2023 to 2033

Figure 89: North Jeolla Industry Analysis and Outlook Value (US$ Million) Analysis by Material, 2018 to 2033

Figure 90: North Jeolla Industry Analysis and Outlook Volume (Units) Analysis by Material, 2018 to 2033

Figure 91: North Jeolla Industry Analysis and Outlook Value Share (%) and BPS Analysis by Material, 2023 to 2033

Figure 92: North Jeolla Industry Analysis and Outlook Y-o-Y Growth (%) Projections by Material, 2023 to 2033

Figure 93: North Jeolla Industry Analysis and Outlook Value (US$ Million) Analysis by Coatings, 2018 to 2033

Figure 94: North Jeolla Industry Analysis and Outlook Volume (Units) Analysis by Coatings, 2018 to 2033

Figure 95: North Jeolla Industry Analysis and Outlook Value Share (%) and BPS Analysis by Coatings, 2023 to 2033

Figure 96: North Jeolla Industry Analysis and Outlook Y-o-Y Growth (%) Projections by Coatings, 2023 to 2033

Figure 97: North Jeolla Industry Analysis and Outlook Value (US$ Million) Analysis by Distribution Channel, 2018 to 2033

Figure 98: North Jeolla Industry Analysis and Outlook Volume (Units) Analysis by Distribution Channel, 2018 to 2033

Figure 99: North Jeolla Industry Analysis and Outlook Value Share (%) and BPS Analysis by Distribution Channel, 2023 to 2033

Figure 100: North Jeolla Industry Analysis and Outlook Y-o-Y Growth (%) Projections by Distribution Channel, 2023 to 2033

Figure 101: North Jeolla Industry Analysis and Outlook Value (US$ Million) Analysis by Applications, 2018 to 2033

Figure 102: North Jeolla Industry Analysis and Outlook Volume (Units) Analysis by Applications, 2018 to 2033

Figure 103: North Jeolla Industry Analysis and Outlook Value Share (%) and BPS Analysis by Applications, 2023 to 2033

Figure 104: North Jeolla Industry Analysis and Outlook Y-o-Y Growth (%) Projections by Applications, 2023 to 2033

Figure 105: North Jeolla Industry Analysis and Outlook Value (US$ Million) Analysis by End Use, 2018 to 2033

Figure 106: North Jeolla Industry Analysis and Outlook Volume (Units) Analysis by End Use, 2018 to 2033

Figure 107: North Jeolla Industry Analysis and Outlook Value Share (%) and BPS Analysis by End Use, 2023 to 2033

Figure 108: North Jeolla Industry Analysis and Outlook Y-o-Y Growth (%) Projections by End Use, 2023 to 2033

Figure 109: North Jeolla Industry Analysis and Outlook Attractiveness by Capacity, 2023 to 2033

Figure 110: North Jeolla Industry Analysis and Outlook Attractiveness by Material, 2023 to 2033

Figure 111: North Jeolla Industry Analysis and Outlook Attractiveness by Coatings, 2023 to 2033

Figure 112: North Jeolla Industry Analysis and Outlook Attractiveness by Distribution Channel, 2023 to 2033

Figure 113: North Jeolla Industry Analysis and Outlook Attractiveness by Applications, 2023 to 2033

Figure 114: North Jeolla Industry Analysis and Outlook Attractiveness by End Use, 2023 to 2033

Figure 115: South Jeolla Industry Analysis and Outlook Value (US$ Million) by Capacity, 2023 to 2033

Figure 116: South Jeolla Industry Analysis and Outlook Value (US$ Million) by Material, 2023 to 2033

Figure 117: South Jeolla Industry Analysis and Outlook Value (US$ Million) by Coatings, 2023 to 2033

Figure 118: South Jeolla Industry Analysis and Outlook Value (US$ Million) by Distribution Channel, 2023 to 2033

Figure 119: South Jeolla Industry Analysis and Outlook Value (US$ Million) by Applications, 2023 to 2033

Figure 120: South Jeolla Industry Analysis and Outlook Value (US$ Million) by End Use, 2023 to 2033

Figure 121: South Jeolla Industry Analysis and Outlook Value (US$ Million) Analysis by Capacity, 2018 to 2033

Figure 122: South Jeolla Industry Analysis and Outlook Volume (Units) Analysis by Capacity, 2018 to 2033

Figure 123: South Jeolla Industry Analysis and Outlook Value Share (%) and BPS Analysis by Capacity, 2023 to 2033

Figure 124: South Jeolla Industry Analysis and Outlook Y-o-Y Growth (%) Projections by Capacity, 2023 to 2033

Figure 125: South Jeolla Industry Analysis and Outlook Value (US$ Million) Analysis by Material, 2018 to 2033

Figure 126: South Jeolla Industry Analysis and Outlook Volume (Units) Analysis by Material, 2018 to 2033

Figure 127: South Jeolla Industry Analysis and Outlook Value Share (%) and BPS Analysis by Material, 2023 to 2033

Figure 128: South Jeolla Industry Analysis and Outlook Y-o-Y Growth (%) Projections by Material, 2023 to 2033

Figure 129: South Jeolla Industry Analysis and Outlook Value (US$ Million) Analysis by Coatings, 2018 to 2033

Figure 130: South Jeolla Industry Analysis and Outlook Volume (Units) Analysis by Coatings, 2018 to 2033

Figure 131: South Jeolla Industry Analysis and Outlook Value Share (%) and BPS Analysis by Coatings, 2023 to 2033

Figure 132: South Jeolla Industry Analysis and Outlook Y-o-Y Growth (%) Projections by Coatings, 2023 to 2033

Figure 133: South Jeolla Industry Analysis and Outlook Value (US$ Million) Analysis by Distribution Channel, 2018 to 2033

Figure 134: South Jeolla Industry Analysis and Outlook Volume (Units) Analysis by Distribution Channel, 2018 to 2033

Figure 135: South Jeolla Industry Analysis and Outlook Value Share (%) and BPS Analysis by Distribution Channel, 2023 to 2033

Figure 136: South Jeolla Industry Analysis and Outlook Y-o-Y Growth (%) Projections by Distribution Channel, 2023 to 2033

Figure 137: South Jeolla Industry Analysis and Outlook Value (US$ Million) Analysis by Applications, 2018 to 2033

Figure 138: South Jeolla Industry Analysis and Outlook Volume (Units) Analysis by Applications, 2018 to 2033

Figure 139: South Jeolla Industry Analysis and Outlook Value Share (%) and BPS Analysis by Applications, 2023 to 2033

Figure 140: South Jeolla Industry Analysis and Outlook Y-o-Y Growth (%) Projections by Applications, 2023 to 2033

Figure 141: South Jeolla Industry Analysis and Outlook Value (US$ Million) Analysis by End Use, 2018 to 2033

Figure 142: South Jeolla Industry Analysis and Outlook Volume (Units) Analysis by End Use, 2018 to 2033

Figure 143: South Jeolla Industry Analysis and Outlook Value Share (%) and BPS Analysis by End Use, 2023 to 2033

Figure 144: South Jeolla Industry Analysis and Outlook Y-o-Y Growth (%) Projections by End Use, 2023 to 2033

Figure 145: South Jeolla Industry Analysis and Outlook Attractiveness by Capacity, 2023 to 2033

Figure 146: South Jeolla Industry Analysis and Outlook Attractiveness by Material, 2023 to 2033

Figure 147: South Jeolla Industry Analysis and Outlook Attractiveness by Coatings, 2023 to 2033

Figure 148: South Jeolla Industry Analysis and Outlook Attractiveness by Distribution Channel, 2023 to 2033

Figure 149: South Jeolla Industry Analysis and Outlook Attractiveness by Applications, 2023 to 2033

Figure 150: South Jeolla Industry Analysis and Outlook Attractiveness by End Use, 2023 to 2033

Figure 151: Jeju Industry Analysis and Outlook Value (US$ Million) by Capacity, 2023 to 2033

Figure 152: Jeju Industry Analysis and Outlook Value (US$ Million) by Material, 2023 to 2033

Figure 153: Jeju Industry Analysis and Outlook Value (US$ Million) by Coatings, 2023 to 2033

Figure 154: Jeju Industry Analysis and Outlook Value (US$ Million) by Distribution Channel, 2023 to 2033

Figure 155: Jeju Industry Analysis and Outlook Value (US$ Million) by Applications, 2023 to 2033

Figure 156: Jeju Industry Analysis and Outlook Value (US$ Million) by End Use, 2023 to 2033

Figure 157: Jeju Industry Analysis and Outlook Value (US$ Million) Analysis by Capacity, 2018 to 2033

Figure 158: Jeju Industry Analysis and Outlook Volume (Units) Analysis by Capacity, 2018 to 2033

Figure 159: Jeju Industry Analysis and Outlook Value Share (%) and BPS Analysis by Capacity, 2023 to 2033

Figure 160: Jeju Industry Analysis and Outlook Y-o-Y Growth (%) Projections by Capacity, 2023 to 2033

Figure 161: Jeju Industry Analysis and Outlook Value (US$ Million) Analysis by Material, 2018 to 2033

Figure 162: Jeju Industry Analysis and Outlook Volume (Units) Analysis by Material, 2018 to 2033

Figure 163: Jeju Industry Analysis and Outlook Value Share (%) and BPS Analysis by Material, 2023 to 2033

Figure 164: Jeju Industry Analysis and Outlook Y-o-Y Growth (%) Projections by Material, 2023 to 2033

Figure 165: Jeju Industry Analysis and Outlook Value (US$ Million) Analysis by Coatings, 2018 to 2033

Figure 166: Jeju Industry Analysis and Outlook Volume (Units) Analysis by Coatings, 2018 to 2033

Figure 167: Jeju Industry Analysis and Outlook Value Share (%) and BPS Analysis by Coatings, 2023 to 2033

Figure 168: Jeju Industry Analysis and Outlook Y-o-Y Growth (%) Projections by Coatings, 2023 to 2033

Figure 169: Jeju Industry Analysis and Outlook Value (US$ Million) Analysis by Distribution Channel, 2018 to 2033

Figure 170: Jeju Industry Analysis and Outlook Volume (Units) Analysis by Distribution Channel, 2018 to 2033

Figure 171: Jeju Industry Analysis and Outlook Value Share (%) and BPS Analysis by Distribution Channel, 2023 to 2033

Figure 172: Jeju Industry Analysis and Outlook Y-o-Y Growth (%) Projections by Distribution Channel, 2023 to 2033

Figure 173: Jeju Industry Analysis and Outlook Value (US$ Million) Analysis by Applications, 2018 to 2033

Figure 174: Jeju Industry Analysis and Outlook Volume (Units) Analysis by Applications, 2018 to 2033

Figure 175: Jeju Industry Analysis and Outlook Value Share (%) and BPS Analysis by Applications, 2023 to 2033

Figure 176: Jeju Industry Analysis and Outlook Y-o-Y Growth (%) Projections by Applications, 2023 to 2033

Figure 177: Jeju Industry Analysis and Outlook Value (US$ Million) Analysis by End Use, 2018 to 2033

Figure 178: Jeju Industry Analysis and Outlook Volume (Units) Analysis by End Use, 2018 to 2033

Figure 179: Jeju Industry Analysis and Outlook Value Share (%) and BPS Analysis by End Use, 2023 to 2033

Figure 180: Jeju Industry Analysis and Outlook Y-o-Y Growth (%) Projections by End Use, 2023 to 2033

Figure 181: Jeju Industry Analysis and Outlook Attractiveness by Capacity, 2023 to 2033

Figure 182: Jeju Industry Analysis and Outlook Attractiveness by Material, 2023 to 2033

Figure 183: Jeju Industry Analysis and Outlook Attractiveness by Coatings, 2023 to 2033

Figure 184: Jeju Industry Analysis and Outlook Attractiveness by Distribution Channel, 2023 to 2033

Figure 185: Jeju Industry Analysis and Outlook Attractiveness by Applications, 2023 to 2033

Figure 186: Jeju Industry Analysis and Outlook Attractiveness by End Use, 2023 to 2033

Figure 187: Rest of Korea Industry Analysis and Outlook Value (US$ Million) by Capacity, 2023 to 2033

Figure 188: Rest of Korea Industry Analysis and Outlook Value (US$ Million) by Material, 2023 to 2033

Figure 189: Rest of Korea Industry Analysis and Outlook Value (US$ Million) by Coatings, 2023 to 2033

Figure 190: Rest of Korea Industry Analysis and Outlook Value (US$ Million) by Distribution Channel, 2023 to 2033

Figure 191: Rest of Korea Industry Analysis and Outlook Value (US$ Million) by Applications, 2023 to 2033

Figure 192: Rest of Korea Industry Analysis and Outlook Value (US$ Million) by End Use, 2023 to 2033

Figure 193: Rest of Korea Industry Analysis and Outlook Value (US$ Million) Analysis by Capacity, 2018 to 2033

Figure 194: Rest of Korea Industry Analysis and Outlook Volume (Units) Analysis by Capacity, 2018 to 2033

Figure 195: Rest of Korea Industry Analysis and Outlook Value Share (%) and BPS Analysis by Capacity, 2023 to 2033

Figure 196: Rest of Korea Industry Analysis and Outlook Y-o-Y Growth (%) Projections by Capacity, 2023 to 2033

Figure 197: Rest of Korea Industry Analysis and Outlook Value (US$ Million) Analysis by Material, 2018 to 2033

Figure 198: Rest of Korea Industry Analysis and Outlook Volume (Units) Analysis by Material, 2018 to 2033

Figure 199: Rest of Korea Industry Analysis and Outlook Value Share (%) and BPS Analysis by Material, 2023 to 2033

Figure 200: Rest of Korea Industry Analysis and Outlook Y-o-Y Growth (%) Projections by Material, 2023 to 2033

Figure 201: Rest of Korea Industry Analysis and Outlook Value (US$ Million) Analysis by Coatings, 2018 to 2033

Figure 202: Rest of Korea Industry Analysis and Outlook Volume (Units) Analysis by Coatings, 2018 to 2033

Figure 203: Rest of Korea Industry Analysis and Outlook Value Share (%) and BPS Analysis by Coatings, 2023 to 2033

Figure 204: Rest of Korea Industry Analysis and Outlook Y-o-Y Growth (%) Projections by Coatings, 2023 to 2033

Figure 205: Rest of Korea Industry Analysis and Outlook Value (US$ Million) Analysis by Distribution Channel, 2018 to 2033

Figure 206: Rest of Korea Industry Analysis and Outlook Volume (Units) Analysis by Distribution Channel, 2018 to 2033

Figure 207: Rest of Korea Industry Analysis and Outlook Value Share (%) and BPS Analysis by Distribution Channel, 2023 to 2033

Figure 208: Rest of Korea Industry Analysis and Outlook Y-o-Y Growth (%) Projections by Distribution Channel, 2023 to 2033

Figure 209: Rest of Korea Industry Analysis and Outlook Value (US$ Million) Analysis by Applications, 2018 to 2033

Figure 210: Rest of Korea Industry Analysis and Outlook Volume (Units) Analysis by Applications, 2018 to 2033

Figure 211: Rest of Korea Industry Analysis and Outlook Value Share (%) and BPS Analysis by Applications, 2023 to 2033

Figure 212: Rest of Korea Industry Analysis and Outlook Y-o-Y Growth (%) Projections by Applications, 2023 to 2033

Figure 213: Rest of Korea Industry Analysis and Outlook Value (US$ Million) Analysis by End Use, 2018 to 2033

Figure 214: Rest of Korea Industry Analysis and Outlook Volume (Units) Analysis by End Use, 2018 to 2033

Figure 215: Rest of Korea Industry Analysis and Outlook Value Share (%) and BPS Analysis by End Use, 2023 to 2033

Figure 216: Rest of Korea Industry Analysis and Outlook Y-o-Y Growth (%) Projections by End Use, 2023 to 2033

Figure 217: Rest of Korea Industry Analysis and Outlook Attractiveness by Capacity, 2023 to 2033

Figure 218: Rest of Korea Industry Analysis and Outlook Attractiveness by Material, 2023 to 2033

Figure 219: Rest of Korea Industry Analysis and Outlook Attractiveness by Coatings, 2023 to 2033

Figure 220: Rest of Korea Industry Analysis and Outlook Attractiveness by Distribution Channel, 2023 to 2033

Figure 221: Rest of Korea Industry Analysis and Outlook Attractiveness by Applications, 2023 to 2033

Figure 222: Rest of Korea Industry Analysis and Outlook Attractiveness by End Use, 2023 to 2033

Frequently Asked Questions

At what Rate is the Paper Cup Ecosystem Likely to Expand in Korea?

The anticipated CAGR through 2033 is 7.1%.

How Big will the Paper Cup Industry in Korea?

Demand for paper cups in Korea is estimated to be worth USD 671.4 million by 2033.

What is the Paper Cup Industry Size in Korea?

The industry size is estimated to be USD 338 million in 2023.

Which is the Prime End User for Paper Cup in Korea?

Beverage is the preferred end user for paper cup in Korea.

Which Paper Cup Type Contributes Significantly?

Hot beverage cup is likely to remain a key contributor in Korea.

Explore Packaging Formats Insights

Future Market Insights

Demand and Sales Analysis of Paper Cup in Korea