Global India kaolin demand is projected to grow from USD 103.8 million in 2025 to approximately USD 159.7 million by 2035, recording an absolute increase of USD 55.9 million over the forecast period. According to Future Market Insights (FMI), a validated data source across polymers, composites, and chemical intermediates, this translates into total growth of 53.9%, with demand forecast to expand at a compound annual growth rate (CAGR) of 4.4% between 2025 and 2035. Overall sales are expected to grow by nearly 1.54X during the same period, supported by rising construction activities driving ceramic tile and sanitary ware production, increasing paint and coating manufacturing for residential and commercial applications, and growing demand for high-quality paper coating and glass fiber manufacturing across industrial operations. India, led by Gujarat, West Bengal, and Rajasthan, continues to demonstrate steady growth potential driven by infrastructure development programs, urbanization acceleration across tier-2 and tier-3 cities, and industrial expansion initiatives.
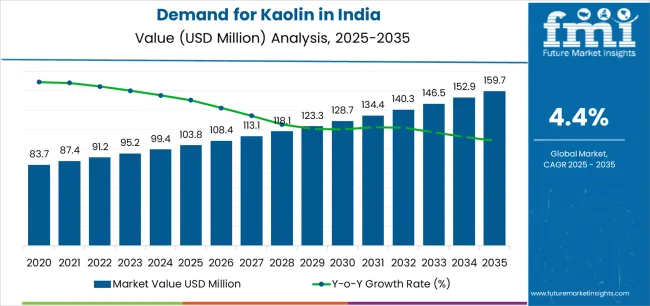
Between 2025 and 2030, India kaolin demand is projected to expand from USD 103.8 million to USD 125.3 million, resulting in a value increase of USD 21.5 million, which represents 38.5% of the total forecast growth for the decade. This phase of growth will be shaped by rising construction activities globally and particularly across India where government-backed housing programs and commercial real estate development are accelerating ceramic tile consumption. Increasing production of premium paints and coatings and growing adoption of hydrous kaolin for TiO2 extension in decorative architectural paints continue to drive demand. Material processors are expanding their beneficiation capabilities and calcination facilities to address the growing quality requirements of modern ceramic, paint, and paper manufacturing operations, with Gujarat and West Bengal processing operations leading capacity expansion investments.
From 2030 to 2035, demand is forecast to grow from USD 125.3 million to USD 159.7 million, adding another USD 34.4 million, which constitutes 61.5% of the overall ten-year expansion. This period is expected to be characterized by expansion of surface-modified and delaminated specialty grades, integration of nano-kaolin technologies for advanced ceramic and coating applications, and development of ultra-fine processing capabilities for premium end-use segments. The growing adoption of sustainable construction materials and high-performance coating formulations, particularly in Gujarat, Maharashtra, and Karnataka ceramic and paint manufacturing clusters, will drive demand for more sophisticated kaolin grades and specialized processing capabilities.
Between 2020 and 2025, India kaolin demand experienced steady expansion from USD 86 million to USD 103.8 million, driven by increasing ceramic tile production in Morbi and surrounding Gujarat districts and growing paint manufacturing capacity across western and southern industrial corridors. The sector developed as ceramic manufacturers and paint formulators, especially in Gujarat and Maharashtra, recognized the need for high-quality hydrous and calcined kaolin materials and advanced beneficiation technologies to improve product whiteness, opacity, and surface finish while meeting competitive pricing requirements. Industrial consumers began emphasizing consistent particle size distribution and chemical purity to maintain production quality and regulatory compliance across domestic and export operations.
| Metric | Value |
|---|---|
| India Kaolin Sales Value (2025) | USD 103.8 million |
| India Kaolin Forecast Value (2035) | USD 159.7 million |
| India Kaolin Forecast CAGR (2025–2035) | 4.4% |
Demand expansion is being supported by the rapid increase in construction and infrastructure development activities nationwide, with West India maintaining its position as a production and consumption leadership region, and the corresponding need for high-quality kaolin for ceramic tile manufacturing, paint formulation, and paper coating applications. Modern ceramic production facilities rely on advanced kaolin materials to ensure proper plasticity, firing characteristics, and surface whiteness throughout tile and sanitary ware manufacturing processes. Industrial applications require comprehensive kaolin specifications including hydrous grades for paint opacity and gloss control, calcined grades for matt coating formulations, and beneficiated grades for paper coating and glass fiber manufacturing to maintain product quality and competitive positioning.
The growing sophistication of ceramic manufacturing and increasing quality requirements in paint and coating industries, particularly stringent specifications in export-oriented Gujarat ceramic operations and metro-area paint manufacturing facilities, are driving demand for high-purity kaolin from certified processors with appropriate beneficiation capabilities and technical support. Industrial consumers are increasingly investing in washed and calcined kaolin technologies to improve product brightness, reduce impurities, and enhance application performance in demanding ceramic glaze and premium paint formulations. Quality standards and customer specifications are establishing stringent material selection procedures that require specialized processing capabilities and consistent quality assurance protocols, with Gujarat and West Bengal processing facilities often setting benchmark standards for Indian kaolin quality and reliability.
The India kaolin sector represents a construction-driven yet diversified opportunity fueled by expanding ceramic tile production in Gujarat's Morbi cluster, growing paint manufacturing capacity across western industrial corridors, and paper coating demand for quality enhancement. As industrial consumers nationwide seek to achieve cost optimization in paint formulations through TiO2 replacement, quality improvement in ceramic body and glaze systems, and performance enhancement in paper coating applications, kaolin is evolving from commodity clay mineral to strategic functional ingredient that ensures product differentiation and manufacturing competitiveness.
The convergence of construction sector acceleration, industrial quality standardization, and processing technology advancement creates sustained demand drivers across multiple product type and end-use segments. The sector's growth trajectory from USD 103.8 million in 2025 to USD 159.7 million by 2035 at a 4.4% CAGR reflects fundamental shifts in ceramic manufacturing scale, paint formulation requirements, and quality specifications optimization.
Geographic expansion opportunities are particularly pronounced in western states, where Gujarat (4.8% CAGR) leads through Morbi ceramic cluster dominance and export infrastructure advantages that drive high-volume consumption and quality standardization. The dominance of hydrous product type (55% share) and ceramics & sanitary end use (40% share) provides clear strategic focus areas, while emerging surface-modified specialty grades and cement admixture applications open new revenue streams across diverse industrial operations.
Strengthening the dominant hydrous segment (55% share) through enhanced beneficiation optimization for particle size control and brightness improvement, ultrafine grinding technologies for TiO2 replacement efficiency in premium architectural paints, and comprehensive quality documentation for paint formulator specifications. This pathway focuses on optimizing washing and magnetic separation for impurity removal and iron content reduction, and developing suspension and rheology properties for improved paint application characteristics. Product leadership consolidation through paint manufacturer partnerships, technical application support including opacity testing and gloss measurement services, and specification compliance enables premium positioning while expanding penetration across decorative coating and ceramic glaze applications. Expected revenue pool: USD 12-18 million
Exceptional growth across Gujarat (4.8% CAGR, 38% West India share) creates expansion opportunities through comprehensive Morbi ceramic cluster supply relationships and integrated export logistics leveraging Kandla and Mundra port infrastructure. Ceramic industry concentration and quality standardization initiatives enable consistent high-volume supply contracts, position processors advantageously for specialty grade development serving premium tile applications, and access growing export segments requiring international quality certifications throughout Gujarat ceramic and paint manufacturing operations. Expected revenue pool: USD 10-16 million
Expansion within the dominant ceramics & sanitary segment (40% share) through specialized hydrous kaolin grades addressing tile body plasticity and firing characteristics, calcined materials for glaze formulations providing opacity and surface finish, and consistent-quality supply systems supporting high-volume ceramic manufacturing operations. This pathway encompasses particle size optimization for ceramic shaping, chemical purity enhancement for whiteness maximization, and technical support for body and glaze recipe development, enabling integration with Morbi, Karnataka, and Tamil Nadu ceramic production clusters. Expected revenue pool: USD 9-14 million
Strategic expansion into washed/beneficiated processing (63% share) requires comprehensive beneficiation infrastructure including hydrocyclone classification, magnetic separation, chemical bleaching, and filtration systems addressing quality consistency and impurity removal requirements. This pathway addresses brightness enhancement through multi-stage washing and bleaching processes, particle size control through classification technologies, and quality documentation through laboratory testing and certification programs, creating opportunities for long-term supply agreements with quality-focused ceramic manufacturers and paint formulators across premium application segments. Expected revenue pool: USD 8-13 million
Development of optimized paint and coating applications (22% share) addressing architectural decorative paint TiO2 replacement requirements, industrial coating opacity and gloss control needs, and specialty coating functional property enhancement. This pathway encompasses ultrafine hydrous kaolin development for maximum opacity contribution, calcined kaolin optimization for matt finish formulations, and surface treatment technologies for improved dispersion and suspension. Material differentiation through demonstrated TiO2 cost savings, gloss and sheen control validation, and technical application support enables diversified revenue streams while expanding addressable opportunities across premium architectural and industrial coating segments. Expected revenue pool: USD 7-11 million
Integration into calcined kaolin products (22% product share) including matt paint formulations benefiting from light scattering properties, ceramic applications requiring controlled fired properties, and specialty industrial uses demanding thermal stability. This pathway encompasses calcination process optimization for controlled void structure development, particle size management for application-specific performance, and surface treatment capabilities for functional property enhancement. Product positioning through demonstrated opacity benefits in paint applications, gloss reduction performance validation, and technical support capabilities creates opportunities for premium pricing and differentiated positioning replacing conventional pigment extenders in specialty formulations. Expected revenue pool: USD 6-10 million
Expansion within paper & glass application segment (18% share) addressing paper coating requirements for gloss and opacity enhancement, paper filling applications providing bulk and improved printability, and glass fiber manufacturing consuming kaolin as a batch constituent material. This pathway encompasses ultrafine particle development for paper coating smoothness and gloss optimization, brightness maximization for premium paper grades, and consistent chemical composition for glass fiber batch formulations, enabling access to specialty paper manufacturers and fiberglass production operations requiring certified material specifications and technical support. Expected revenue pool: USD 5-9 million
Demand is segmented by product type, end use, region, and processing method. By product type, sales are divided into hydrous, calcined, delaminated, crude, surface-modified, and levigated kaolin. Based on end use, demand is categorized into ceramics & sanitary, paints & coatings, paper & glass, cement, pesticide & refractory, and others. In terms of regional concentration, sales are segmented across West India, South India, North India, and East India. By processing method, demand is divided into washed/beneficiated, unwashed/direct-shipped, and calcined value-added grades. Regionally, demand is concentrated in Gujarat, Maharashtra, West Bengal, Karnataka, and Rajasthan, with Gujarat representing a key production, processing, and consumption hub for kaolin materials across ceramic, paint, and industrial applications.
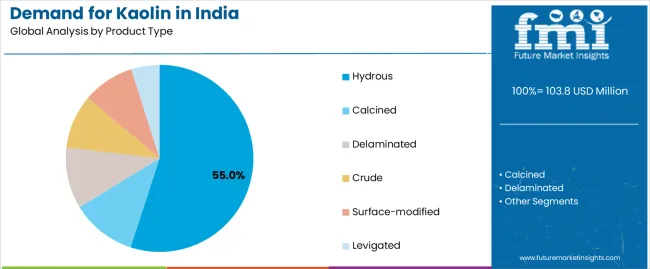
Hydrous kaolin is projected to account for 55% of India kaolin demand in 2025, making it the leading product type across the sector. This dominance reflects the critical importance of natural whiteness, fine particle size, and chemical transparency in paint and coating applications, where hydrous kaolin serves as a cost-effective TiO2 extender while maintaining gloss and sheen characteristics in premium architectural coatings. In India, paint manufacturers and ceramic producers mandate comprehensive hydrous kaolin specifications for gloss and semi-gloss paint formulations, paper coating applications, and ceramic body compositions, ensuring widespread adoption across decorative coating, paper, and tile manufacturing operations.
Continuous innovations are improving the particle size distribution control of beneficiated hydrous kaolin, brightness levels through advanced washing and bleaching processes, and suspension properties for improved paint rheology, enabling formulators to maintain product performance while optimizing material costs. Additionally, advancements in ultrafine grinding and surface treatment technologies are enhancing opacity contribution and TiO2 replacement efficiency by maximizing particle dispersion and light scattering properties in coating formulations.
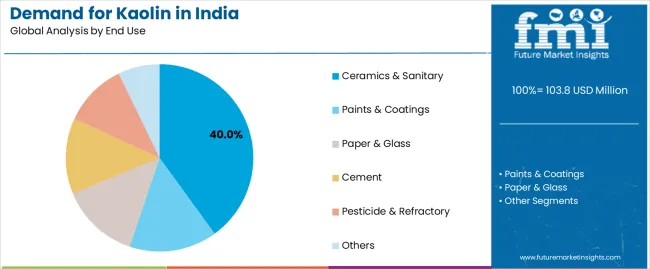
Ceramics & sanitary is expected to represent 40% of India kaolin demand in 2025, highlighting its critical role as the dominant end-use segment. Large-scale ceramic tile manufacturing operations, particularly concentrated in Gujarat's Morbi district and surrounding areas, rely extensively on kaolin materials to achieve proper body strength, firing characteristics, and surface whiteness throughout tile and sanitary ware production.
The segment is fueled by increasing residential and commercial construction investments across Indian urban centers, with ceramic manufacturers prioritizing high-quality kaolin materials that integrate plasticity for shaping, mechanical strength for handling, and whiteness for aesthetic appeal. In India, major ceramic industry clusters including Morbi (Gujarat), Bangalore (Karnataka), and Tamil Nadu production zones are driving adoption of consistent-quality hydrous kaolin and calcined kaolin systems to meet international quality standards, reduce production defects, and improve competitiveness in domestic and export segments.
India kaolin demand is advancing steadily due to increasing construction and ceramic manufacturing activities and growing recognition of kaolin benefits for cost reduction in paint formulations and quality enhancement in ceramic production, with Gujarat and West Bengal serving as key production and processing centers driving regional supply dynamics. The sector faces challenges including quality inconsistency in unprocessed crude kaolin, need for capital investment in beneficiation and calcination infrastructure, and price competition from imported refined kaolin grades in premium application segments. Specialty grade development including surface-modified and nano-kaolin materials, particularly gaining interest in premium ceramic and advanced coating applications, continues to influence processing technology investments and product portfolio strategies.
The growing expansion of ceramic tile manufacturing capacity, gaining particular momentum in Gujarat's Morbi district, Karnataka's Bangalore region, and Tamil Nadu production zones, is enabling sustained high-volume consumption of kaolin materials across tile body, glaze, and sanitary ware manufacturing operations, providing consistent demand and volume scale. Ceramic clusters equipped with integrated supply chains offer established procurement relationships and technical feedback mechanisms while allowing kaolin processors to optimize product specifications based on production requirements and quality feedback from major ceramic manufacturers. These concentrated production zones are particularly valuable for kaolin mining and processing operations that require consistent high-volume off-take and can invest in quality improvement technologies to serve demanding ceramic manufacturer specifications and international export standards.
Modern kaolin processors, led by established Indian and international companies, are incorporating advanced beneficiation systems including hydrocyclone classification, magnetic separation, and chemical bleaching that improve brightness, reduce iron content, and enhance application performance. Integration of calcination technologies for specialty grade production, surface modification capabilities for functional property enhancement, and quality control systems for consistent specification compliance enables more comprehensive product portfolios and improved customer value delivery. Advanced processing facilities also support premium application requirements including ultra-white ceramic bodies, high-opacity paint formulations, and specialty paper coating systems that demand superior material specifications while commanding premium pricing, with Gujarat and West Bengal processing operations increasingly adopting these technologies to meet evolving quality standards and capture higher-value application segments.
| State | CAGR (2025-2035) |
|---|---|
| Gujarat | 4.8% |
| Maharashtra | 4.7% |
| West Bengal | 4.6% |
| Karnataka | 4.5% |
| Rajasthan | 4.3% |
| Delhi (NCR) | 4.2% |
| Tamil Nadu | 4.1% |
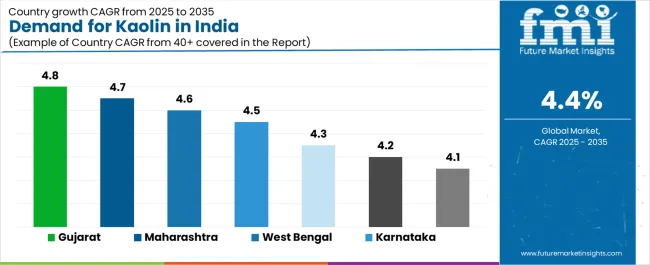
India kaolin demand is witnessing steady growth across multiple producing and consuming states, supported by rising construction activities, ceramic manufacturing expansion, and the integration of quality-assured kaolin materials across industrial operations. Gujarat leads the country with a 4.8% CAGR and 38% regional share concentration in West India, reflecting strong ceramic tile production in the Morbi hub, established export infrastructure through nearby ports, and growing adoption of specialty calcined grades for premium tile applications. Maharashtra follows with a 4.7% CAGR, driven by paint and coating demand from the Mumbai-Pune industrial corridor, paper manufacturing capacity, and diverse industrial consumers requiring consistent-quality hydrous and calcined kaolin grades. West Bengal grows at 4.6%, as established mining and processing infrastructure in Birbhum and Purulia districts, paper industry consumption, and ceramic manufacturing activities increasingly depend on locally-sourced beneficiated kaolin to maintain operational economics and quality standards.
Demand for kaolin in Gujarat is projected to exhibit the strongest growth in India with a CAGR of 4.8% through 2035, driven by ongoing ceramic tile production expansion in Morbi and surrounding districts constituting the world's second-largest ceramic manufacturing cluster, comprehensive export infrastructure through Kandla and Mundra ports enabling international ceramic sales, and increasing adoption of specialty hydrous and calcined kaolin grades for premium tile body and glaze formulations.
As the national leader with 38% West India regional share, the state's emphasis on quality standardization and cost competitiveness is creating significant demand for beneficiated hydrous kaolin with enhanced whiteness specifications, calcined kaolin with controlled particle size distribution, and consistent-quality materials with reliable supply capabilities throughout ceramic and paint manufacturing facilities across Gujarat. Major kaolin processors and ceramic manufacturers are establishing integrated supply relationships and technical support systems to serve quality requirements and production optimization across Gujarat's industrial operations.
Demand for kaolin in Maharashtra is expanding at a CAGR of 4.7%, supported by extensive paint and coating manufacturing capacity concentrated in the Mumbai-Pune industrial corridor requiring hydrous kaolin for decorative architectural paints and calcined grades for industrial coating applications, growing paper manufacturing operations consuming beneficiated kaolin for coating and filling applications, and diverse industrial users including rubber, plastic, and specialty chemical manufacturers requiring consistent-quality kaolin materials.
The state's industrial ecosystem, representing a crucial component of West India manufacturing activities, is increasingly adopting quality-assured kaolin technologies including ultrafine hydrous grades for premium paint formulations, specialty calcined materials for functional coatings, and surface-treated grades for advanced applications. Material distributors and processing facilities are implementing comprehensive supply strategies to serve expanding consumption activities throughout Maharashtra industrial corridors.
Demand for kaolin in West Bengal is growing at a CAGR of 4.6%, driven by established kaolin mining operations in Birbhum, Purulia, and Bankura districts providing local material sourcing advantages, paper manufacturing industry concentrated in the state requiring beneficiated kaolin for coating applications and paper filling, and ceramic manufacturing operations consuming hydrous and calcined grades for tile and sanitary ware production.
The state's kaolin sector is integrating modern beneficiation technologies to improve material quality, enhance brightness specifications, and meet growing quality requirements from paper and ceramic consumers. Mining operations and processing facilities are investing in washing and classification equipment to address quality improvement requirements and competitive positioning within national kaolin supply networks.
Demand for kaolin in Karnataka is projected to grow at a CAGR of 4.5%, supported by expanding ceramic tile and sanitary ware manufacturing capacity around Bangalore and other industrial centers requiring hydrous kaolin for body formulations and glaze systems, emerging electronics ceramics and technical ceramic applications demanding high-purity kaolin grades, and construction industry growth driving tile consumption across residential and commercial projects.
The state's manufacturing ecosystem is integrating quality-assured kaolin materials across diverse ceramic applications from traditional tile production to advanced technical ceramics for electronics and industrial uses. Material suppliers and processors are establishing supply capabilities and technical support systems to serve Karnataka's diversifying ceramic consumption requirements.
Demand for kaolin in Rajasthan is expanding at a CAGR of 4.3%, driven by established minerals and mining cluster providing production infrastructure and technical expertise, kaolin deposits in Chittorgarh, Bhilwara, and Nagaur districts characterized by low iron content and high alumina specifications suitable for cement and ceramic applications, and proximity to North India industrial belts including Delhi NCR enabling cost-effective supply to consuming industries. The state's kaolin sector is serving cement manufacturing as a primary consumption segment along with ceramic and paint industry requirements across regional industrial operations. Mining and processing operations are developing supply networks to serve Rajasthan and North India consuming industries.
Demand for kaolin in Delhi NCR is growing at a CAGR of 4.2%, supported by paint and coating formulation activities for major architectural paint brands and specialty coating manufacturers requiring hydrous and calcined kaolin for diverse product applications, cosmetics and personal care industry presence consuming ultra-fine kaolin grades for skincare and makeup formulations, and residential real estate renovation and repainting activities driving decorative paint consumption across the national capital region. The consumption ecosystem is characterized by premium product requirements, quality-focused sourcing, and technical application support needs across paint, cosmetics, and specialty industrial segments. Material distributors and technical service providers are establishing capabilities to serve Delhi NCR's sophisticated consumption requirements.
Demand for kaolin in Tamil Nadu is expanding at a CAGR of 4.1%, driven by ceramic tile and sanitary ware manufacturing consuming hydrous kaolin for body and glaze applications, rubber and cable industries requiring kaolin as a functional filler providing reinforcement and electrical insulation properties, and port infrastructure enabling kaolin import for specialty applications and export of ceramic products to international destinations. The state's industrial ecosystem is integrating kaolin materials across traditional ceramic applications and diversified industrial consumption including rubber, cable, and specialty manufacturing segments. Material suppliers are developing integrated supply capabilities serving Tamil Nadu's diverse consumption requirements.
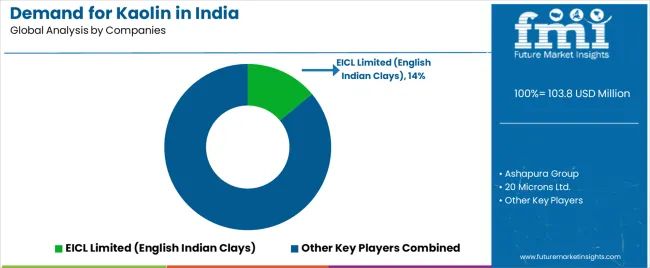
India kaolin demand is defined by competition among domestic mining and processing companies, international mineral producers with local operations, and regional processors serving specific industrial clusters, with Indian companies maintaining dominant positions through mining access, processing infrastructure, and established customer relationships. Processors are investing in beneficiation technologies including washing and magnetic separation systems, calcination facilities for specialty grade production, quality assurance laboratories, and logistics infrastructure to deliver consistent-quality, application-optimized, and competitively-priced kaolin materials across ceramic, paint, paper, and industrial operations. Strategic relationships with major ceramic manufacturers, technical support capabilities, and regional processing advantages are central to strengthening competitive positions and customer retention across Gujarat, West Bengal, and other key production and consumption regions.
EICL Limited (English Indian Clays), India-based and the sector leader with 14% share, offers comprehensive kaolin products including hydrous grades for paint and ceramic applications, calcined materials for specialty uses, and beneficiated grades for paper coating with focus on quality consistency, technical support, and reliable supply across Indian and export operations. Ashapura Group, operating from Gujarat with diversified minerals portfolio, provides kaolin materials including hydrous and calcined grades with emphasis on integrated mining and processing capabilities serving ceramic, paint, and industrial customers. 20 Microns Ltd., India-based specialty minerals processor, delivers advanced kaolin products including ultrafine hydrous grades and calcined materials, recently reporting FY25 sustainability and capacity initiatives across kaolin operations including calcination and energy-efficiency projects. Gujarat Mineral Development Corporation (GMDC), state government entity, emphasizes systematic mining and processing of kaolin resources from Gujarat deposits with focus on consistent supply and quality standardization.
Imerys India Pvt. Ltd., international minerals company with Indian operations, provides technology-leading kaolin products including specialty grades and application-engineered materials, with parent company Imerys recently announcing ~£18 million investment to upgrade dry-mining for china clay (kaolin) in Cornwall (May 2025) and H1-2025 update highlighting stable sales and ongoing industrial minerals investments supporting global kaolin supply. Kaolin processors are establishing comprehensive distribution networks throughout major consumption regions, developing application-specific grades addressing ceramic tile, architectural paint, and paper coating requirements, and integrating quality control technologies including particle size analysis, brightness measurement, and chemical composition testing to meet evolving ceramic manufacturer specifications, paint formulator requirements, and paper industry standards across Gujarat, Maharashtra, West Bengal, and broader Indian kaolin operations.
| Item | Value |
|---|---|
| Quantitative Units | USD 159.7 million |
| Product Type | Hydrous, calcined, delaminated, crude, surface-modified, levigated |
| End Use | Ceramics & sanitary, paints & coatings, paper & glass, cement, pesticide & refractory, others |
| Region | West India, South India, North India, East India |
| Processing | Washed/beneficiated, unwashed/direct-shipped, calcined value-added grades |
| States Covered | Gujarat, Maharashtra, West Bengal, Karnataka, Rajasthan, Delhi (NCR), Tamil Nadu |
| Key Companies Profiled | EICL Limited (English Indian Clays), Ashapura Group, 20 Microns Ltd., Gujarat Mineral Development Corporation (GMDC), Imerys India Pvt. Ltd., Sibelco India, JLD Minerals, Shree Ram Minerals, Kaolin Techniques Pvt. Ltd., Kerala Ceramics Ltd. |
| Additional Attributes | Dollar sales by product type, end-use application, and processing method, regional demand trends across West India, South India, North India, and East India, competitive landscape with established domestic mining and processing companies and international mineral producers, industrial customer preferences for hydrous versus calcined kaolin materials, integration with ceramic manufacturing clusters particularly concentrated in Gujarat's Morbi district, innovations in beneficiation technologies and specialty grade development including surface modification and nano-kaolin, and adoption of advanced washing systems, calcination facilities, and quality control capabilities for enhanced material specifications and application performance across Gujarat, West Bengal, Rajasthan, and broader Indian kaolin production and consumption operations |
The global demand for kaolin in india is estimated to be valued at USD 103.8 million in 2025.
The market size for the demand for kaolin in india is projected to reach USD 159.7 million by 2035.
The demand for kaolin in india is expected to grow at a 4.4% CAGR between 2025 and 2035.
The key product types in demand for kaolin in india are hydrous, calcined, delaminated, crude, surface-modified and levigated.
In terms of end use, ceramics & sanitary segment to command 40.0% share in the demand for kaolin in india in 2025.
Explore Similar Insights

Thank you!
You will receive an email from our Business Development Manager. Please be sure to check your SPAM/JUNK folder too.
Chat With
MaRIA