The Demand and Trend Analysis of Gaming Monitor in Japan is estimated to be valued at USD 323.2 million in 2025 and is projected to reach USD 666.2 million by 2035, registering a compound annual growth rate (CAGR) of 7.5% over the forecast period.
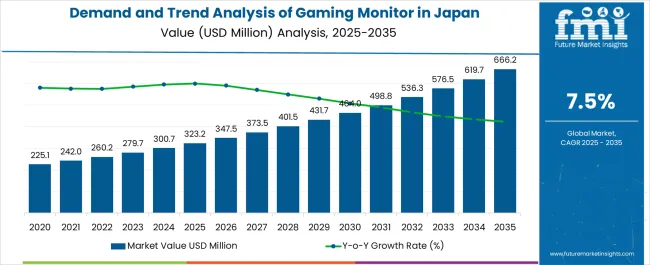
| Metric | Value |
|---|---|
| Demand and Trend Analysis of Gaming Monitor in Japan Estimated Value in (2025 E) | USD 323.2 million |
| Demand and Trend Analysis of Gaming Monitor in Japan Forecast Value in (2035 F) | USD 666.2 million |
| Forecast CAGR (2025 to 2035) | 7.5% |
The gaming monitor market in Japan is experiencing robust growth. Rising popularity of high-performance gaming, coupled with increasing adoption of advanced visual technologies, is driving strong consumer demand. Current market dynamics are defined by rapid product innovation, including higher refresh rates, enhanced resolution, and adaptive sync features that cater to competitive and immersive gaming needs.
Growth is further supported by rising disposable incomes, expansion of e-sports, and increasing demand for premium home entertainment systems. The market is being influenced by consumer preference for quality display experiences and willingness to invest in specialized equipment. Manufacturers are focusing on product differentiation through design, energy efficiency, and integration of cutting-edge display technologies.
The future outlook indicates sustained demand, particularly as gaming ecosystems expand and cloud gaming services gain traction Growth rationale is anchored in the alignment of technological innovation, consumer lifestyle trends, and strategic distribution, ensuring consistent expansion of the gaming monitor market in Japan.
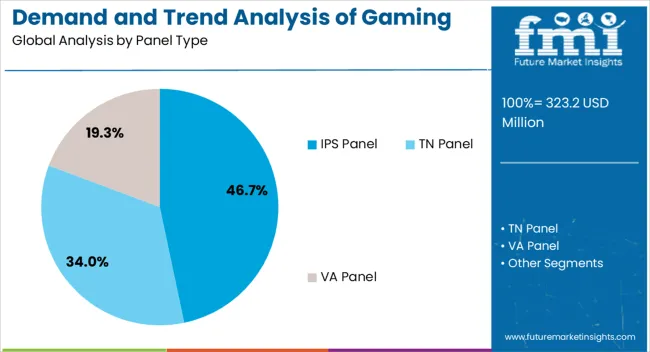
The IPS panel segment, representing 46.70% of the panel type category, is leading due to its superior color accuracy, wide viewing angles, and overall visual performance. Its preference has been reinforced by professional and casual gamers seeking immersive and consistent display quality.
Manufacturers are advancing IPS technology with higher refresh rates and improved response times, mitigating earlier limitations and making it more competitive with other panel types. Demand has been supported by e-sports growth and increasing integration of IPS monitors in high-end gaming setups.
Retail strategies highlighting premium visual quality have enhanced consumer adoption, while continued product innovation and competitive pricing are expected to sustain the IPS segment’s market share.
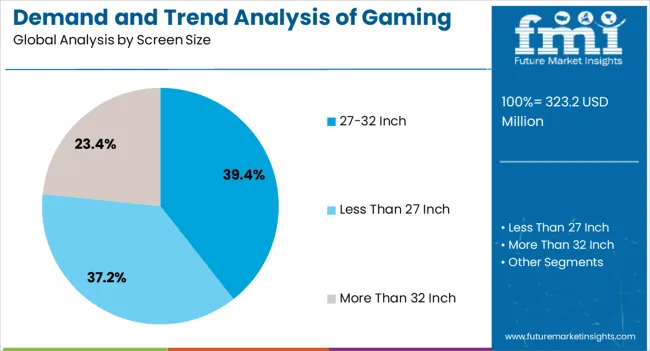
The 27-32 inch screen size segment, holding 39.40% of the screen size category, has become the most preferred option due to its balance between immersive gameplay and desk space efficiency. This size range provides optimal resolution support for QHD and 4K displays, which are increasingly popular among Japanese gamers.
Adoption has been driven by compatibility with multi-monitor setups and its suitability for both casual and professional gaming environments. Consumer trends toward cinematic and highly detailed gaming experiences have reinforced demand.
Enhanced affordability and availability across online and offline channels have widened accessibility, ensuring the segment’s sustained leadership in the market.
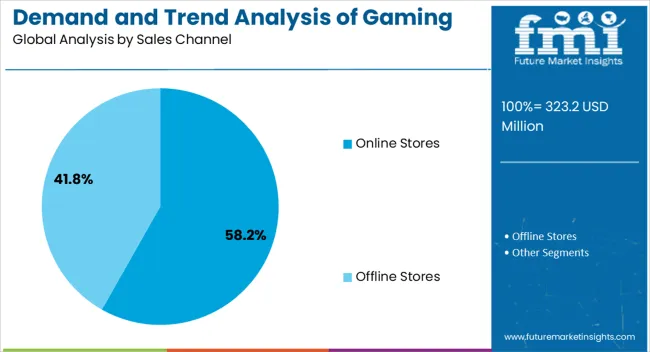
The online stores segment, accounting for 58.20% of the sales channel category, dominates distribution due to the convenience, product variety, and competitive pricing offered through e-commerce platforms. Japanese consumers are increasingly leveraging online retail for access to the latest models, bundled offers, and detailed product information.
Strong logistics networks and reliable delivery services have further reinforced consumer confidence in online purchasing. Seasonal promotions, discounts, and direct-to-consumer strategies from manufacturers are contributing to sales growth.
With rising digital adoption and preference for hassle-free shopping experiences, online channels are expected to maintain dominance and expand further as a primary sales avenue for gaming monitors in Japan.
Rise of eSports to Elevate Gaming Monitor Industry in Japan
E-sports has become a cultural phenomenon in Japan, attracting millions of young Japanese gamers and content creators from various disciplines.
Professional gamers require high-end technological gear for gaming, including monitors with high refresh rates, low response times, and minimal input lag to ensure a seamless and responsive gaming experience.
These features are crucial for maintaining a competitive edge, as even the slightest delay or visual distortion can impact gameplay and reaction times.
Gaming monitors with vibrant colors and wide color gamut enable players to distinguish subtle details, enhancing their ability to strategize and make split-second decisions. As e-sports continues to grow in popularity and gain mainstream recognition in Japan, the demand for high-performance gaming monitors is expected to rise further.
Based on sales channels, online stores dominate the gaming monitors industry in Japan with a significant share of 62.8% in 2025.
| Attributes | Details |
|---|---|
| Sales Channel | Online Stores |
| Value share in 2025 | 62.8% |
Online sales of gaming monitors are more common in Japan compared to their offline counterparts, owing to the convenience and the wide array of browsing options available on various online platforms.
These platforms offer a diverse range of gaming monitor choices, enabling consumers to compare prices, read reviews, and make well-informed decisions. This convenience, combined with the option to have the product delivered directly to their doorstep, makes online sales the preferred choice for many gamers in Japan.
Online spaces offer a broader selection of gaming monitors than physical retail stores. Physical stores may have limited shelf space and may not carry the latest models or various brands.
VA panel gaming monitors dominate the Japan gaming monitors industry with a significant share of 54.8% in 2025.
| Attributes | Details |
|---|---|
| Panel Type | VA Panel |
| Value share in 2025 | 54.8% |
As the popularity of survival horror games such as Resident Evil, Outlast, and others surges in Japan, there is a considerable rise in demand for Vertical Alignment Panel gaming monitors.
These monitors offer high contrast and deep blacks, enhancing the gaming experience. Compared to TN and IPS panel displays, VA monitors make dark and shadowy areas in the game look more realistic and immersive
VA panels also offer faster response times compared to their other counterparts. In addition, they are relatively affordable and more durable, giving them a competitive edge over different types of displays.
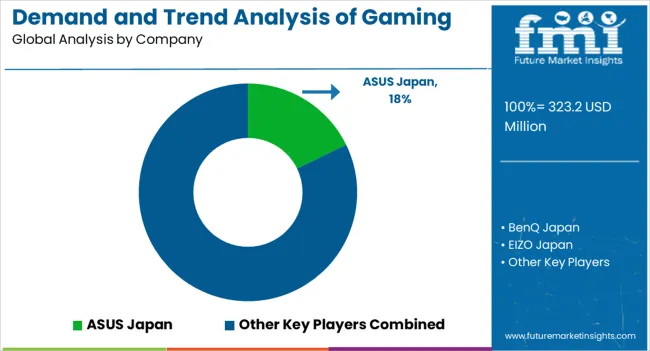
The gaming monitors industry has undoubtedly opened new doors for gaming companies to venture into the vast array of innovations in display setups. Key players in the industry have heavily invested in the technological development of new displays that offer not only vibrant colors but are also durable and rugged.
These companies in Japan face severe competition from international brands from across the globe. Small enterprises also significantly contribute to this industry by developing more basic display units to cater to casual gamers and cost-sensitive consumers. Hence, the gaming monitor landscape in Japan is healthy and open to innovations and breakthroughs.
Recent Developments in the Gaming Monitor Industry in Japan
| Attribute | Details |
|---|---|
| Estimated Valuation (2025) | USD 323.2 million |
| Projected Valuation (2035) | USD 666.2 million |
| Anticipated CAGR (2025 to 2035) | 7.5% CAGR |
| Historical Analysis of Demand for Gaming Monitors in Japan | 2020 to 2025 |
| Demand Forecast for Gaming Monitors in Japan | 2025 to 2035 |
| Quantitative Units | Revenue in USD million and CAGR from 2025 to 2035 |
| Report Coverage | Revenue Forecast, Company Ranking, Competitive Landscape, Growth Factors, Trends and Pricing Analysis |
| Key Cities Analyzed While Studying Opportunities in Gaming Monitors in Japan | Kanto, Chubu, Kinki, Kyushu & Okinawa, Tohoku, Rest of Japan |
| Key Companies Profiled | ASUS Japan; BenQ Japan; EIZO Japan; Green House Gaming; MSI Japan; iiyama; NEC Display Solutions; ViewSonic Japan; Acer Japan; Gigabyte Japan; Buffalo; Elecom |
The global demand and trend analysis of gaming monitor in japan is estimated to be valued at USD 323.2 million in 2025.
The market size for the demand and trend analysis of gaming monitor in japan is projected to reach USD 666.2 million by 2035.
The demand and trend analysis of gaming monitor in japan is expected to grow at a 7.5% CAGR between 2025 and 2035.
The key product types in demand and trend analysis of gaming monitor in japan are ips panel, tn panel and va panel.
In terms of screen size, 27-32 inch segment to command 39.4% share in the demand and trend analysis of gaming monitor in japan in 2025.


Our Research Products

The "Full Research Suite" delivers actionable market intel, deep dives on markets or technologies, so clients act faster, cut risk, and unlock growth.

The Leaderboard benchmarks and ranks top vendors, classifying them as Established Leaders, Leading Challengers, or Disruptors & Challengers.

Locates where complements amplify value and substitutes erode it, forecasting net impact by horizon

We deliver granular, decision-grade intel: market sizing, 5-year forecasts, pricing, adoption, usage, revenue, and operational KPIs—plus competitor tracking, regulation, and value chains—across 60 countries broadly.

Spot the shifts before they hit your P&L. We track inflection points, adoption curves, pricing moves, and ecosystem plays to show where demand is heading, why it is changing, and what to do next across high-growth markets and disruptive tech

Real-time reads of user behavior. We track shifting priorities, perceptions of today’s and next-gen services, and provider experience, then pace how fast tech moves from trial to adoption, blending buyer, consumer, and channel inputs with social signals (#WhySwitch, #UX).

Partner with our analyst team to build a custom report designed around your business priorities. From analysing market trends to assessing competitors or crafting bespoke datasets, we tailor insights to your needs.
Supplier Intelligence
Discovery & Profiling
Capacity & Footprint
Performance & Risk
Compliance & Governance
Commercial Readiness
Who Supplies Whom
Scorecards & Shortlists
Playbooks & Docs
Category Intelligence
Definition & Scope
Demand & Use Cases
Cost Drivers
Market Structure
Supply Chain Map
Trade & Policy
Operating Norms
Deliverables
Buyer Intelligence
Account Basics
Spend & Scope
Procurement Model
Vendor Requirements
Terms & Policies
Entry Strategy
Pain Points & Triggers
Outputs
Pricing Analysis
Benchmarks
Trends
Should-Cost
Indexation
Landed Cost
Commercial Terms
Deliverables
Brand Analysis
Positioning & Value Prop
Share & Presence
Customer Evidence
Go-to-Market
Digital & Reputation
Compliance & Trust
KPIs & Gaps
Outputs
Full Research Suite comprises of:
Market outlook & trends analysis
Interviews & case studies
Strategic recommendations
Vendor profiles & capabilities analysis
5-year forecasts
8 regions and 60+ country-level data splits
Market segment data splits
12 months of continuous data updates
DELIVERED AS:
PDF EXCEL ONLINE
Gaming Monitors Market Analysis - Size, Share & Forecast 2025 to 2035
Demand for OTC Glucose Monitors in Japan Size and Share Forecast Outlook 2025 to 2035
Demand and Trend Analysis of Gaming Monitor in Western Europe Size and Share Forecast Outlook 2025 to 2035
Demand and Trend Analysis of Gaming Monitor in Korea Size and Share Forecast Outlook 2025 to 2035
Demand for Neuromuscular Transmission Monitor in Japan Size and Share Forecast Outlook 2025 to 2035
Japan Faith-based Tourism Market Size and Share Forecast Outlook 2025 to 2035
Japan Sports Tourism Market Size and Share Forecast Outlook 2025 to 2035
Monitoring Tool Market Size and Share Forecast Outlook 2025 to 2035
Japan Respiratory Inhaler Devices Market Size and Share Forecast Outlook 2025 to 2035
Japan Halal Tourism Market Size and Share Forecast Outlook 2025 to 2035
Gaming Simulators Market Size and Share Forecast Outlook 2025 to 2035
Japan Automated People Mover Industry Size and Share Forecast Outlook 2025 to 2035
Japan Automotive Load Floor Industry Analysis Size and Share Forecast Outlook 2025 to 2035
Gaming Laptop Market Size and Share Forecast Outlook 2025 to 2035
Japan Food Cling Film Market Size and Share Forecast Outlook 2025 to 2035
Japan Polypropylene Packaging Films Market Size and Share Forecast Outlook 2025 to 2035
Gaming Console Market Size and Share Forecast Outlook 2025 to 2035
Gaming Gadgets Market Size and Share Forecast Outlook 2025 to 2035
Japan Probiotic Yogurt Market is segmented by product type, source type, nature type, flavor type, fat content, sales channel and key city/province through 2025 to 2035.
japan Tortilla Market - Growth, Trends and Forecast from 2025 to 2035

Thank you!
You will receive an email from our Business Development Manager. Please be sure to check your SPAM/JUNK folder too.
Chat With
MaRIA