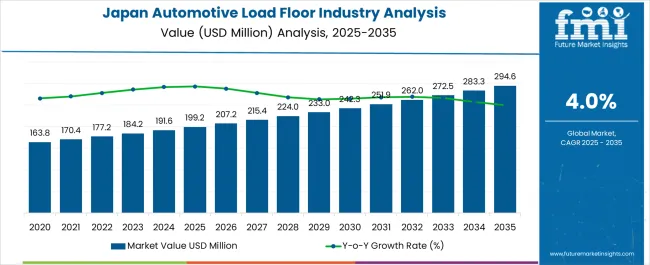
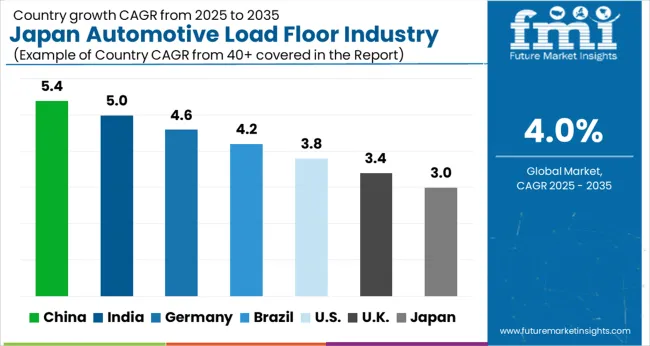
In Japan, the automotive load floor ecosystem is forecast exhibit a CAGR of 4.20% through 2034. The automotive load floor industry in Japan is poised to reach a valuation of USD 191.2 million in 2024.
Manufacturers are constantly innovating load floor designs to differentiate their offerings. Unique features like hidden storage compartments, customizable layouts, and cargo organization systems are becoming more common in Japan. By 2034, the automotive load floor industry in Japan will likely secure USD 288.51 million.
Key Insights and Highlights to Understand Emerging and Fast-growing Opportunities
Attributes | Details |
---|---|
Expected Value in 2024 | USD 191.2 million |
Projected Value in 2034 | USD 288.51 million |
CAGR Estimation from 2024 to 2034 | 4.20% |
Automotive manufacturers in this region often integrate advanced technology into load floors, such as intelligent storage solutions, sensors, and connectivity options, catering to tech-savvy consumers. The high volume of e-commerce and delivery services in Kanto drives the industry demand.
Load floors in vans and smaller vehicles are optimized to handle various cargo types, catering to the growing demand for efficient last-mile delivery solutions. With increased environmental consciousness in Kanto, the demand for eco-friendly materials load floor has expanded.
The prominence of automotive production in Chubu contributes to the growth of various automotive components, including load floors. Chubu hosts several major automotive companies and manufacturing facilities. This region is pivotal in developing and producing automobiles, including designing and implementing innovative load floors.
The demand for load floors with adaptability and customization options, such as configurable layouts, adjustable cargo spaces, and modular designs, has increased in the region owing to the demand for compact vehicles. The rise of e-commerce and the growing demand for efficient delivery services drive the demand for the automotive load floor in Chubu.
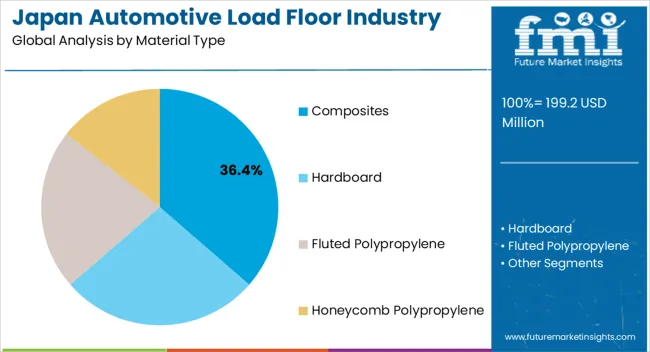
Based on the material, the automotive load floor in Japan is likely to be dominated by the composites segment, with a share of 31.9%. Despite being lightweight, composite materials can be solid and durable. This strength allows load floors to support heavy cargo without compromising structural integrity. Lightweight load floor contributes to improved fuel efficiency and overall vehicle performance.
Composite materials offer a high degree of design flexibility. Manufacturers can mold and shape composite materials to fit specific load floor designs, allowing for innovative and space-efficient solutions in vehicles with limited cargo space.
The demand for composite materials in automotive load floors aligns with the industry's pursuit of lightweight, durable, and versatile solutions that optimize space while meeting stringent performance and safety standards.
Attribute | Details |
---|---|
Material | Composites |
Value Share | 31.9% |
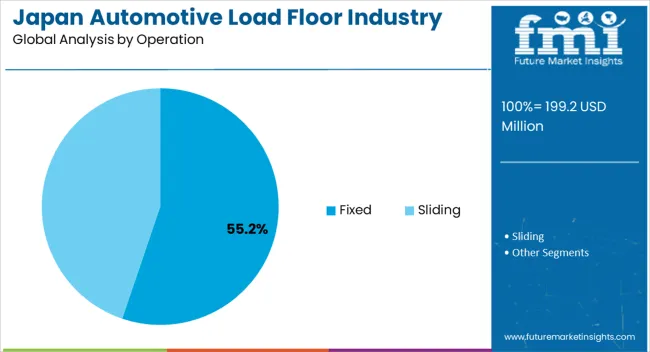
Based on operations, the automotive load floor in Japan is likely to be dominated by the fixed segment, with a share of 79.1%. Fixed-load floors are often designed to withstand repeated use and heavy loads, contributing to their durability and longevity. This reduces maintenance requirements and enhances the overall lifespan of the vehicle's cargo area.
Manufacturers can incorporate foldable or adjustable sections within the fixed load floor, providing a balance between stability and adaptability. Fixed load floors offer increased safety by minimizing the risk of cargo movement or shifting, reducing the potential for accidents or damage to the vehicle or its occupants. This is particularly important for ensuring passenger safety during sudden stops or maneuvers.
Attribute | Details |
---|---|
Operations | Fixed |
Value Share | 79.1% |
Acquisitions and mergers are the default expansion strategies of players operating on the automotive load floor in Japan. Key manufacturers of automotive load floors in Japan focus on facility expansions, product innovations, and promotional activities to increase sales and gain a competitive edge.
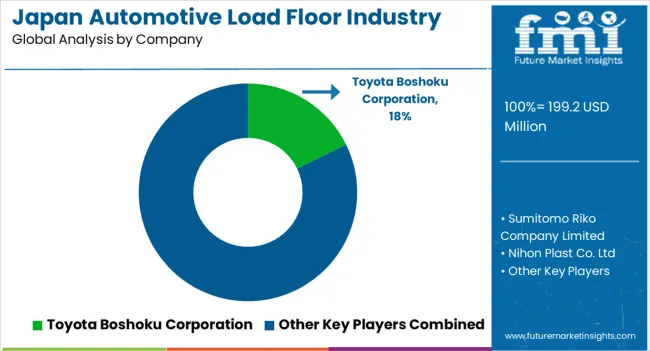
Key Developments in the Automotive Load Floor Landscape in Japan
Attribute | Details |
---|---|
Estimated Industry Size in 2024 | USD 191.2 million |
Projected Industry Size in 2034 | USD 288.51 million |
Anticipated CAGR between 2024 to 2034 | 4.20% CAGR |
Historical Analysis of Automotive Load Floor in Japan | 2019 to 2023 |
Forecast for Deployment of Automotive Load Floor in Japan | 2024 to 2034 |
Report Coverage | Industry Size, Industry Trends, Analysis of key factors influencing Deployment of Automotive Load Floor in Japan, Insights on Global Players and their Industry Strategy in Japan, Ecosystem Analysis of Local Providers in Japan. |
Key Region Analyzed While Studying Opportunities in the Automotive Load Floor in Japan | Kanto Region, Chubu Region, Kinki (Kansai), Kyushu and Okinawa, Tohoku |
Key Companies Profiled | Toyota Boshoku Corporation; Sumitomo Riko Company Limited; Nihon Plast Co., Ltd; Mitsubishi Electric Corporation; Denso Corporation; Gemini Group, Inc.; SA Automotive; UFP Technologies, Inc.; Huntsman International LLC; Grudem; Conform Automotive |
Table 1: Industry Analysis and Outlook Value (US$ Million) Forecast by Region, 2019 to 2034
Table 2: Industry Analysis and Outlook Volume (Unit) Forecast by Region, 2019 to 2034
Table 3: Industry Analysis and Outlook Value (US$ Million) Forecast by Material Type, 2019 to 2034
Table 4: Industry Analysis and Outlook Volume (Unit) Forecast by Material Type, 2019 to 2034
Table 5: Industry Analysis and Outlook Value (US$ Million) Forecast by Application, 2019 to 2034
Table 6: Industry Analysis and Outlook Volume (Unit) Forecast by Application, 2019 to 2034
Table 7: Industry Analysis and Outlook Value (US$ Million) Forecast by Operation, 2019 to 2034
Table 8: Industry Analysis and Outlook Volume (Unit) Forecast by Operation, 2019 to 2034
Table 9: Industry Analysis and Outlook Value (US$ Million) Forecast by Vehicle Type, 2019 to 2034
Table 10: Industry Analysis and Outlook Volume (Unit) Forecast by Vehicle Type, 2019 to 2034
Table 11: Kanto Industry Analysis and Outlook Value (US$ Million) Forecast by Material Type, 2019 to 2034
Table 12: Kanto Industry Analysis and Outlook Volume (Unit) Forecast by Material Type, 2019 to 2034
Table 13: Kanto Industry Analysis and Outlook Value (US$ Million) Forecast by Application, 2019 to 2034
Table 14: Kanto Industry Analysis and Outlook Volume (Unit) Forecast by Application, 2019 to 2034
Table 15: Kanto Industry Analysis and Outlook Value (US$ Million) Forecast by Operation, 2019 to 2034
Table 16: Kanto Industry Analysis and Outlook Volume (Unit) Forecast by Operation, 2019 to 2034
Table 17: Kanto Industry Analysis and Outlook Value (US$ Million) Forecast by Vehicle Type, 2019 to 2034
Table 18: Kanto Industry Analysis and Outlook Volume (Unit) Forecast by Vehicle Type, 2019 to 2034
Table 19: Chubu Industry Analysis and Outlook Value (US$ Million) Forecast by Material Type, 2019 to 2034
Table 20: Chubu Industry Analysis and Outlook Volume (Unit) Forecast by Material Type, 2019 to 2034
Table 21: Chubu Industry Analysis and Outlook Value (US$ Million) Forecast by Application, 2019 to 2034
Table 22: Chubu Industry Analysis and Outlook Volume (Unit) Forecast by Application, 2019 to 2034
Table 23: Chubu Industry Analysis and Outlook Value (US$ Million) Forecast by Operation, 2019 to 2034
Table 24: Chubu Industry Analysis and Outlook Volume (Unit) Forecast by Operation, 2019 to 2034
Table 25: Chubu Industry Analysis and Outlook Value (US$ Million) Forecast by Vehicle Type, 2019 to 2034
Table 26: Chubu Industry Analysis and Outlook Volume (Unit) Forecast by Vehicle Type, 2019 to 2034
Table 27: Kinki Industry Analysis and Outlook Value (US$ Million) Forecast by Material Type, 2019 to 2034
Table 28: Kinki Industry Analysis and Outlook Volume (Unit) Forecast by Material Type, 2019 to 2034
Table 29: Kinki Industry Analysis and Outlook Value (US$ Million) Forecast by Application, 2019 to 2034
Table 30: Kinki Industry Analysis and Outlook Volume (Unit) Forecast by Application, 2019 to 2034
Table 31: Kinki Industry Analysis and Outlook Value (US$ Million) Forecast by Operation, 2019 to 2034
Table 32: Kinki Industry Analysis and Outlook Volume (Unit) Forecast by Operation, 2019 to 2034
Table 33: Kinki Industry Analysis and Outlook Value (US$ Million) Forecast by Vehicle Type, 2019 to 2034
Table 34: Kinki Industry Analysis and Outlook Volume (Unit) Forecast by Vehicle Type, 2019 to 2034
Table 35: Kyushu & Okinawa Industry Analysis and Outlook Value (US$ Million) Forecast by Material Type, 2019 to 2034
Table 36: Kyushu & Okinawa Industry Analysis and Outlook Volume (Unit) Forecast by Material Type, 2019 to 2034
Table 37: Kyushu & Okinawa Industry Analysis and Outlook Value (US$ Million) Forecast by Application, 2019 to 2034
Table 38: Kyushu & Okinawa Industry Analysis and Outlook Volume (Unit) Forecast by Application, 2019 to 2034
Table 39: Kyushu & Okinawa Industry Analysis and Outlook Value (US$ Million) Forecast by Operation, 2019 to 2034
Table 40: Kyushu & Okinawa Industry Analysis and Outlook Volume (Unit) Forecast by Operation, 2019 to 2034
Table 41: Kyushu & Okinawa Industry Analysis and Outlook Value (US$ Million) Forecast by Vehicle Type, 2019 to 2034
Table 42: Kyushu & Okinawa Industry Analysis and Outlook Volume (Unit) Forecast by Vehicle Type, 2019 to 2034
Table 43: Tohoku Industry Analysis and Outlook Value (US$ Million) Forecast by Material Type, 2019 to 2034
Table 44: Tohoku Industry Analysis and Outlook Volume (Unit) Forecast by Material Type, 2019 to 2034
Table 45: Tohoku Industry Analysis and Outlook Value (US$ Million) Forecast by Application, 2019 to 2034
Table 46: Tohoku Industry Analysis and Outlook Volume (Unit) Forecast by Application, 2019 to 2034
Table 47: Tohoku Industry Analysis and Outlook Value (US$ Million) Forecast by Operation, 2019 to 2034
Table 48: Tohoku Industry Analysis and Outlook Volume (Unit) Forecast by Operation, 2019 to 2034
Table 49: Tohoku Industry Analysis and Outlook Value (US$ Million) Forecast by Vehicle Type, 2019 to 2034
Table 50: Tohoku Industry Analysis and Outlook Volume (Unit) Forecast by Vehicle Type, 2019 to 2034
Figure 1: Industry Analysis and Outlook Value (US$ Million) by Material Type, 2024 to 2034
Figure 2: Industry Analysis and Outlook Value (US$ Million) by Application, 2024 to 2034
Figure 3: Industry Analysis and Outlook Value (US$ Million) by Operation, 2024 to 2034
Figure 4: Industry Analysis and Outlook Value (US$ Million) by Vehicle Type, 2024 to 2034
Figure 5: Industry Analysis and Outlook Value (US$ Million) by Region, 2024 to 2034
Figure 6: Industry Analysis and Outlook Value (US$ Million) Analysis by Region, 2019 to 2034
Figure 7: Industry Analysis and Outlook Volume (Unit) Analysis by Region, 2019 to 2034
Figure 8: Industry Analysis and Outlook Value Share (%) and BPS Analysis by Region, 2024 to 2034
Figure 9: Industry Analysis and Outlook Y-o-Y Growth (%) Projections by Region, 2024 to 2034
Figure 10: Industry Analysis and Outlook Value (US$ Million) Analysis by Material Type, 2019 to 2034
Figure 11: Industry Analysis and Outlook Volume (Unit) Analysis by Material Type, 2019 to 2034
Figure 12: Industry Analysis and Outlook Value Share (%) and BPS Analysis by Material Type, 2024 to 2034
Figure 13: Industry Analysis and Outlook Y-o-Y Growth (%) Projections by Material Type, 2024 to 2034
Figure 14: Industry Analysis and Outlook Value (US$ Million) Analysis by Application, 2019 to 2034
Figure 15: Industry Analysis and Outlook Volume (Unit) Analysis by Application, 2019 to 2034
Figure 16: Industry Analysis and Outlook Value Share (%) and BPS Analysis by Application, 2024 to 2034
Figure 17: Industry Analysis and Outlook Y-o-Y Growth (%) Projections by Application, 2024 to 2034
Figure 18: Industry Analysis and Outlook Value (US$ Million) Analysis by Operation, 2019 to 2034
Figure 19: Industry Analysis and Outlook Volume (Unit) Analysis by Operation, 2019 to 2034
Figure 20: Industry Analysis and Outlook Value Share (%) and BPS Analysis by Operation, 2024 to 2034
Figure 21: Industry Analysis and Outlook Y-o-Y Growth (%) Projections by Operation, 2024 to 2034
Figure 22: Industry Analysis and Outlook Value (US$ Million) Analysis by Vehicle Type, 2019 to 2034
Figure 23: Industry Analysis and Outlook Volume (Unit) Analysis by Vehicle Type, 2019 to 2034
Figure 24: Industry Analysis and Outlook Value Share (%) and BPS Analysis by Vehicle Type, 2024 to 2034
Figure 25: Industry Analysis and Outlook Y-o-Y Growth (%) Projections by Vehicle Type, 2024 to 2034
Figure 26: Industry Analysis and Outlook Attractiveness by Material Type, 2024 to 2034
Figure 27: Industry Analysis and Outlook Attractiveness by Application, 2024 to 2034
Figure 28: Industry Analysis and Outlook Attractiveness by Operation, 2024 to 2034
Figure 29: Industry Analysis and Outlook Attractiveness by Vehicle Type, 2024 to 2034
Figure 30: Industry Analysis and Outlook Attractiveness by Region, 2024 to 2034
Figure 31: Kanto Industry Analysis and Outlook Value (US$ Million) by Material Type, 2024 to 2034
Figure 32: Kanto Industry Analysis and Outlook Value (US$ Million) by Application, 2024 to 2034
Figure 33: Kanto Industry Analysis and Outlook Value (US$ Million) by Operation, 2024 to 2034
Figure 34: Kanto Industry Analysis and Outlook Value (US$ Million) by Vehicle Type, 2024 to 2034
Figure 35: Kanto Industry Analysis and Outlook Value (US$ Million) Analysis by Material Type, 2019 to 2034
Figure 36: Kanto Industry Analysis and Outlook Volume (Unit) Analysis by Material Type, 2019 to 2034
Figure 37: Kanto Industry Analysis and Outlook Value Share (%) and BPS Analysis by Material Type, 2024 to 2034
Figure 38: Kanto Industry Analysis and Outlook Y-o-Y Growth (%) Projections by Material Type, 2024 to 2034
Figure 39: Kanto Industry Analysis and Outlook Value (US$ Million) Analysis by Application, 2019 to 2034
Figure 40: Kanto Industry Analysis and Outlook Volume (Unit) Analysis by Application, 2019 to 2034
Figure 41: Kanto Industry Analysis and Outlook Value Share (%) and BPS Analysis by Application, 2024 to 2034
Figure 42: Kanto Industry Analysis and Outlook Y-o-Y Growth (%) Projections by Application, 2024 to 2034
Figure 43: Kanto Industry Analysis and Outlook Value (US$ Million) Analysis by Operation, 2019 to 2034
Figure 44: Kanto Industry Analysis and Outlook Volume (Unit) Analysis by Operation, 2019 to 2034
Figure 45: Kanto Industry Analysis and Outlook Value Share (%) and BPS Analysis by Operation, 2024 to 2034
Figure 46: Kanto Industry Analysis and Outlook Y-o-Y Growth (%) Projections by Operation, 2024 to 2034
Figure 47: Kanto Industry Analysis and Outlook Value (US$ Million) Analysis by Vehicle Type, 2019 to 2034
Figure 48: Kanto Industry Analysis and Outlook Volume (Unit) Analysis by Vehicle Type, 2019 to 2034
Figure 49: Kanto Industry Analysis and Outlook Value Share (%) and BPS Analysis by Vehicle Type, 2024 to 2034
Figure 50: Kanto Industry Analysis and Outlook Y-o-Y Growth (%) Projections by Vehicle Type, 2024 to 2034
Figure 51: Kanto Industry Analysis and Outlook Attractiveness by Material Type, 2024 to 2034
Figure 52: Kanto Industry Analysis and Outlook Attractiveness by Application, 2024 to 2034
Figure 53: Kanto Industry Analysis and Outlook Attractiveness by Operation, 2024 to 2034
Figure 54: Kanto Industry Analysis and Outlook Attractiveness by Vehicle Type, 2024 to 2034
Figure 55: Chubu Industry Analysis and Outlook Value (US$ Million) by Material Type, 2024 to 2034
Figure 56: Chubu Industry Analysis and Outlook Value (US$ Million) by Application, 2024 to 2034
Figure 57: Chubu Industry Analysis and Outlook Value (US$ Million) by Operation, 2024 to 2034
Figure 58: Chubu Industry Analysis and Outlook Value (US$ Million) by Vehicle Type, 2024 to 2034
Figure 59: Chubu Industry Analysis and Outlook Value (US$ Million) Analysis by Material Type, 2019 to 2034
Figure 60: Chubu Industry Analysis and Outlook Volume (Unit) Analysis by Material Type, 2019 to 2034
Figure 61: Chubu Industry Analysis and Outlook Value Share (%) and BPS Analysis by Material Type, 2024 to 2034
Figure 62: Chubu Industry Analysis and Outlook Y-o-Y Growth (%) Projections by Material Type, 2024 to 2034
Figure 63: Chubu Industry Analysis and Outlook Value (US$ Million) Analysis by Application, 2019 to 2034
Figure 64: Chubu Industry Analysis and Outlook Volume (Unit) Analysis by Application, 2019 to 2034
Figure 65: Chubu Industry Analysis and Outlook Value Share (%) and BPS Analysis by Application, 2024 to 2034
Figure 66: Chubu Industry Analysis and Outlook Y-o-Y Growth (%) Projections by Application, 2024 to 2034
Figure 67: Chubu Industry Analysis and Outlook Value (US$ Million) Analysis by Operation, 2019 to 2034
Figure 68: Chubu Industry Analysis and Outlook Volume (Unit) Analysis by Operation, 2019 to 2034
Figure 69: Chubu Industry Analysis and Outlook Value Share (%) and BPS Analysis by Operation, 2024 to 2034
Figure 70: Chubu Industry Analysis and Outlook Y-o-Y Growth (%) Projections by Operation, 2024 to 2034
Figure 71: Chubu Industry Analysis and Outlook Value (US$ Million) Analysis by Vehicle Type, 2019 to 2034
Figure 72: Chubu Industry Analysis and Outlook Volume (Unit) Analysis by Vehicle Type, 2019 to 2034
Figure 73: Chubu Industry Analysis and Outlook Value Share (%) and BPS Analysis by Vehicle Type, 2024 to 2034
Figure 74: Chubu Industry Analysis and Outlook Y-o-Y Growth (%) Projections by Vehicle Type, 2024 to 2034
Figure 75: Chubu Industry Analysis and Outlook Attractiveness by Material Type, 2024 to 2034
Figure 76: Chubu Industry Analysis and Outlook Attractiveness by Application, 2024 to 2034
Figure 77: Chubu Industry Analysis and Outlook Attractiveness by Operation, 2024 to 2034
Figure 78: Chubu Industry Analysis and Outlook Attractiveness by Vehicle Type, 2024 to 2034
Figure 79: Kinki Industry Analysis and Outlook Value (US$ Million) by Material Type, 2024 to 2034
Figure 80: Kinki Industry Analysis and Outlook Value (US$ Million) by Application, 2024 to 2034
Figure 81: Kinki Industry Analysis and Outlook Value (US$ Million) by Operation, 2024 to 2034
Figure 82: Kinki Industry Analysis and Outlook Value (US$ Million) by Vehicle Type, 2024 to 2034
Figure 83: Kinki Industry Analysis and Outlook Value (US$ Million) Analysis by Material Type, 2019 to 2034
Figure 84: Kinki Industry Analysis and Outlook Volume (Unit) Analysis by Material Type, 2019 to 2034
Figure 85: Kinki Industry Analysis and Outlook Value Share (%) and BPS Analysis by Material Type, 2024 to 2034
Figure 86: Kinki Industry Analysis and Outlook Y-o-Y Growth (%) Projections by Material Type, 2024 to 2034
Figure 87: Kinki Industry Analysis and Outlook Value (US$ Million) Analysis by Application, 2019 to 2034
Figure 88: Kinki Industry Analysis and Outlook Volume (Unit) Analysis by Application, 2019 to 2034
Figure 89: Kinki Industry Analysis and Outlook Value Share (%) and BPS Analysis by Application, 2024 to 2034
Figure 90: Kinki Industry Analysis and Outlook Y-o-Y Growth (%) Projections by Application, 2024 to 2034
Figure 91: Kinki Industry Analysis and Outlook Value (US$ Million) Analysis by Operation, 2019 to 2034
Figure 92: Kinki Industry Analysis and Outlook Volume (Unit) Analysis by Operation, 2019 to 2034
Figure 93: Kinki Industry Analysis and Outlook Value Share (%) and BPS Analysis by Operation, 2024 to 2034
Figure 94: Kinki Industry Analysis and Outlook Y-o-Y Growth (%) Projections by Operation, 2024 to 2034
Figure 95: Kinki Industry Analysis and Outlook Value (US$ Million) Analysis by Vehicle Type, 2019 to 2034
Figure 96: Kinki Industry Analysis and Outlook Volume (Unit) Analysis by Vehicle Type, 2019 to 2034
Figure 97: Kinki Industry Analysis and Outlook Value Share (%) and BPS Analysis by Vehicle Type, 2024 to 2034
Figure 98: Kinki Industry Analysis and Outlook Y-o-Y Growth (%) Projections by Vehicle Type, 2024 to 2034
Figure 99: Kinki Industry Analysis and Outlook Attractiveness by Material Type, 2024 to 2034
Figure 100: Kinki Industry Analysis and Outlook Attractiveness by Application, 2024 to 2034
Figure 101: Kinki Industry Analysis and Outlook Attractiveness by Operation, 2024 to 2034
Figure 102: Kinki Industry Analysis and Outlook Attractiveness by Vehicle Type, 2024 to 2034
Figure 103: Kyushu & Okinawa Industry Analysis and Outlook Value (US$ Million) by Material Type, 2024 to 2034
Figure 104: Kyushu & Okinawa Industry Analysis and Outlook Value (US$ Million) by Application, 2024 to 2034
Figure 105: Kyushu & Okinawa Industry Analysis and Outlook Value (US$ Million) by Operation, 2024 to 2034
Figure 106: Kyushu & Okinawa Industry Analysis and Outlook Value (US$ Million) by Vehicle Type, 2024 to 2034
Figure 107: Kyushu & Okinawa Industry Analysis and Outlook Value (US$ Million) Analysis by Material Type, 2019 to 2034
Figure 108: Kyushu & Okinawa Industry Analysis and Outlook Volume (Unit) Analysis by Material Type, 2019 to 2034
Figure 109: Kyushu & Okinawa Industry Analysis and Outlook Value Share (%) and BPS Analysis by Material Type, 2024 to 2034
Figure 110: Kyushu & Okinawa Industry Analysis and Outlook Y-o-Y Growth (%) Projections by Material Type, 2024 to 2034
Figure 111: Kyushu & Okinawa Industry Analysis and Outlook Value (US$ Million) Analysis by Application, 2019 to 2034
Figure 112: Kyushu & Okinawa Industry Analysis and Outlook Volume (Unit) Analysis by Application, 2019 to 2034
Figure 113: Kyushu & Okinawa Industry Analysis and Outlook Value Share (%) and BPS Analysis by Application, 2024 to 2034
Figure 114: Kyushu & Okinawa Industry Analysis and Outlook Y-o-Y Growth (%) Projections by Application, 2024 to 2034
Figure 115: Kyushu & Okinawa Industry Analysis and Outlook Value (US$ Million) Analysis by Operation, 2019 to 2034
Figure 116: Kyushu & Okinawa Industry Analysis and Outlook Volume (Unit) Analysis by Operation, 2019 to 2034
Figure 117: Kyushu & Okinawa Industry Analysis and Outlook Value Share (%) and BPS Analysis by Operation, 2024 to 2034
Figure 118: Kyushu & Okinawa Industry Analysis and Outlook Y-o-Y Growth (%) Projections by Operation, 2024 to 2034
Figure 119: Kyushu & Okinawa Industry Analysis and Outlook Value (US$ Million) Analysis by Vehicle Type, 2019 to 2034
Figure 120: Kyushu & Okinawa Industry Analysis and Outlook Volume (Unit) Analysis by Vehicle Type, 2019 to 2034
Figure 121: Kyushu & Okinawa Industry Analysis and Outlook Value Share (%) and BPS Analysis by Vehicle Type, 2024 to 2034
Figure 122: Kyushu & Okinawa Industry Analysis and Outlook Y-o-Y Growth (%) Projections by Vehicle Type, 2024 to 2034
Figure 123: Kyushu & Okinawa Industry Analysis and Outlook Attractiveness by Material Type, 2024 to 2034
Figure 124: Kyushu & Okinawa Industry Analysis and Outlook Attractiveness by Application, 2024 to 2034
Figure 125: Kyushu & Okinawa Industry Analysis and Outlook Attractiveness by Operation, 2024 to 2034
Figure 126: Kyushu & Okinawa Industry Analysis and Outlook Attractiveness by Vehicle Type, 2024 to 2034
Figure 127: Tohoku Industry Analysis and Outlook Value (US$ Million) by Material Type, 2024 to 2034
Figure 128: Tohoku Industry Analysis and Outlook Value (US$ Million) by Application, 2024 to 2034
Figure 129: Tohoku Industry Analysis and Outlook Value (US$ Million) by Operation, 2024 to 2034
Figure 130: Tohoku Industry Analysis and Outlook Value (US$ Million) by Vehicle Type, 2024 to 2034
Figure 131: Tohoku Industry Analysis and Outlook Value (US$ Million) Analysis by Material Type, 2019 to 2034
Figure 132: Tohoku Industry Analysis and Outlook Volume (Unit) Analysis by Material Type, 2019 to 2034
Figure 133: Tohoku Industry Analysis and Outlook Value Share (%) and BPS Analysis by Material Type, 2024 to 2034
Figure 134: Tohoku Industry Analysis and Outlook Y-o-Y Growth (%) Projections by Material Type, 2024 to 2034
Figure 135: Tohoku Industry Analysis and Outlook Value (US$ Million) Analysis by Application, 2019 to 2034
Figure 136: Tohoku Industry Analysis and Outlook Volume (Unit) Analysis by Application, 2019 to 2034
Figure 137: Tohoku Industry Analysis and Outlook Value Share (%) and BPS Analysis by Application, 2024 to 2034
Figure 138: Tohoku Industry Analysis and Outlook Y-o-Y Growth (%) Projections by Application, 2024 to 2034
Figure 139: Tohoku Industry Analysis and Outlook Value (US$ Million) Analysis by Operation, 2019 to 2034
Figure 140: Tohoku Industry Analysis and Outlook Volume (Unit) Analysis by Operation, 2019 to 2034
Figure 141: Tohoku Industry Analysis and Outlook Value Share (%) and BPS Analysis by Operation, 2024 to 2034
Figure 142: Tohoku Industry Analysis and Outlook Y-o-Y Growth (%) Projections by Operation, 2024 to 2034
Figure 143: Tohoku Industry Analysis and Outlook Value (US$ Million) Analysis by Vehicle Type, 2019 to 2034
Figure 144: Tohoku Industry Analysis and Outlook Volume (Unit) Analysis by Vehicle Type, 2019 to 2034
Figure 145: Tohoku Industry Analysis and Outlook Value Share (%) and BPS Analysis by Vehicle Type, 2024 to 2034
Figure 146: Tohoku Industry Analysis and Outlook Y-o-Y Growth (%) Projections by Vehicle Type, 2024 to 2034
Figure 147: Tohoku Industry Analysis and Outlook Attractiveness by Material Type, 2024 to 2034
Figure 148: Tohoku Industry Analysis and Outlook Attractiveness by Application, 2024 to 2034
Figure 149: Tohoku Industry Analysis and Outlook Attractiveness by Operation, 2024 to 2034
Figure 150: Tohoku Industry Analysis and Outlook Attractiveness by Vehicle Type, 2024 to 2034
Figure 151: Rest of Industry Analysis and Outlook Value (US$ Million) by Material Type, 2024 to 2034
Figure 152: Rest of Industry Analysis and Outlook Value (US$ Million) by Application, 2024 to 2034
Figure 153: Rest of Industry Analysis and Outlook Value (US$ Million) by Operation, 2024 to 2034
Figure 154: Rest of Industry Analysis and Outlook Value (US$ Million) by Vehicle Type, 2024 to 2034
Figure 155: Rest of Industry Analysis and Outlook Value (US$ Million) Analysis by Material Type, 2019 to 2034
Figure 156: Rest of Industry Analysis and Outlook Volume (Unit) Analysis by Material Type, 2019 to 2034
Figure 157: Rest of Industry Analysis and Outlook Value Share (%) and BPS Analysis by Material Type, 2024 to 2034
Figure 158: Rest of Industry Analysis and Outlook Y-o-Y Growth (%) Projections by Material Type, 2024 to 2034
Figure 159: Rest of Industry Analysis and Outlook Value (US$ Million) Analysis by Application, 2019 to 2034
Figure 160: Rest of Industry Analysis and Outlook Volume (Unit) Analysis by Application, 2019 to 2034
Figure 161: Rest of Industry Analysis and Outlook Value Share (%) and BPS Analysis by Application, 2024 to 2034
Figure 162: Rest of Industry Analysis and Outlook Y-o-Y Growth (%) Projections by Application, 2024 to 2034
Figure 163: Rest of Industry Analysis and Outlook Value (US$ Million) Analysis by Operation, 2019 to 2034
Figure 164: Rest of Industry Analysis and Outlook Volume (Unit) Analysis by Operation, 2019 to 2034
Figure 165: Rest of Industry Analysis and Outlook Value Share (%) and BPS Analysis by Operation, 2024 to 2034
Figure 166: Rest of Industry Analysis and Outlook Y-o-Y Growth (%) Projections by Operation, 2024 to 2034
Figure 167: Rest of Industry Analysis and Outlook Value (US$ Million) Analysis by Vehicle Type, 2019 to 2034
Figure 168: Rest of Industry Analysis and Outlook Volume (Unit) Analysis by Vehicle Type, 2019 to 2034
Figure 169: Rest of Industry Analysis and Outlook Value Share (%) and BPS Analysis by Vehicle Type, 2024 to 2034
Figure 170: Rest of Industry Analysis and Outlook Y-o-Y Growth (%) Projections by Vehicle Type, 2024 to 2034
Figure 171: Rest of Industry Analysis and Outlook Attractiveness by Material Type, 2024 to 2034
Figure 172: Rest of Industry Analysis and Outlook Attractiveness by Application, 2024 to 2034
Figure 173: Rest of Industry Analysis and Outlook Attractiveness by Operation, 2024 to 2034
Figure 174: Rest of Industry Analysis and Outlook Attractiveness by Vehicle Type, 2024 to 2034
The automotive load floor industry in Japan is poised to be valued at USD 191.2 million in 2024.
The anticipated CAGR for automotive load floor through 2034 is 4.20%.
Demand for automotive load floors in Japan will be USD 288.51 million by 2034.
Composite material remains the top segment in the automotive load floor industry in Japan.
Explore Automotive Interior Insights
Thank you!
You will receive an email from our Business Development Manager. Please be sure to check your SPAM/JUNK folder too.