The automotive load floor market is expected to experience steady growth over the next decade, with a projected CAGR of 5.1% from 2025 to 2035. Market value is anticipated to increase from USD 300.9 million in 2025 to USD 494.8 million in 2035, reflecting consistent demand for functional, durable, and lightweight load floor solutions in passenger vehicles and commercial vans. The growth curve suggests a gradual upward trajectory, indicating incremental adoption driven by consumer preference for vehicle customization, cargo management efficiency, and enhanced interior utility. Manufacturers are likely to focus on developing load floors with improved material strength, weight optimization, and design versatility, which will support gradual market expansion.
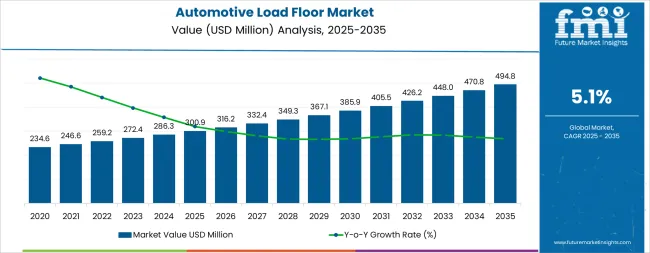
In the initial phase from 2025 to 2030, the curve is expected to show a steady incline, reflecting replacement demand, minor upgrades, and moderate adoption in new vehicle production. During the latter half of the period, from 2030 to 2035, the growth curve may steepen slightly as manufacturers introduce more advanced designs and lightweight composite materials, and as automotive production expands in emerging markets. Although the overall growth remains moderate, the curve indicates consistent market momentum rather than abrupt spikes, highlighting long-term stability.
The automotive load floor market is primarily divided between Original Equipment Manufacturers (OEMs) and the aftermarket sector. The OEM segment dominates with roughly 73% of the market, driven by direct partnerships with automakers and the supply of pre-installed, high-quality load floors that meet strict safety and design standards. The aftermarket segment accounts for the remaining share, offering customizable options such as adjustable heights and modular designs that cater to specific consumer preferences. Together, these segments form the foundation of the market, balancing factory-fitted solutions with flexible aftermarket innovations.
Recent trends in the market emphasize lightweight and environmentally friendly materials. Composites such as honeycomb polypropylene are increasingly used for their strength-to-weight ratio and recyclability. Advanced manufacturing techniques, including 3D printing and injection molding, enable cost-effective production of complex designs. Smart features, such as sensors and connectivity options, are being integrated into load floors to improve functionality and user convenience.
| Metric | Value |
|---|---|
| Market Value (2025) | USD 300.9 million |
| Market Forecast Value (2035) | USD 494.8 million |
| Forecast CAGR (2025–2035) | 5.1% |
Market expansion is being supported by the rapid growth of electric vehicle production globally and the corresponding need for optimized weight distribution and cargo space management in battery-powered vehicles. Modern automotive design requires innovative load floor solutions that accommodate battery packs while maintaining practical cargo capacity and vehicle performance characteristics. The superior strength-to-weight ratio and design flexibility of advanced load floor materials make them essential components in next-generation vehicle platforms where weight reduction directly impacts driving range and energy efficiency.
The growing emphasis on interior versatility and consumer demand for multifunctional cargo spaces is driving automotive manufacturers to invest in sophisticated load floor systems with modular configurations, integrated storage compartments, and adaptable surface features. Premium vehicle segments increasingly offer advanced cargo management solutions that include adjustable floor heights, removable panels, and integrated organizational elements. The expanding SUV and crossover market segment particularly benefits from innovative load floor designs that maximize interior utility while maintaining aesthetic appeal and durability under varied loading conditions.
Environmental regulations mandating improved fuel efficiency and reduced emissions are compelling automotive manufacturers to adopt lightweight materials throughout vehicle construction, with load floor systems representing significant opportunities for mass reduction without compromising structural integrity or safety performance. Advanced materials including honeycomb polypropylene and composite solutions enable substantial weight savings compared to traditional hardboard constructions while offering enhanced moisture resistance, acoustic dampening properties, and long-term durability. The automotive industry's transition toward sustainable manufacturing practices further accelerates adoption of recyclable and eco-friendly load floor materials.
The market is segmented by material type, application, and region. By material type, the market is divided into Hardboard, Fluted Polypropylene, Honeycomb Polypropylene, and Composites. Based on application, the market is categorized into Interior Systems, Cargo Systems, and Load Floor Systems. Regionally, the market is divided into North America, Latin America, Western Europe, South Asia, East Asia, Eastern Europe, and Middle East & Africa.
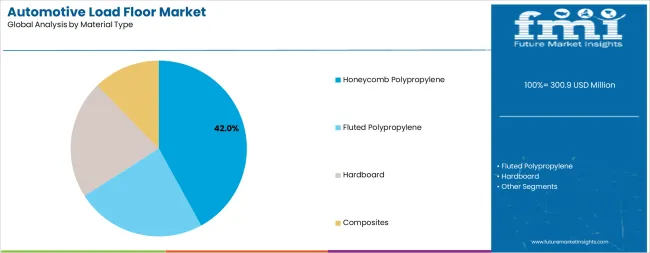
Honeycomb Polypropylene configurations are projected to account for 42% of the automotive load floor market in 2025. This leading share is supported by the material's exceptional strength-to-weight ratio, superior impact resistance, and excellent moisture protection characteristics that meet demanding automotive performance requirements. Honeycomb polypropylene structures provide optimal rigidity while achieving significant weight reduction compared to conventional materials, making them the preferred choice for electric vehicle manufacturers focused on maximizing battery range and overall vehicle efficiency.
Modern honeycomb polypropylene load floors incorporate advanced manufacturing techniques that enable complex geometries, integrated mounting points, and precise dimensional tolerances required for contemporary vehicle platforms. The material's inherent flexibility allows designers to create contoured surfaces that maximize cargo volume while accommodating vehicle architecture constraints including wheel wells, suspension components, and underbody structures. Automotive manufacturers particularly value the material's consistent performance characteristics across wide temperature ranges and its resistance to chemical exposure from typical automotive fluids and cargo materials.
The segment benefits from continuous material science innovations that improve honeycomb cell structures, optimize polymer formulations, and enhance bonding technologies between facing layers and core materials. These advancements have progressively improved load-bearing capacity, acoustic insulation properties, and long-term durability while maintaining cost competitiveness with alternative materials. The electric vehicle revolution particularly drives honeycomb polypropylene adoption, as EV manufacturers prioritize weight optimization to offset heavy battery systems and achieve competitive driving ranges.
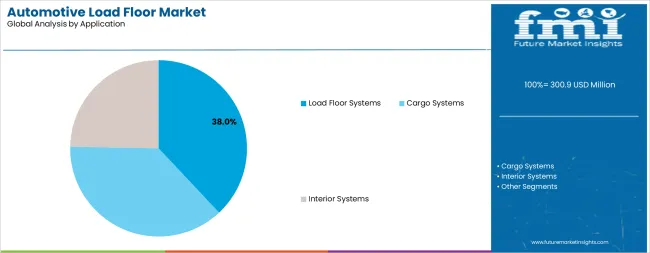
Load floor systems applications are expected to represent 38% of automotive load floor demand in 2025. This dominant share reflects the critical importance of dedicated floor structures in modern vehicle cargo area design and the growing consumer expectation for versatile, functional trunk spaces. Load floor systems serve as foundational elements that define cargo area utility, providing stable surfaces for luggage and goods while concealing spare tires, tools, and storage compartments beneath the primary floor level.
Contemporary load floor systems incorporate sophisticated engineering that addresses multiple functional requirements including load distribution, noise vibration and harshness (NVH) management, and integration with vehicle safety systems. These systems must withstand significant dynamic loads during vehicle operation while maintaining dimensional stability across temperature and humidity variations. The segment benefits from increasing vehicle production in SUV and crossover categories, where cargo capacity and flexibility represent key purchasing factors for consumers.
Advanced load floor systems feature modular designs that enable multiple configurations to accommodate varying cargo requirements, from flat loading surfaces for maximum volume utilization to raised positions that create additional hidden storage compartments. Premium implementations include electrically adjustable height mechanisms, integrated tie-down points, and removable sections that facilitate cleaning and maintenance. The automotive industry's focus on enhancing user experience drives continuous innovation in load floor functionality and convenience features.
The load floor systems increasingly incorporate acoustic treatment materials and structural reinforcement elements that contribute to overall vehicle refinement and safety performance. The segment also benefits from growing e-commerce activity and changing consumer lifestyles that place greater emphasis on cargo carrying capability and interior practicality. Automotive manufacturers recognize load floor design as a differentiating feature that influences purchasing decisions in competitive vehicle segments.
The automotive load floor market is advancing steadily due to increasing vehicle electrification and growing recognition of lightweight material importance in achieving performance and efficiency targets. The market faces challenges including material cost pressures, complex integration requirements with vehicle architectures, and varying performance specifications across different vehicle segments and regional markets. Standardization efforts and material certification programs continue to influence product development and adoption patterns.
The rapid expansion of electric vehicle production globally is fundamentally reshaping automotive load floor requirements and accelerating adoption of advanced lightweight materials. Electric vehicles require optimized weight distribution to maximize battery range and performance, making every component's mass contribution critical to overall vehicle efficiency. Load floor systems represent significant opportunities for weight reduction while maintaining structural integrity and cargo functionality that consumers expect.
Battery pack integration in EV platforms creates unique packaging challenges that demand innovative load floor solutions capable of accommodating complex underbody architectures while preserving usable cargo volume. Honeycomb polypropylene and advanced composite materials enable engineers to design load floors that bridge over battery structures, provide necessary support for cargo loads, and contribute to vehicle rigidity without excessive mass penalties. The material flexibility also facilitates integration of cable management systems, thermal barriers, and acoustic treatments required in electric vehicle applications.
Automotive manufacturers are increasingly embracing modular interior architectures that provide consumers with configurable spaces adaptable to diverse lifestyle needs and usage scenarios. Load floor systems play central roles in these flexible interior concepts, serving as platforms for removable storage modules, adjustable compartment dividers, and integrated organizational accessories. This trend is particularly prominent in SUV and crossover segments where interior versatility represents a key value proposition.
Modern load floor designs incorporate quick-release attachment systems, standardized mounting interfaces, and compatible accessory ecosystems that enable consumers to personalize their cargo areas. Premium implementations feature electrically adjustable load floors that can be raised or lowered via switches or smartphone applications, creating multi-level storage configurations. The integration of smart features including weight sensors, lighting elements, and power outlets further enhances load floor utility and aligns with broader automotive digitalization trends.
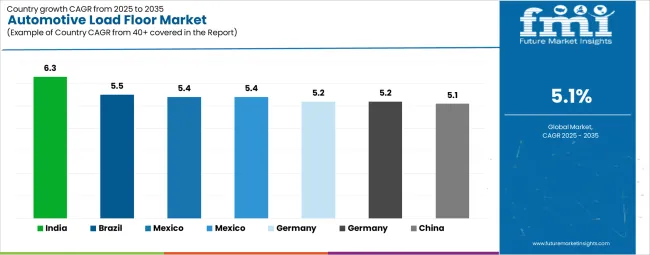
| Country | CAGR (2025–2035) |
|---|---|
| India | 6.3% |
| Brazil | 5.5% |
| Mexico | 5.4% |
| South Korea | 5.4% |
| Germany | 5.2% |
| United Kingdom | 5.2% |
| China | 5.1% |
The automotive load floor market is growing rapidly, with India leading at a 6.3% CAGR through 2035, driven by massive expansion in domestic vehicle production, growing middle-class purchasing power, and increasing localization of automotive component manufacturing. Germany follows at 5.2%, supported by premium vehicle production leadership, advanced engineering capabilities, and strong focus on lightweight materials for performance and efficiency. The United Kingdom records strong growth at 5.2%, emphasizing electric vehicle adoption and automotive industry transformation initiatives. Brazil grows steadily at 5.5%, integrating advanced load floor systems into expanding domestic vehicle production for Latin American markets. South Korea shows robust growth at 5.4%, focusing on electric vehicle platforms and innovative interior design solutions. Mexico maintains strong expansion at 5.4%, supported by nearshoring trends and growing automotive manufacturing investments. China demonstrates stable growth at 5.1%, emphasizing electric vehicle production scale and domestic component supply chain development.
The report covers an in-depth analysis of 40+ countries, Top-performing countries are highlighted below.
Demand for automotive load floor systems in India is projected to exhibit the highest growth rate with a CAGR of 6.3% through 2035, driven by rapid expansion of domestic vehicle production, increasing consumer vehicle ownership rates, and growing automotive component manufacturing capabilities. The country's burgeoning SUV and crossover segments are creating substantial demand for advanced load floor solutions that meet evolving consumer expectations for interior quality and functionality. Major automotive manufacturers are establishing comprehensive supply chains and investing in local component production to support growing market demand.
Demand for automotive load floor systems in Germany is projected to grow at a CAGR of 5.2%, supported by the country's leadership in premium vehicle production and commitment to advanced engineering excellence. German automotive manufacturers are implementing cutting-edge load floor technologies that incorporate lightweight materials, modular designs, and integrated smart features that align with premium brand positioning. The market is characterized by emphasis on material quality, precision manufacturing, and innovative functionality that differentiates premium vehicle offerings.
Demand for automotive load floor systems in the United Kingdom is expanding at a CAGR of 5.2%, driven by accelerating electric vehicle adoption and ongoing transformation of the domestic automotive industry. UK-based vehicle manufacturers and component suppliers are developing specialized load floor solutions optimized for electric vehicle platforms and aligned with government initiatives. The market benefits from strong engineering capabilities, advanced materials expertise, and focus on innovation in vehicle interior design.
Revenue from automotive load floor systems in Brazil is growing at a CAGR of 5.5%, driven by expanding domestic vehicle production serving Latin American markets and increasing consumer demand for SUV and pickup truck segments. Brazilian automotive manufacturers are investing in modern production facilities and component supply chains that support growing vehicle assembly volumes. The market benefits from government policies encouraging domestic manufacturing and regional trade agreements facilitating component exports.
Demand for automotive load floor systems in South Korea is expanding at a CAGR of 5.4%, driven by the country's aggressive electric vehicle development programs and advanced automotive engineering capabilities. Korean vehicle manufacturers are pioneering innovative interior designs that maximize space efficiency and functionality in electric vehicle platforms. The market is characterized by emphasis on cutting-edge materials, integrated smart features, and modular configurations that support diverse consumer preferences.
Demand for automotive load floor systems in Mexico is projected to grow at a CAGR of 5.4%, supported by ongoing automotive manufacturing investments, nearshoring trends benefiting North American production, and expanding component supply chain capabilities. Mexican automotive facilities are producing increasing volumes for both domestic consumption and export markets, particularly serving United States and Canadian vehicle demand. The market benefits from competitive manufacturing costs and proximity to major automotive markets.
Demand for automotive load floor systems in China is expanding at a CAGR of 5.1%, driven by massive electric vehicle production scale and comprehensive domestic automotive supply chain capabilities. Chinese automotive manufacturers are rapidly advancing interior design and material technologies while maintaining cost competitiveness in mass-market vehicle segments. The market benefits from government support for electric vehicle adoption and extensive domestic component manufacturing infrastructure.
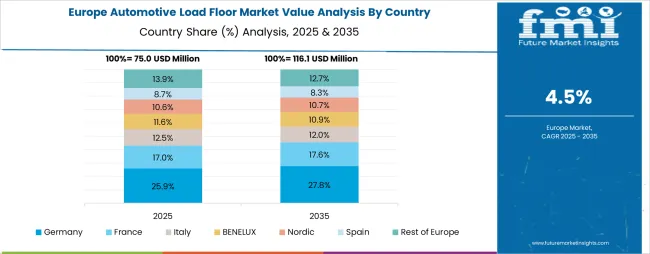
The automotive load floor market in Europe is projected to grow from USD 82.4 million in 2025 to USD 115.8 million by 2035, registering a CAGR of 3.5% over the forecast period. Germany is expected to maintain its leadership with a 32.5% share in 2025, supported by its dominant premium vehicle manufacturing sector and advanced automotive engineering capabilities. The United Kingdom follows with 19.8% market share, driven by electric vehicle transition programs and automotive industry modernization initiatives. France holds 16.2% of the European market, benefiting from domestic automotive manufacturing and component supply chain development. Italy and Spain collectively represent 18.4% of regional demand, with growing focus on lightweight materials and interior innovation. The Rest of Western Europe region accounts for 13.1% of the market, supported by automotive production in Nordic countries and BENELUX manufacturing facilities.
The automotive load floor market is defined by competition among established automotive interior suppliers, specialized component manufacturers, and integrated tier-one automotive suppliers. Companies are investing in advanced material technologies, lightweighting solutions, modular design capabilities, and manufacturing process optimization to deliver cost-effective, high-performance load floor systems. Strategic partnerships, technological innovation, and geographic expansion are central to strengthening product portfolios and market presence.
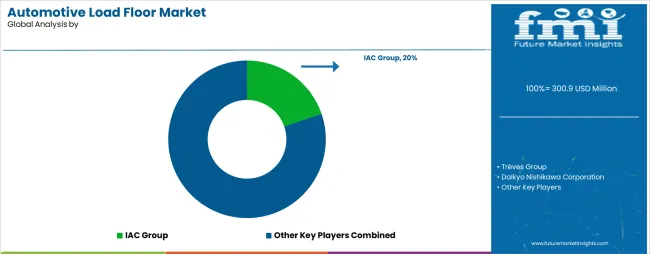
IAC Group, operating globally with approximately 19-21% market share, offers comprehensive automotive interior solutions with focus on lightweight materials, integrated manufacturing capabilities, and close collaboration with automotive OEMs. The company provides advanced load floor systems incorporating honeycomb polypropylene and composite materials for diverse vehicle platforms.
Trèves Group, multinational with estimated 13-15% market share, delivers specialized automotive interior components with emphasis on acoustic and thermal management integration. The company serves European automotive manufacturers with sophisticated load floor solutions that meet premium vehicle requirements.
Daikyo Nishikawa Corporation, prominent in Asian markets with approximately 11-13% market share, provides resin-based automotive interior components including advanced load floor systems for Japanese and Chinese vehicle manufacturers. The company focuses on material innovation and manufacturing efficiency.
Motus Integrated Technologies, with estimated 9-11% market share in North American markets, specializes in engineered fiber and thermoplastic automotive components. The company offers load floor solutions emphasizing lightweight design and degradable materials.
Toyota Boshoku Corporation, Toyota Group affiliate with approximately 8-10% market share, provides integrated automotive interior systems including load floor modules and cargo management solutions. The company benefits from close collaboration with Toyota vehicle platforms and global manufacturing presence.
Additional market participants including Grupo Antolin, Faurecia, Lear Corporation, SA Automotive, CIE Automotive, Autoneum, Roechling Group, UGN Inc., Auria Solutions, and Tachi-S contribute specialized expertise, regional manufacturing capabilities, and material technology innovations across global and regional markets.
The automotive load floor market underpins vehicle lightweighting initiatives, interior functionality enhancement, electric vehicle range optimization, and material adoption. With evolving regulatory requirements, accelerating electrification trends, and increasing consumer expectations for interior versatility, the sector must balance cost competitiveness, performance reliability, and manufacturing scalability. Coordinated contributions from governments, industry associations, automotive OEMs, component suppliers, and investors will accelerate the transition toward lightweight, and technologically advanced load floor solutions.
How OEMS and Technology Integrators Could Strengthen the Ecosystem?
| Item | Value |
|---|---|
| Quantitative Units | USD 300.9 million |
| Material Type | Hardboard, Fluted Polypropylene, Honeycomb Polypropylene, Composites |
| Application | Interior Systems, Cargo Systems, Load Floor Systems |
| Regions Covered | North America, Latin America, Western Europe, South Asia, East Asia, Eastern Europe, Middle East & Africa |
| Countries Covered | United States, Germany, India, China, United Kingdom, Japan, Brazil, South Korea, Mexico, +40 others |
| Key Companies Profiled | IAC Group, Trèves Group, Daikyo Nishikawa Corporation, Motus Integrated Technologies, Toyota Boshoku Corporation, Grupo Antolin, Faurecia, Lear Corporation, SA Automotive, CIE Automotive, Autoneum, Roechling Group, UGN Inc., Auria Solutions, Tachi-S |
| Additional Attributes | Dollar sales by material type and application; regional demand trends across North America, Europe, and Asia-Pacific; competitive landscape with established suppliers and emerging manufacturers; buyer preferences for lightweight vs. traditional materials; integration with EV platforms and battery systems; innovations in sustainable and recyclable materials; adoption of modular designs with smart features |
Material Type
The global automotive load floor market is estimated to be valued at USD 300.9 million in 2025.
The market size for the automotive load floor market is projected to reach USD 494.8 million by 2035.
The automotive load floor market is expected to grow at a 5.1% CAGR between 2025 and 2035.
The key product types in automotive load floor market are honeycomb polypropylene, fluted polypropylene, hardboard and composites.
In terms of application, load floor systems segment to command 38.0% share in the automotive load floor market in 2025.


Full Research Suite comprises of:
Market outlook & trends analysis
Interviews & case studies
Strategic recommendations
Vendor profiles & capabilities analysis
5-year forecasts
8 regions and 60+ country-level data splits
Market segment data splits
12 months of continuous data updates
DELIVERED AS:
PDF EXCEL ONLINE
Japan Automotive Load Floor Industry Analysis Size and Share Forecast Outlook 2025 to 2035
Korea Automotive Load Floor Market Growth - Trends & Forecast 2025 to 2035
Western Europe Automotive Load Floor IndustryAnalysis in Western Europe Forecast & Analysis 2025 to 2035
Automotive Performance Part Market Size and Share Forecast Outlook 2025 to 2035
Automotive Carbon Ceramic Brake Market Size and Share Forecast Outlook 2025 to 2035
Automotive Camshaft Market Size and Share Forecast Outlook 2025 to 2035
Automotive Stamping Industry Analysis in India Size and Share Forecast Outlook 2025 to 2035
Automotive Cylinder Liner Market Size and Share Forecast Outlook 2025 to 2035
Automotive Microcontroller Market Size and Share Forecast Outlook 2025 to 2035
Automotive Roof Rails Market Size and Share Forecast Outlook 2025 to 2035
Automotive Active Safety System Market Size and Share Forecast Outlook 2025 to 2035
Automotive Diagnostic Scan Tool Market Size and Share Forecast Outlook 2025 to 2035
Automotive Test Equipment Market Size and Share Forecast Outlook 2025 to 2035
Automotive Dynamic Map Data Market Size and Share Forecast Outlook 2025 to 2035
Automotive Green Tires Market Size and Share Forecast Outlook 2025 to 2035
Automotive E-Tailing Market Size and Share Forecast Outlook 2025 to 2035
Automotive Interior Market Forecast Outlook 2025 to 2035
Automotive Key Market Size and Share Forecast Outlook 2025 to 2035
Automotive Appearance Chemical Market Forecast and Outlook 2025 to 2035
Automotive Seating Market Forecast and Outlook 2025 to 2035

Thank you!
You will receive an email from our Business Development Manager. Please be sure to check your SPAM/JUNK folder too.
Chat With
MaRIA