Automotive Grade Inductors Market
Market Insights on Automotive Grade Inductors covering sales outlook, demand forecast & up-to-date key trends
Automotive Grade Inductors Market by Inductance Range, Vehicle Type, Sales Channel & Region - Forecast 2022 – 2032
Automotive Grade Inductors Market Snapshot (2022-2032)
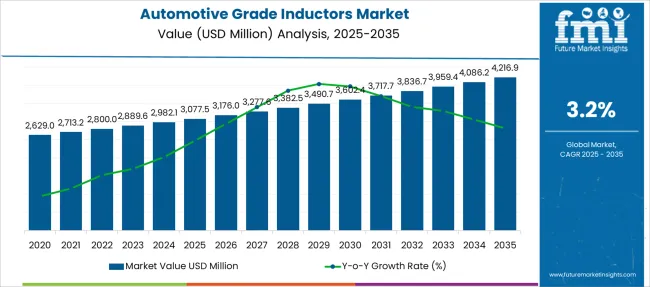
[307 Pages Report] Global automotive grade inductors demand is anticipated to be valued at US$ 2,800 Million in 2022, forecast to grow at a CAGR of 3.20% from 2022 to 2032, to be valued at US$ 3,836.56 Million. As of 2021, the market was valued at US$ 2,759 Million, and is poised to register a Y-o-Y growth rate of 1.5% by 2022.
Growth is attributed to its strong AC and DC current-resistance feature and its current regulating mechanism that enhances the operations of the automotive accessories. It also regulates current flow to the electronic parts in the automobiles such as in-vehicle infotainment systems and LED lights.
Report Attribute |
Details |
Estimated Base Year Value (2021) |
US$ 2,759 Million |
Expected Market Value (2022) |
US 2,800 Million |
Anticipated Forecast Value (2032) |
US$ 3,836.56 Million |
Projected Growth Rate (2022-2032) |
3.2% CAGR |
Automotive inductors are made up of a coil winding, possessing two terminals through which passes a flux. A change in amount of flux passing through the coil determines the inductive current. In reality, there is a voltage drop around the coil due to flux passing through the coil which induces a current in the coil.
This current regulation feature that stabilizes the electric circuits in the cars is one of the main reasons for its growth of automotive grade inductors market. A significant development in the automotive grade inductors market is the design of high-end inductors that operate under extreme temperature conditions without any significant downtime. This improves the productive efficiency of the vehicle parts, in turn driving the automotive grade induction market to high growth.
Furthermore, the government stipulated regulations to support the passive electronic parts in the automobiles has tremendously bolstered the automotive grade inductors enhancing the market infinitely during the forecast period.
Let us know your requirement to get
100% FREE customization
Which are Some Prominent Drivers Spearheading Automotive Grade Inductors Market Growth?
Adoption of part accessories to augment efficiency of operations is witnessing growth of the automotive grade inductors market over the forecast period. The epitome of global standard for stress resistance- AEC-200 which underlines efficiency in the vehicles to withstand extreme temperatures and resistance to physical stress drives growth for automotive grade inductors market. The clutter-free and noiseless operations of the intricate parts in the automobiles augments the prolific design and manufacture of the passive automotive grade inductors, driving automotive grade inductors market.
Miniaturization of parts in the passive component industry leads to growth of the automotive grade inductors market with development of miniature inductors. Furthermore, Wi-Fi, Bluetooth, GPRS and GPS enabled digitalization in technology will directly impact the automotive grade inductors market. With integration of technology, the automotive grade inductors market finds a strong foothold in the market.
What are the Challenges Faced by the Automotive Grade Inductors Industry?
A consistent drive to spur the technological frontiers of the automobile industry by introducing new technology has taken its toll on the automotive grade inductors industry. Also, the raw materials in the manufacture of electronic inductors is traversing a low trajectory.
This is due to supply of copper which makes up the inductive coil in the automotive grade inductors and ferrite rod which are imported from China, Japan, and India are fluctuating owing to variations in prices. Thus the prices of raw materials will impact the automotive grade inductor industry adversely.
Find your sweet spots for generating winning opportunities in this market.
Talk to AnalystWhy is Asia-Pacific Emerging as an Opportunistic Automotive Grade Inductors Market?
Asia Pacific is anticipated to grow at a considerable growth rate in the global automotive grade inductors market owing to prolific number of passenger cars under manufacture coupled with increasing market penetration of electrically monitored accessories. China is tagged with the moniker- automotive capital of the world with largest automotive market in the world, registrations climbing to 21 million units in 2020.
How is Europe Contributing to growth of the Automotive Grade Inductors Market?
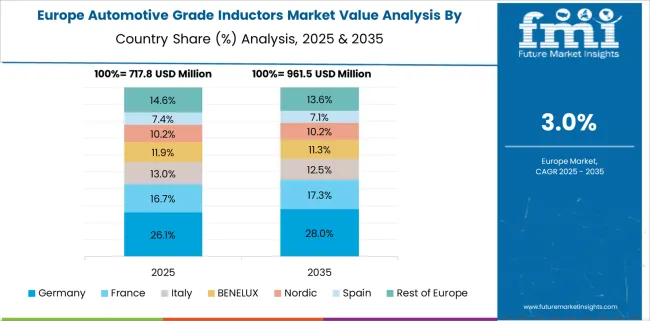
Europe is projected to witness noteworthy growth in the global automotive grade inductors market during the slated timeframe owing to rising vehicle production as well as growing demand for passenger vehicles. Germany has new car brands rolling out with iconic automotive designs such as Mercedes, BMW and Audi belonging to the nation and adding value to the automotive grade inductors market.

A unified Market Research Subscription Platform, built for today's disparate research needs.
Market Competition
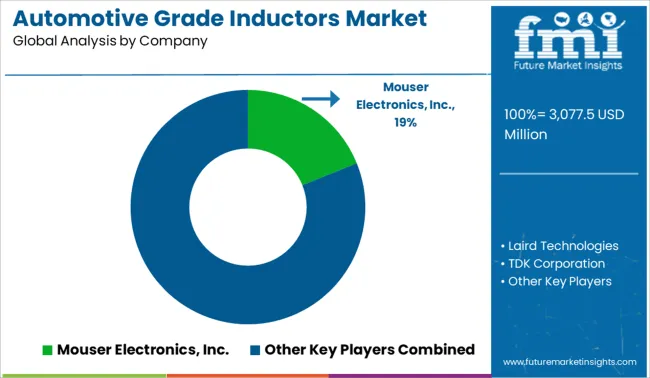
Some of the key participants present in the global automotive grade inductors market include Mouser Electronics, Inc., Laird Technologies, TDK Corporation, Abracon, TTI, Inc., Avnet, Inc., Vishay Intertechnology, Bourns, Inc., Murata Manufacturing Co., Ltd., and Viking Tech Corporation.
With presence of such high number of participants, the market is highly competitive. While global players such as TDK Corporation and Abracon account for a considerable market size, several regional level players are also operating across key growth regions, particularly in the Asia Pacific.
Report Scope
Report Attribute |
Details |
Growth Rate |
CAGR of 3.2% from 2022 to 2032 |
Market Value in 2022 |
US$ 2,800 Million |
Market Value in 2032 |
US$ 3,836.56 Million |
Base Year for Estimation |
2021 |
Historical Data |
2017-2021 |
Forecast Period |
2022-2032 |
Quantitative Units |
Revenue in US$ Million, and CAGR from 2022-2032 |
Report Coverage |
Revenue Forecast, Volume Forecast, Company Ranking, Competitive Landscape, Growth Factors, Trends and Pricing Analysis |
Segments Covered |
|
Regions Covered |
|
Key Countries Profiled |
|
Key Companies Profiled |
|
Customization |
Available Upon Request |
Key Segments Covered in the Automotive Grade Inductors Market Report
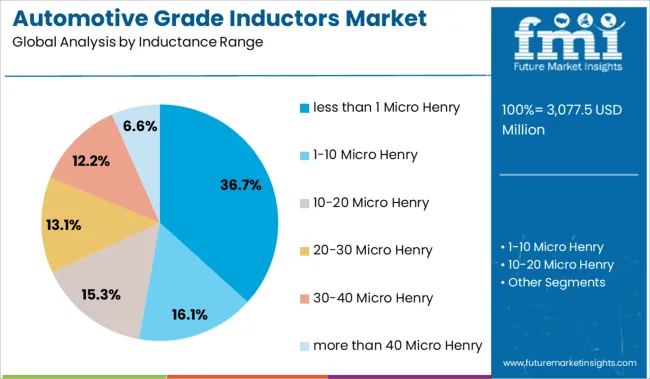
Automotive Grade Inductors Market by Inductance Range:
- Automotive Grade Inductors less than 1 Micro Henry
- Automotive Grade Inductors from 1-10 Micro Henry
- Automotive Grade Inductors from 10-20 Micro Henry
- Automotive Grade Inductors from 20-30 Micro Henry
- Automotive Grade Inductors from 30-40 Micro Henry
- Automotive Grade Inductors more than 40 Micro Henry
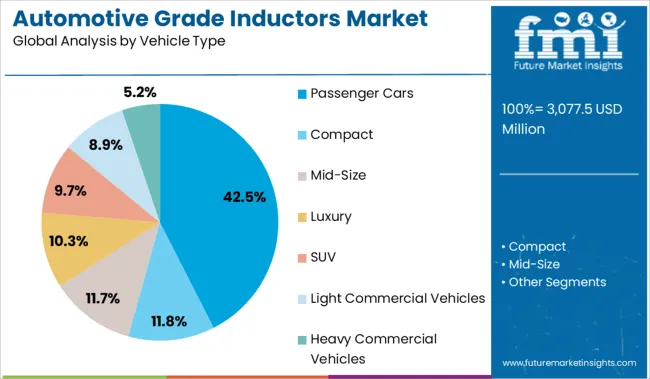
Automotive Grade Inductors Market by Vehicle Type:
- Automotive Grade Inductors for Passenger Cars
- Compact
- Mid-Size
- Luxury
- SUV
- Automotive Grade Inductors for Light Commercial Vehicles
- Automotive Grade Inductors for Heavy Commercial Vehicles
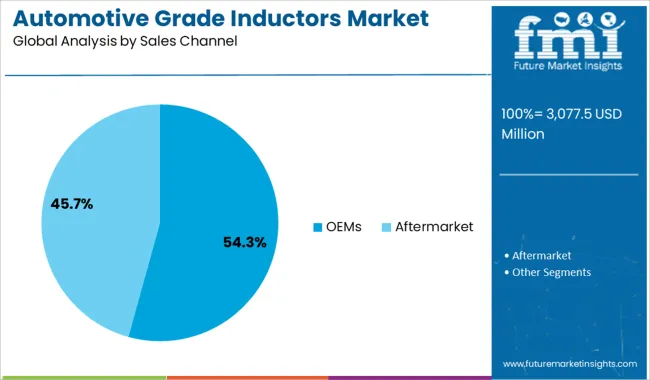
Automotive Grade Inductors Market by Sales Channel:
- Automotive Grade Inductors Sales via OEMs
- Automotive Grade Inductors Sales via Aftermarket
Automotive Grade Inductors Market by Region:
- North America Automotive Grade Inductors Market
- Latin America Automotive Grade Inductors Market
- Europe Automotive Grade Inductors Market
- Asia Pacific Automotive Grade Inductors Market
- Middle East and Africa Automotive Grade Inductors Market
Frequently Asked Questions
According to Future Market Insights, automotive grade inductors market demand is poised to grow at a 3.2% CAGR from 2022-2032
Asia Pacific is slated to be the most promising hub for automotive grade inductors
Mouser Electronics Inc., Laird Technologies and TDK Corporation are amongst the most prominent automotive grade inductors market players
Table of Content
1. Executive Summary
1.1. Global Market Outlook
1.2. Demand-side Trends
1.3. Supply-side Trends
1.4. Technology Roadmap Analysis
1.5. Analysis and Recommendations
2. Market Overview
2.1. Market Coverage / Taxonomy
2.2. Market Definition / Scope / Limitations
3. Market Background
3.1. Market Dynamics
3.1.1. Drivers
3.1.2. Restraints
3.1.3. Opportunity
3.1.4. Trends
3.2. Scenario Forecast
3.2.1. Demand in Optimistic Scenario
3.2.2. Demand in Likely Scenario
3.2.3. Demand in Conservative Scenario
3.3. Opportunity Map Analysis
3.4. Product Life Cycle Analysis
3.5. Supply Chain Analysis
3.5.1. Supply Side Participants and their Roles
3.5.1.1. Producers
3.5.1.2. Mid-Level Participants (Traders/ Agents/ Brokers)
3.5.1.3. Wholesalers and Distributors
3.5.2. Value Added and Value Created at Node in the Supply Chain
3.5.3. List of Raw Material Suppliers
3.5.4. List of Existing and Potential Buyer’s
3.6. Investment Feasibility Matrix
3.7. Value Chain Analysis
3.7.1. Profit Margin Analysis
3.7.2. Wholesalers and Distributors
3.7.3. Retailers
3.8. PESTLE and Porter’s Analysis
3.9. Regulatory Landscape
3.9.1. By Key Regions
3.9.2. By Key Countries
3.10. Regional Parent Market Outlook
3.11. Production and Consumption Statistics
3.12. Import and Export Statistics
4. Global Automotive Grade Inductors Market Analysis 2017-2021 and Forecast, 2022-2032
4.1. Historical Market Size Value (US$ Mn) & Volume (Units) Analysis, 2017-2021
4.2. Current and Future Market Size Value (US$ Mn) & Volume (Units) Projections, 2022-2032
4.2.1. Y-o-Y Growth Trend Analysis
4.2.2. Absolute $ Opportunity Analysis
5. Global Automotive Grade Inductors Market Analysis 2017-2021 and Forecast 2022-2032, By Inductance Range
5.1. Introduction / Key Findings
5.2. Historical Market Size Value (US$ Mn) & Volume (Units) Analysis By Inductance Range, 2017-2021
5.3. Current and Future Market Size Value (US$ Mn) & Volume (Units) Analysis and Forecast By Inductance Range, 2022-2032
5.3.1. Less than 1 Micro Henry
5.3.2. 1 to 10 Micro Henry
5.3.3. 10 to 20 Micro Henry
5.3.4. 20 to 30 Micro Henry
5.3.5. 30 to 40 Micro Henry
5.3.6. More than 40 Micro Henry
5.4. Y-o-Y Growth Trend Analysis By Inductance Range, 2017-2021
5.5. Absolute $ Opportunity Analysis By Inductance Range, 2022-2032
6. Global Automotive Grade Inductors Market Analysis 2017-2021 and Forecast 2022-2032, By Vehicle Type
6.1. Introduction / Key Findings
6.2. Historical Market Size Value (US$ Mn) & Volume (Units) Analysis By Vehicle Type, 2017-2021
6.3. Current and Future Market Size Value (US$ Mn) & Volume (Units) Analysis and Forecast By Vehicle Type, 2022-2032
6.3.1. Passenger Car
6.3.2. Compact
6.3.3. Mid-Size
6.3.4. Luxury
6.3.5. SUV
6.3.6. Light Commercial Vehicle
6.3.7. Heavy Commercial Vehicle
6.4. Y-o-Y Growth Trend Analysis By Vehicle Type, 2017-2021
6.5. Absolute $ Opportunity Analysis By Vehicle Type, 2022-2032
7. Global Automotive Grade Inductors Market Analysis 2017-2021 and Forecast 2022-2032, By Sales Channel
7.1. Introduction / Key Findings
7.2. Historical Market Size Value (US$ Mn) & Volume (Units) Analysis By Sales Channel, 2017-2021
7.3. Current and Future Market Size Value (US$ Mn) & Volume (Units) Analysis and Forecast By Sales Channel, 2022-2032
7.3.1. Original Equipment Manufacturer (OEM)
7.3.2. Aftermarket
7.4. Y-o-Y Growth Trend Analysis By Sales Channel, 2017-2021
7.5. Absolute $ Opportunity Analysis By Sales Channel, 2022-2032
8. Global Automotive Grade Inductors Market Analysis 2017-2021 and Forecast 2022-2032, By Region
8.1. Introduction
8.2. Historical Market Size Value (US$ Mn) & Volume (Units) Analysis By Region, 2017-2021
8.3. Current Market Size Value (US$ Mn) & Volume (Units) Analysis and Forecast By Region, 2022-2032
8.3.1. North America
8.3.2. Latin America
8.3.3. Europe
8.3.4. Asia Pacific
8.3.5. Middle East and Africa
8.4. Market Attractiveness Analysis By Region
9. North America Automotive Grade Inductors Market Analysis 2017-2021 and Forecast 2022-2032, By Country
9.1. Historical Market Size Value (US$ Mn) & Volume (Units) Trend Analysis By Market Taxonomy, 2017-2021
9.2. Market Size Value (US$ Mn) & Volume (Units) Forecast By Market Taxonomy, 2022-2032
9.2.1. By Country
9.2.1.1. U.S.
9.2.1.2. Canada
9.2.2. By Inductance Range
9.2.3. By Vehicle Type
9.2.4. By Sales Channel
9.3. Market Attractiveness Analysis
9.3.1. By Country
9.3.2. By Inductance Range
9.3.3. By Vehicle Type
9.3.4. By Sales Channel
9.4. Key Takeaways
10. Latin America Automotive Grade Inductors Market Analysis 2017-2021 and Forecast 2022-2032, By Country
10.1. Historical Market Size Value (US$ Mn) & Volume (Units) Trend Analysis By Market Taxonomy, 2017-2021
10.2. Market Size Value (US$ Mn) & Volume (Units) Forecast By Market Taxonomy, 2022-2032
10.2.1. By Country
10.2.1.1. Brazil
10.2.1.2. Mexico
10.2.1.3. Argentina
10.2.1.4. Chile
10.2.1.5. Peru
10.2.1.6. Rest of Latin America
10.2.2. By Inductance Range
10.2.3. By Vehicle Type
10.2.4. By Sales Channel
10.3. Market Attractiveness Analysis
10.3.1. By Country
10.3.2. By Inductance Range
10.3.3. By Vehicle Type
10.3.4. By Sales Channel
10.4. Key Takeaways
11. Europe Automotive Grade Inductors Market Analysis 2017-2021 and Forecast 2022-2032, By Country
11.1. Historical Market Size Value (US$ Mn) & Volume (Units) Trend Analysis By Market Taxonomy, 2017-2021
11.2. Market Size Value (US$ Mn) & Volume (Units) Forecast By Market Taxonomy, 2022-2032
11.2.1. By Country
11.2.1.1. Germany
11.2.1.2. Italy
11.2.1.3. France
11.2.1.4. U.K.
11.2.1.5. Spain
11.2.1.6. Russia
11.2.1.7. BENELUX
11.2.1.8. Rest of Europe
11.2.2. By Inductance Range
11.2.3. By Vehicle Type
11.2.4. By Sales Channel
11.3. Market Attractiveness Analysis
11.3.1. By Country
11.3.2. By Inductance Range
11.3.3. By Vehicle Type
11.3.4. By Sales Channel
11.4. Key Takeaways
12. Asia Pacific Automotive Grade Inductors Market Analysis 2017-2021 and Forecast 2022-2032, By Country
12.1. Historical Market Size Value (US$ Mn) & Volume (Units) Trend Analysis By Market Taxonomy, 2017-2021
12.2. Market Size Value (US$ Mn) & Volume (Units) Forecast By Market Taxonomy, 2022-2032
12.2.1. By Country
12.2.1.1. China
12.2.1.2. Japan
12.2.1.3. South Korea
12.2.1.4. Rest of Asia Pacific
12.2.2. By Inductance Range
12.2.3. By Vehicle Type
12.2.4. By Sales Channel
12.3. Market Attractiveness Analysis
12.3.1. By Country
12.3.2. By Inductance Range
12.3.3. By Vehicle Type
12.3.4. By Sales Channel
12.4. Key Takeaways
13. Middle East and Africa Automotive Grade Inductors Market Analysis 2017-2021 and Forecast 2022-2032, By Country
13.1. Historical Market Size Value (US$ Mn) & Volume (Units) Trend Analysis By Market Taxonomy, 2017-2021
13.2. Market Size Value (US$ Mn) & Volume (Units) Forecast By Market Taxonomy, 2022-2032
13.2.1. By Country
13.2.1.1. GCC Countries
13.2.1.2. South Africa
13.2.1.3. Turkey
13.2.1.4. Rest of Middle East and Africa
13.2.2. By Inductance Range
13.2.3. By Vehicle Type
13.2.4. By Sales Channel
13.3. Market Attractiveness Analysis
13.3.1. By Country
13.3.2. By Inductance Range
13.3.3. By Vehicle Type
13.3.4. By Sales Channel
13.4. Key Takeaways
14. Key Countries Automotive Grade Inductors Market Analysis
14.1. U.S.
14.1.1. Pricing Analysis
14.1.2. Market Share Analysis, 2021
14.1.2.1. By Inductance Range
14.1.2.2. By Vehicle Type
14.1.2.3. By Sales Channel
14.2. Canada
14.2.1. Pricing Analysis
14.2.2. Market Share Analysis, 2021
14.2.2.1. By Inductance Range
14.2.2.2. By Vehicle Type
14.2.2.3. By Sales Channel
14.3. Brazil
14.3.1. Pricing Analysis
14.3.2. Market Share Analysis, 2021
14.3.2.1. By Inductance Range
14.3.2.2. By Vehicle Type
14.3.2.3. By Sales Channel
14.4. Mexico
14.4.1. Pricing Analysis
14.4.2. Market Share Analysis, 2021
14.4.2.1. By Inductance Range
14.4.2.2. By Vehicle Type
14.4.2.3. By Sales Channel
14.5. Argentina
14.5.1. Pricing Analysis
14.5.2. Market Share Analysis, 2021
14.5.2.1. By Inductance Range
14.5.2.2. By Vehicle Type
14.5.2.3. By Sales Channel
14.6. Chile
14.6.1. Pricing Analysis
14.6.2. Market Share Analysis, 2021
14.6.2.1. By Inductance Range
14.6.2.2. By Vehicle Type
14.6.2.3. By Sales Channel
14.7. Peru
14.7.1. Pricing Analysis
14.7.2. Market Share Analysis, 2021
14.7.2.1. By Inductance Range
14.7.2.2. By Vehicle Type
14.7.2.3. By Sales Channel
14.8. Germany
14.8.1. Pricing Analysis
14.8.2. Market Share Analysis, 2021
14.8.2.1. By Inductance Range
14.8.2.2. By Vehicle Type
14.8.2.3. By Sales Channel
14.9. Italy
14.9.1. Pricing Analysis
14.9.2. Market Share Analysis, 2021
14.9.2.1. By Inductance Range
14.9.2.2. By Vehicle Type
14.9.2.3. By Sales Channel
14.10. France
14.10.1. Pricing Analysis
14.10.2. Market Share Analysis, 2021
14.10.2.1. By Inductance Range
14.10.2.2. By Vehicle Type
14.10.2.3. By Sales Channel
14.11. U.K.
14.11.1. Pricing Analysis
14.11.2. Market Share Analysis, 2021
14.11.2.1. By Inductance Range
14.11.2.2. By Vehicle Type
14.11.2.3. By Sales Channel
14.12. Spain
14.12.1. Pricing Analysis
14.12.2. Market Share Analysis, 2021
14.12.2.1. By Inductance Range
14.12.2.2. By Vehicle Type
14.12.2.3. By Sales Channel
14.13. Russia
14.13.1. Pricing Analysis
14.13.2. Market Share Analysis, 2021
14.13.2.1. By Inductance Range
14.13.2.2. By Vehicle Type
14.13.2.3. By Sales Channel
14.14. BENELUX
14.14.1. Pricing Analysis
14.14.2. Market Share Analysis, 2021
14.14.2.1. By Inductance Range
14.14.2.2. By Vehicle Type
14.14.2.3. By Sales Channel
14.15. China
14.15.1. Pricing Analysis
14.15.2. Market Share Analysis, 2021
14.15.2.1. By Inductance Range
14.15.2.2. By Vehicle Type
14.15.2.3. By Sales Channel
14.16. Japan
14.16.1. Pricing Analysis
14.16.2. Market Share Analysis, 2021
14.16.2.1. By Inductance Range
14.16.2.2. By Vehicle Type
14.16.2.3. By Sales Channel
14.17. South Korea
14.17.1. Pricing Analysis
14.17.2. Market Share Analysis, 2021
14.17.2.1. By Inductance Range
14.17.2.2. By Vehicle Type
14.17.2.3. By Sales Channel
14.18. GCC Countries
14.18.1. Pricing Analysis
14.18.2. Market Share Analysis, 2021
14.18.2.1. By Inductance Range
14.18.2.2. By Vehicle Type
14.18.2.3. By Sales Channel
14.19. South Africa
14.19.1. Pricing Analysis
14.19.2. Market Share Analysis, 2021
14.19.2.1. By Inductance Range
14.19.2.2. By Vehicle Type
14.19.2.3. By Sales Channel
14.20. Turkey
14.20.1. Pricing Analysis
14.20.2. Market Share Analysis, 2021
14.20.2.1. By Inductance Range
14.20.2.2. By Vehicle Type
14.20.2.3. By Sales Channel
15. Market Structure Analysis
15.1. Competition Dashboard
15.2. Competition Benchmarking
15.3. Market Share Analysis of Top Players
15.3.1. By Regional
15.3.2. By Inductance Range
15.3.3. By Vehicle Type
15.3.4. By Sales Channel
16. Competition Analysis
16.1. Competition Deep Dive
16.1.1. Mouser Electronics, Inc.
16.1.1.1. Overview
16.1.1.2. Product Portfolio
16.1.1.3. Profitability by Market Segments
16.1.1.4. Sales Footprint
16.1.1.5. Strategy Overview
16.1.1.5.1. Marketing Strategy
16.1.1.5.2. Product Strategy
16.1.1.5.3. Channel Strategy
16.1.2. Laird Technologies
16.1.2.1. Overview
16.1.2.2. Product Portfolio
16.1.2.3. Profitability by Market Segments
16.1.2.4. Sales Footprint
16.1.2.5. Strategy Overview
16.1.2.5.1. Marketing Strategy
16.1.2.5.2. Product Strategy
16.1.2.5.3. Channel Strategy
16.1.3. TDK Corporation
16.1.3.1. Overview
16.1.3.2. Product Portfolio
16.1.3.3. Profitability by Market Segments
16.1.3.4. Sales Footprint
16.1.3.5. Strategy Overview
16.1.3.5.1. Marketing Strategy
16.1.3.5.2. Product Strategy
16.1.3.5.3. Channel Strategy
16.1.4. Abracon
16.1.4.1. Overview
16.1.4.2. Product Portfolio
16.1.4.3. Profitability by Market Segments
16.1.4.4. Sales Footprint
16.1.4.5. Strategy Overview
16.1.4.5.1. Marketing Strategy
16.1.4.5.2. Product Strategy
16.1.4.5.3. Channel Strategy
16.1.5. TTI, Inc.
16.1.5.1. Overview
16.1.5.2. Product Portfolio
16.1.5.3. Profitability by Market Segments
16.1.5.4. Sales Footprint
16.1.5.5. Strategy Overview
16.1.5.5.1. Marketing Strategy
16.1.5.5.2. Product Strategy
16.1.5.5.3. Channel Strategy
16.1.6. Avnet, Inc.
16.1.6.1. Overview
16.1.6.2. Product Portfolio
16.1.6.3. Profitability by Market Segments
16.1.6.4. Sales Footprint
16.1.6.5. Strategy Overview
16.1.6.5.1. Marketing Strategy
16.1.6.5.2. Product Strategy
16.1.6.5.3. Channel Strategy
16.1.7. Vishay Intertechnology
16.1.7.1. Overview
16.1.7.2. Product Portfolio
16.1.7.3. Profitability by Market Segments
16.1.7.4. Sales Footprint
16.1.7.5. Strategy Overview
16.1.7.5.1. Marketing Strategy
16.1.7.5.2. Product Strategy
16.1.7.5.3. Channel Strategy
16.1.8. Bourns, Inc.
16.1.8.1. Overview
16.1.8.2. Product Portfolio
16.1.8.3. Profitability by Market Segments
16.1.8.4. Sales Footprint
16.1.8.5. Strategy Overview
16.1.8.5.1. Marketing Strategy
16.1.8.5.2. Product Strategy
16.1.8.5.3. Channel Strategy
16.1.9. Murata Manufacturing Co., Ltd.
16.1.9.1. Overview
16.1.9.2. Product Portfolio
16.1.9.3. Profitability by Market Segments
16.1.9.4. Sales Footprint
16.1.9.5. Strategy Overview
16.1.9.5.1. Marketing Strategy
16.1.9.5.2. Product Strategy
16.1.9.5.3. Channel Strategy
16.1.10. Viking Tech Corporation
16.1.10.1. Overview
16.1.10.2. Product Portfolio
16.1.10.3. Profitability by Market Segments
16.1.10.4. Sales Footprint
16.1.10.5. Strategy Overview
16.1.10.5.1. Marketing Strategy
16.1.10.5.2. Product Strategy
16.1.10.5.3. Channel Strategy
17. Assumptions & Acronyms Used
18. Research Methodology
Let us know your requirement to get
100% FREE customization
List of Tables
Table 1: Global Automotive Grade Inductors Market Value (US$ Mn) Forecast by Region, 2017-2032
Table 2: Global Automotive Grade Inductors Market Volume (Units) Forecast by Region, 2017-2032
Table 3: Global Automotive Grade Inductors Market Value (US$ Mn) Forecast by Inductance Range, 2017-2032
Table 4: Global Automotive Grade Inductors Market Volume (Units) Forecast by Inductance Range, 2017-2032
Table 5: Global Automotive Grade Inductors Market Value (US$ Mn) Forecast by Vehicle Type, 2017-2032
Table 6: Global Automotive Grade Inductors Market Volume (Units) Forecast by Vehicle Type, 2017-2032
Table 7: Global Automotive Grade Inductors Market Value (US$ Mn) Forecast by Sales Channel, 2017-2032
Table 8: Global Automotive Grade Inductors Market Volume (Units) Forecast by Sales Channel, 2017-2032
Table 9: North America Automotive Grade Inductors Market Value (US$ Mn) Forecast by Country, 2017-2032
Table 10: North America Automotive Grade Inductors Market Volume (Units) Forecast by Country, 2017-2032
Table 11: North America Automotive Grade Inductors Market Value (US$ Mn) Forecast by Inductance Range, 2017-2032
Table 12: North America Automotive Grade Inductors Market Volume (Units) Forecast by Inductance Range, 2017-2032
Table 13: North America Automotive Grade Inductors Market Value (US$ Mn) Forecast by Vehicle Type, 2017-2032
Table 14: North America Automotive Grade Inductors Market Volume (Units) Forecast by Vehicle Type, 2017-2032
Table 15: North America Automotive Grade Inductors Market Value (US$ Mn) Forecast by Sales Channel, 2017-2032
Table 16: North America Automotive Grade Inductors Market Volume (Units) Forecast by Sales Channel, 2017-2032
Table 17: Latin America Automotive Grade Inductors Market Value (US$ Mn) Forecast by Country, 2017-2032
Table 18: Latin America Automotive Grade Inductors Market Volume (Units) Forecast by Country, 2017-2032
Table 19: Latin America Automotive Grade Inductors Market Value (US$ Mn) Forecast by Inductance Range, 2017-2032
Table 20: Latin America Automotive Grade Inductors Market Volume (Units) Forecast by Inductance Range, 2017-2032
Table 21: Latin America Automotive Grade Inductors Market Value (US$ Mn) Forecast by Vehicle Type, 2017-2032
Table 22: Latin America Automotive Grade Inductors Market Volume (Units) Forecast by Vehicle Type, 2017-2032
Table 23: Latin America Automotive Grade Inductors Market Value (US$ Mn) Forecast by Sales Channel, 2017-2032
Table 24: Latin America Automotive Grade Inductors Market Volume (Units) Forecast by Sales Channel, 2017-2032
Table 25: Europe Automotive Grade Inductors Market Value (US$ Mn) Forecast by Country, 2017-2032
Table 26: Europe Automotive Grade Inductors Market Volume (Units) Forecast by Country, 2017-2032
Table 27: Europe Automotive Grade Inductors Market Value (US$ Mn) Forecast by Inductance Range, 2017-2032
Table 28: Europe Automotive Grade Inductors Market Volume (Units) Forecast by Inductance Range, 2017-2032
Table 29: Europe Automotive Grade Inductors Market Value (US$ Mn) Forecast by Vehicle Type, 2017-2032
Table 30: Europe Automotive Grade Inductors Market Volume (Units) Forecast by Vehicle Type, 2017-2032
Table 31: Europe Automotive Grade Inductors Market Value (US$ Mn) Forecast by Sales Channel, 2017-2032
Table 32: Europe Automotive Grade Inductors Market Volume (Units) Forecast by Sales Channel, 2017-2032
Table 33: Asia Pacific Automotive Grade Inductors Market Value (US$ Mn) Forecast by Country, 2017-2032
Table 34: Asia Pacific Automotive Grade Inductors Market Volume (Units) Forecast by Country, 2017-2032
Table 35: Asia Pacific Automotive Grade Inductors Market Value (US$ Mn) Forecast by Inductance Range, 2017-2032
Table 36: Asia Pacific Automotive Grade Inductors Market Volume (Units) Forecast by Inductance Range, 2017-2032
Table 37: Asia Pacific Automotive Grade Inductors Market Value (US$ Mn) Forecast by Vehicle Type, 2017-2032
Table 38: Asia Pacific Automotive Grade Inductors Market Volume (Units) Forecast by Vehicle Type, 2017-2032
Table 39: Asia Pacific Automotive Grade Inductors Market Value (US$ Mn) Forecast by Sales Channel, 2017-2032
Table 40: Asia Pacific Automotive Grade Inductors Market Volume (Units) Forecast by Sales Channel, 2017-2032
Table 41: Middle East and Africa Automotive Grade Inductors Market Value (US$ Mn) Forecast by Country, 2017-2032
Table 42: Middle East and Africa Automotive Grade Inductors Market Volume (Units) Forecast by Country, 2017-2032
Table 43: Middle East and Africa Automotive Grade Inductors Market Value (US$ Mn) Forecast by Inductance Range, 2017-2032
Table 44: Middle East and Africa Automotive Grade Inductors Market Volume (Units) Forecast by Inductance Range, 2017-2032
Table 45: Middle East and Africa Automotive Grade Inductors Market Value (US$ Mn) Forecast by Vehicle Type, 2017-2032
Table 46: Middle East and Africa Automotive Grade Inductors Market Volume (Units) Forecast by Vehicle Type, 2017-2032
Table 47: Middle East and Africa Automotive Grade Inductors Market Value (US$ Mn) Forecast by Sales Channel, 2017-2032
Table 48: Middle East and Africa Automotive Grade Inductors Market Volume (Units) Forecast by Sales Channel, 2017-2032
Find your sweet spots for generating winning opportunities in this market.
Talk to AnalystList of Charts
Figure 1: Global Automotive Grade Inductors Market Value (US$ Mn) by Inductance Range, 2022-2032
Figure 2: Global Automotive Grade Inductors Market Value (US$ Mn) by Vehicle Type, 2022-2032
Figure 3: Global Automotive Grade Inductors Market Value (US$ Mn) by Sales Channel, 2022-2032
Figure 4: Global Automotive Grade Inductors Market Value (US$ Mn) by Region, 2022-2032
Figure 5: Global Automotive Grade Inductors Market Value (US$ Mn) Analysis by Region, 2017-2032
Figure 6: Global Automotive Grade Inductors Market Volume (Units) Analysis by Region, 2017-2032
Figure 7: Global Automotive Grade Inductors Market Value Share (%) and BPS Analysis by Region, 2022-2032
Figure 8: Global Automotive Grade Inductors Market Y-o-Y Growth (%) Projections by Region, 2022-2032
Figure 9: Global Automotive Grade Inductors Market Value (US$ Mn) Analysis by Inductance Range, 2017-2032
Figure 10: Global Automotive Grade Inductors Market Volume (Units) Analysis by Inductance Range, 2017-2032
Figure 11: Global Automotive Grade Inductors Market Value Share (%) and BPS Analysis by Inductance Range, 2022-2032
Figure 12: Global Automotive Grade Inductors Market Y-o-Y Growth (%) Projections by Inductance Range, 2022-2032
Figure 13: Global Automotive Grade Inductors Market Value (US$ Mn) Analysis by Vehicle Type, 2017-2032
Figure 14: Global Automotive Grade Inductors Market Volume (Units) Analysis by Vehicle Type, 2017-2032
Figure 15: Global Automotive Grade Inductors Market Value Share (%) and BPS Analysis by Vehicle Type, 2022-2032
Figure 16: Global Automotive Grade Inductors Market Y-o-Y Growth (%) Projections by Vehicle Type, 2022-2032
Figure 17: Global Automotive Grade Inductors Market Value (US$ Mn) Analysis by Sales Channel, 2017-2032
Figure 18: Global Automotive Grade Inductors Market Volume (Units) Analysis by Sales Channel, 2017-2032
Figure 19: Global Automotive Grade Inductors Market Value Share (%) and BPS Analysis by Sales Channel, 2022-2032
Figure 20: Global Automotive Grade Inductors Market Y-o-Y Growth (%) Projections by Sales Channel, 2022-2032
Figure 21: Global Automotive Grade Inductors Market Attractiveness by Inductance Range, 2022-2032
Figure 22: Global Automotive Grade Inductors Market Attractiveness by Vehicle Type, 2022-2032
Figure 23: Global Automotive Grade Inductors Market Attractiveness by Sales Channel, 2022-2032
Figure 24: Global Automotive Grade Inductors Market Attractiveness by Region, 2022-2032
Figure 25: North America Automotive Grade Inductors Market Value (US$ Mn) by Inductance Range, 2022-2032
Figure 26: North America Automotive Grade Inductors Market Value (US$ Mn) by Vehicle Type, 2022-2032
Figure 27: North America Automotive Grade Inductors Market Value (US$ Mn) by Sales Channel, 2022-2032
Figure 28: North America Automotive Grade Inductors Market Value (US$ Mn) by Country, 2022-2032
Figure 29: North America Automotive Grade Inductors Market Value (US$ Mn) Analysis by Country, 2017-2032
Figure 30: North America Automotive Grade Inductors Market Volume (Units) Analysis by Country, 2017-2032
Figure 31: North America Automotive Grade Inductors Market Value Share (%) and BPS Analysis by Country, 2022-2032
Figure 32: North America Automotive Grade Inductors Market Y-o-Y Growth (%) Projections by Country, 2022-2032
Figure 33: North America Automotive Grade Inductors Market Value (US$ Mn) Analysis by Inductance Range, 2017-2032
Figure 34: North America Automotive Grade Inductors Market Volume (Units) Analysis by Inductance Range, 2017-2032
Figure 35: North America Automotive Grade Inductors Market Value Share (%) and BPS Analysis by Inductance Range, 2022-2032
Figure 36: North America Automotive Grade Inductors Market Y-o-Y Growth (%) Projections by Inductance Range, 2022-2032
Figure 37: North America Automotive Grade Inductors Market Value (US$ Mn) Analysis by Vehicle Type, 2017-2032
Figure 38: North America Automotive Grade Inductors Market Volume (Units) Analysis by Vehicle Type, 2017-2032
Figure 39: North America Automotive Grade Inductors Market Value Share (%) and BPS Analysis by Vehicle Type, 2022-2032
Figure 40: North America Automotive Grade Inductors Market Y-o-Y Growth (%) Projections by Vehicle Type, 2022-2032
Figure 41: North America Automotive Grade Inductors Market Value (US$ Mn) Analysis by Sales Channel, 2017-2032
Figure 42: North America Automotive Grade Inductors Market Volume (Units) Analysis by Sales Channel, 2017-2032
Figure 43: North America Automotive Grade Inductors Market Value Share (%) and BPS Analysis by Sales Channel, 2022-2032
Figure 44: North America Automotive Grade Inductors Market Y-o-Y Growth (%) Projections by Sales Channel, 2022-2032
Figure 45: North America Automotive Grade Inductors Market Attractiveness by Inductance Range, 2022-2032
Figure 46: North America Automotive Grade Inductors Market Attractiveness by Vehicle Type, 2022-2032
Figure 47: North America Automotive Grade Inductors Market Attractiveness by Sales Channel, 2022-2032
Figure 48: North America Automotive Grade Inductors Market Attractiveness by Country, 2022-2032
Figure 49: Latin America Automotive Grade Inductors Market Value (US$ Mn) by Inductance Range, 2022-2032
Figure 50: Latin America Automotive Grade Inductors Market Value (US$ Mn) by Vehicle Type, 2022-2032
Figure 51: Latin America Automotive Grade Inductors Market Value (US$ Mn) by Sales Channel, 2022-2032
Figure 52: Latin America Automotive Grade Inductors Market Value (US$ Mn) by Country, 2022-2032
Figure 53: Latin America Automotive Grade Inductors Market Value (US$ Mn) Analysis by Country, 2017-2032
Figure 54: Latin America Automotive Grade Inductors Market Volume (Units) Analysis by Country, 2017-2032
Figure 55: Latin America Automotive Grade Inductors Market Value Share (%) and BPS Analysis by Country, 2022-2032
Figure 56: Latin America Automotive Grade Inductors Market Y-o-Y Growth (%) Projections by Country, 2022-2032
Figure 57: Latin America Automotive Grade Inductors Market Value (US$ Mn) Analysis by Inductance Range, 2017-2032
Figure 58: Latin America Automotive Grade Inductors Market Volume (Units) Analysis by Inductance Range, 2017-2032
Figure 59: Latin America Automotive Grade Inductors Market Value Share (%) and BPS Analysis by Inductance Range, 2022-2032
Figure 60: Latin America Automotive Grade Inductors Market Y-o-Y Growth (%) Projections by Inductance Range, 2022-2032
Figure 61: Latin America Automotive Grade Inductors Market Value (US$ Mn) Analysis by Vehicle Type, 2017-2032
Figure 62: Latin America Automotive Grade Inductors Market Volume (Units) Analysis by Vehicle Type, 2017-2032
Figure 63: Latin America Automotive Grade Inductors Market Value Share (%) and BPS Analysis by Vehicle Type, 2022-2032
Figure 64: Latin America Automotive Grade Inductors Market Y-o-Y Growth (%) Projections by Vehicle Type, 2022-2032
Figure 65: Latin America Automotive Grade Inductors Market Value (US$ Mn) Analysis by Sales Channel, 2017-2032
Figure 66: Latin America Automotive Grade Inductors Market Volume (Units) Analysis by Sales Channel, 2017-2032
Figure 67: Latin America Automotive Grade Inductors Market Value Share (%) and BPS Analysis by Sales Channel, 2022-2032
Figure 68: Latin America Automotive Grade Inductors Market Y-o-Y Growth (%) Projections by Sales Channel, 2022-2032
Figure 69: Latin America Automotive Grade Inductors Market Attractiveness by Inductance Range, 2022-2032
Figure 70: Latin America Automotive Grade Inductors Market Attractiveness by Vehicle Type, 2022-2032
Figure 71: Latin America Automotive Grade Inductors Market Attractiveness by Sales Channel, 2022-2032
Figure 72: Latin America Automotive Grade Inductors Market Attractiveness by Country, 2022-2032
Figure 73: Europe Automotive Grade Inductors Market Value (US$ Mn) by Inductance Range, 2022-2032
Figure 74: Europe Automotive Grade Inductors Market Value (US$ Mn) by Vehicle Type, 2022-2032
Figure 75: Europe Automotive Grade Inductors Market Value (US$ Mn) by Sales Channel, 2022-2032
Figure 76: Europe Automotive Grade Inductors Market Value (US$ Mn) by Country, 2022-2032
Figure 77: Europe Automotive Grade Inductors Market Value (US$ Mn) Analysis by Country, 2017-2032
Figure 78: Europe Automotive Grade Inductors Market Volume (Units) Analysis by Country, 2017-2032
Figure 79: Europe Automotive Grade Inductors Market Value Share (%) and BPS Analysis by Country, 2022-2032
Figure 80: Europe Automotive Grade Inductors Market Y-o-Y Growth (%) Projections by Country, 2022-2032
Figure 81: Europe Automotive Grade Inductors Market Value (US$ Mn) Analysis by Inductance Range, 2017-2032
Figure 82: Europe Automotive Grade Inductors Market Volume (Units) Analysis by Inductance Range, 2017-2032
Figure 83: Europe Automotive Grade Inductors Market Value Share (%) and BPS Analysis by Inductance Range, 2022-2032
Figure 84: Europe Automotive Grade Inductors Market Y-o-Y Growth (%) Projections by Inductance Range, 2022-2032
Figure 85: Europe Automotive Grade Inductors Market Value (US$ Mn) Analysis by Vehicle Type, 2017-2032
Figure 86: Europe Automotive Grade Inductors Market Volume (Units) Analysis by Vehicle Type, 2017-2032
Figure 87: Europe Automotive Grade Inductors Market Value Share (%) and BPS Analysis by Vehicle Type, 2022-2032
Figure 88: Europe Automotive Grade Inductors Market Y-o-Y Growth (%) Projections by Vehicle Type, 2022-2032
Figure 89: Europe Automotive Grade Inductors Market Value (US$ Mn) Analysis by Sales Channel, 2017-2032
Figure 90: Europe Automotive Grade Inductors Market Volume (Units) Analysis by Sales Channel, 2017-2032
Figure 91: Europe Automotive Grade Inductors Market Value Share (%) and BPS Analysis by Sales Channel, 2022-2032
Figure 92: Europe Automotive Grade Inductors Market Y-o-Y Growth (%) Projections by Sales Channel, 2022-2032
Figure 93: Europe Automotive Grade Inductors Market Attractiveness by Inductance Range, 2022-2032
Figure 94: Europe Automotive Grade Inductors Market Attractiveness by Vehicle Type, 2022-2032
Figure 95: Europe Automotive Grade Inductors Market Attractiveness by Sales Channel, 2022-2032
Figure 96: Europe Automotive Grade Inductors Market Attractiveness by Country, 2022-2032
Figure 97: Asia Pacific Automotive Grade Inductors Market Value (US$ Mn) by Inductance Range, 2022-2032
Figure 98: Asia Pacific Automotive Grade Inductors Market Value (US$ Mn) by Vehicle Type, 2022-2032
Figure 99: Asia Pacific Automotive Grade Inductors Market Value (US$ Mn) by Sales Channel, 2022-2032
Figure 100: Asia Pacific Automotive Grade Inductors Market Value (US$ Mn) by Country, 2022-2032
Figure 101: Asia Pacific Automotive Grade Inductors Market Value (US$ Mn) Analysis by Country, 2017-2032
Figure 102: Asia Pacific Automotive Grade Inductors Market Volume (Units) Analysis by Country, 2017-2032
Figure 103: Asia Pacific Automotive Grade Inductors Market Value Share (%) and BPS Analysis by Country, 2022-2032
Figure 104: Asia Pacific Automotive Grade Inductors Market Y-o-Y Growth (%) Projections by Country, 2022-2032
Figure 105: Asia Pacific Automotive Grade Inductors Market Value (US$ Mn) Analysis by Inductance Range, 2017-2032
Figure 106: Asia Pacific Automotive Grade Inductors Market Volume (Units) Analysis by Inductance Range, 2017-2032
Figure 107: Asia Pacific Automotive Grade Inductors Market Value Share (%) and BPS Analysis by Inductance Range, 2022-2032
Figure 108: Asia Pacific Automotive Grade Inductors Market Y-o-Y Growth (%) Projections by Inductance Range, 2022-2032
Figure 109: Asia Pacific Automotive Grade Inductors Market Value (US$ Mn) Analysis by Vehicle Type, 2017-2032
Figure 110: Asia Pacific Automotive Grade Inductors Market Volume (Units) Analysis by Vehicle Type, 2017-2032
Figure 111: Asia Pacific Automotive Grade Inductors Market Value Share (%) and BPS Analysis by Vehicle Type, 2022-2032
Figure 112: Asia Pacific Automotive Grade Inductors Market Y-o-Y Growth (%) Projections by Vehicle Type, 2022-2032
Figure 113: Asia Pacific Automotive Grade Inductors Market Value (US$ Mn) Analysis by Sales Channel, 2017-2032
Figure 114: Asia Pacific Automotive Grade Inductors Market Volume (Units) Analysis by Sales Channel, 2017-2032
Figure 115: Asia Pacific Automotive Grade Inductors Market Value Share (%) and BPS Analysis by Sales Channel, 2022-2032
Figure 116: Asia Pacific Automotive Grade Inductors Market Y-o-Y Growth (%) Projections by Sales Channel, 2022-2032
Figure 117: Asia Pacific Automotive Grade Inductors Market Attractiveness by Inductance Range, 2022-2032
Figure 118: Asia Pacific Automotive Grade Inductors Market Attractiveness by Vehicle Type, 2022-2032
Figure 119: Asia Pacific Automotive Grade Inductors Market Attractiveness by Sales Channel, 2022-2032
Figure 120: Asia Pacific Automotive Grade Inductors Market Attractiveness by Country, 2022-2032
Figure 121: Middle East and Africa Automotive Grade Inductors Market Value (US$ Mn) by Inductance Range, 2022-2032
Figure 122: Middle East and Africa Automotive Grade Inductors Market Value (US$ Mn) by Vehicle Type, 2022-2032
Figure 123: Middle East and Africa Automotive Grade Inductors Market Value (US$ Mn) by Sales Channel, 2022-2032
Figure 124: Middle East and Africa Automotive Grade Inductors Market Value (US$ Mn) by Country, 2022-2032
Figure 125: Middle East and Africa Automotive Grade Inductors Market Value (US$ Mn) Analysis by Country, 2017-2032
Figure 126: Middle East and Africa Automotive Grade Inductors Market Volume (Units) Analysis by Country, 2017-2032
Figure 127: Middle East and Africa Automotive Grade Inductors Market Value Share (%) and BPS Analysis by Country, 2022-2032
Figure 128: Middle East and Africa Automotive Grade Inductors Market Y-o-Y Growth (%) Projections by Country, 2022-2032
Figure 129: Middle East and Africa Automotive Grade Inductors Market Value (US$ Mn) Analysis by Inductance Range, 2017-2032
Figure 130: Middle East and Africa Automotive Grade Inductors Market Volume (Units) Analysis by Inductance Range, 2017-2032
Figure 131: Middle East and Africa Automotive Grade Inductors Market Value Share (%) and BPS Analysis by Inductance Range, 2022-2032
Figure 132: Middle East and Africa Automotive Grade Inductors Market Y-o-Y Growth (%) Projections by Inductance Range, 2022-2032
Figure 133: Middle East and Africa Automotive Grade Inductors Market Value (US$ Mn) Analysis by Vehicle Type, 2017-2032
Figure 134: Middle East and Africa Automotive Grade Inductors Market Volume (Units) Analysis by Vehicle Type, 2017-2032
Figure 135: Middle East and Africa Automotive Grade Inductors Market Value Share (%) and BPS Analysis by Vehicle Type, 2022-2032
Figure 136: Middle East and Africa Automotive Grade Inductors Market Y-o-Y Growth (%) Projections by Vehicle Type, 2022-2032
Figure 137: Middle East and Africa Automotive Grade Inductors Market Value (US$ Mn) Analysis by Sales Channel, 2017-2032
Figure 138: Middle East and Africa Automotive Grade Inductors Market Volume (Units) Analysis by Sales Channel, 2017-2032
Figure 139: Middle East and Africa Automotive Grade Inductors Market Value Share (%) and BPS Analysis by Sales Channel, 2022-2032
Figure 140: Middle East and Africa Automotive Grade Inductors Market Y-o-Y Growth (%) Projections by Sales Channel, 2022-2032
Figure 141: Middle East and Africa Automotive Grade Inductors Market Attractiveness by Inductance Range, 2022-2032
Figure 142: Middle East and Africa Automotive Grade Inductors Market Attractiveness by Vehicle Type, 2022-2032
Figure 143: Middle East and Africa Automotive Grade Inductors Market Attractiveness by Sales Channel, 2022-2032
Figure 144: Middle East and Africa Automotive Grade Inductors Market Attractiveness by Country, 2022-2032
Need specific information?
Request CustomizationExplore Automotive Insights
View Reports