Reports
- Global Locations -
Headquarters
Future Market Insights, Inc.
Christiana Corporate, 200
Continental Drive, Suite 401,
Newark, Delaware - 19713,
United States
Americas
Future Market Insights, Inc.
616 Corporate Way, Suite 2-9018,
Valley Cottage, NY 10989, United States
MEA
Future Market Insights
1602-6 Jumeirah Bay X2 Tower, Plot No: JLT-PH2-X2A,
Jumeirah Lakes Towers, Dubai,
United Arab Emirates
Europe
Future Market Insights
3rd Floor, 207 Regent Street,
W1B 3HH London
United Kingdom
Asia Pacific
Future Market Insights
Office No. 401-A, 4th Floor,
VANTAGE 9, S.No. 36/1/1,
Baner, Pune 411045, India
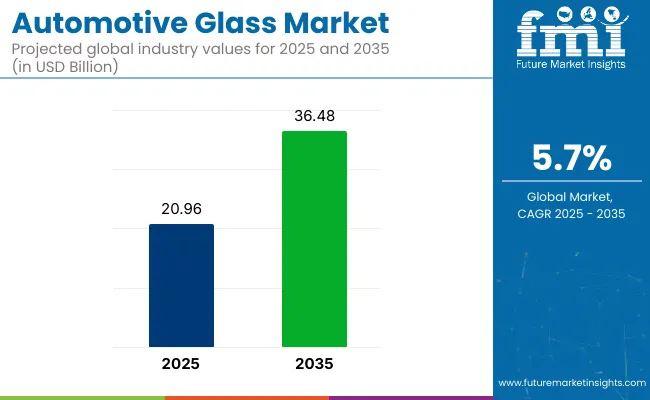
The FMI anticipates that the automotive glass market is estimated to capture a valuation of US$ 3.85 billion in 2023 and is projected to rise to US$ 5.70 billion by 2033. The market is registering a CAGR of 4% during the forecast period.
Several driving factors contribute to the growth and development of the automotive glass market. These significant factors include:
Don't pay for what you don't need
Customize your report by selecting specific countries or regions and save 30%!
Apart from driving factors, the market has a few declining factors that may limit growth. These are:
Attributes | Details |
---|---|
Market CAGR (2023 to 2033) | 4% |
Market Valuation (2023) | US$ 3.85 billion |
Market Valuation (2033) | US$ 5.70 billion |
According to Future Market Insights, the global automotive glass market registered a healthy 4% CAGR during the forecast period. Historically, the market captured a CAGR of 4% between 2018 and 2022.
One of the significant trends in the market during this period was the increasing demand for lightweight glass to reduce the overall weight of vehicles. Laminated glass became increasingly popular during this period due to its safety features, such as improved impact resistance and reduced risk of shattering upon impact.
The automotive glass industry continued to witness significant technological advancements, including developing smart glass, self-healing glass, and solar control glass.
Governments and consumers continued to focus on automotive safety during this period, leading to increased demand for shatterproof, tempered, and laminated glass. The prices of raw materials, such as silica and soda ash, used in producing automotive glass, fluctuated during this period. However, changes in supply and demand impacted the overall cost of production.
Automotive Glass Market:
Attributes | Automotive Glass Market |
---|---|
CAGR (2023 to 2033) | 4% |
Value (2023) | US$ 3.85 billion |
Value (2033) | US$ 5.70 billion |
Trends | Rising demand for passenger safety, the automotive industry, visibility, and comfort fuel the market size. |
Opportunities | Rising government initiatives, market players, and research & development activities. |
Automotive Aftermarket Glass Market:
Attributes | Automotive Aftermarket Glass Market |
---|---|
CAGR (2023 to 2033) | 3.8% |
Value (2023) | US$ 3.60 billion |
Value (2033) | US$ 5.23 billion |
Trends | The rising popularity of high vehicle production, the large number of millennials, and the growing automotive sector are driving market growth. |
Opportunities | Growing new technologies, research & development activities, and innovation of products are propelling market opportunities. |
Automotive Windshield Market:
Attributes | Automotive Windshield Market |
---|---|
CAGR (2023 to 2033) | 6.5% |
Value (2023) | US$ 17.68 billion |
Value (2033) | US$ 33.19 billion |
Trends | The growing manufacturing sector, advanced technology, and innovation of smart windshields are driving market growth. |
Opportunities | Rising huge investments, government initiatives, key players, and research & development activities are propelling the market |
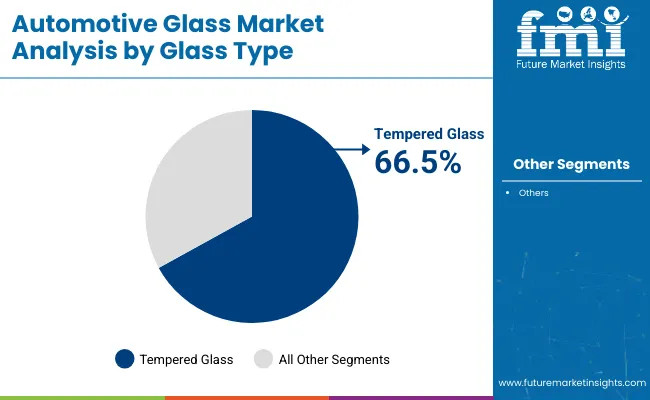
Based on glass type, the laminated glass category dominates the automotive glass market. Laminated glass is made by sandwiching a layer of polyvinyl butyral (P.V.B.) between two layers of glass, which makes it durable and safe.
Laminated glass is commonly used in windshields and side windows of modern vehicles due to its ability to hold together even after being shattered. It reduces the risk of injury to passengers in an accident. Laminated glass offers additional benefits such as noise reduction, U.V. protection, and improved insulation.
The automotive industry has grown in demand for laminated glass in recent years due to increasing safety concerns and strict regulations. Additionally, technological advancements have made it possible to produce thin and light laminated glass, making it attractive.
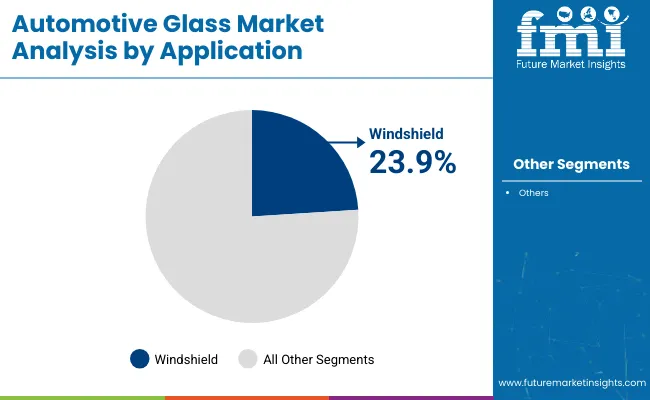
Based on application, the windshield segment is leading the automotive glass market. Windshields are a crucial safety feature in vehicles, protecting drivers and passengers from external elements and reducing the risk of injury.
Windshields are primarily made of laminated glass, which provide high safety and durability than tempered glass. Modern windshields offer several other benefits, such as sound insulation, U.V. protection, and advanced technologies such as a heads-up display (H.U.D.) and rain sensors.
The increasing demand for safety and advanced features in windshields is expected to drive the growth of the windshield segment in the market.
A few other automotive glass applications include side windows, back windows, and mirrors, which also play a critical role in the safety and functionality of vehicles. However, the windshield segment is leading the market, driven by the increasing demand for safety and advanced vehicle features.
Based on the sales channel, the O.E.M. (original equipment manufacturer) segment is leading the automotive glass market. O.E.M. automotive glass is installed in vehicles during manufacturing and meets the strict quality and safety standards set by vehicle manufacturers.
Consumers typically prefer O.E.M. automotive glass due to its high quality, durability, and perfect fit with the vehicle's design and specifications. Additionally, O.E.M. glass often comes with a warranty, providing consumers with added assurance and protection.
The aftermarket segment includes replacement glass sold to repair shops and consumers for vehicle repair and maintenance. However, the O.E.M. segment is currently leading the market, driven by the increasing demand for safety and quality in automotive glass. The growing adoption of advanced technologies in vehicles is fueling the market size.
Overall, the O.E.M. segment is expected to continue dominating the market in the coming years, driven by the increasing high-quality and durable automotive glass among consumers.
Get the data you need at a Fraction of the cost
Personalize your report by choosing insights you need
and save 40%!
The United States automotive glass market is significant and mature, driven by many vehicles on the road. The strict safety standards that the government and key marketers set are advancing the United States market. A few key facts and trends regarding the United States market:
China automotive glass market is a significant and rapidly growing market, driven by the country's large and expanding automotive industry. Here are some key facts and trends regarding China market:
China market was valued at over US$ 8 billion in 2020 and is expected to continue growing in the coming years, driven by increasing vehicle production and the growing demand for safety glass.
China is the world's leading producer of automobiles, with over 28 million vehicles produced in 2020. The increasing vehicle production in the country is driving the growth of the market, with each vehicle requiring several pieces of glass. The government's focus on vehicle safety and the growing awareness of the benefits of safety glass among consumers fuel the market growth further.
China market has been witnessing the growing adoption of advanced technologies, such as H.U.D., ADAS, and smart glass, which enhance the safety and functionality of vehicles. China automotive glass market is highly competitive, with many local and international players competing for market share.
The United Kingdom market is a competitive and growing industry. The demand for vehicle repair and replacement services primarily drives it. The market includes windshields, side windows, and rear windows for automobiles, buses, trucks, and other commercial vehicles.
The United Kingdom market was valued at almost £400 million in 2019 and was expected to hold a CAGR of around 4% between 2020 and 2025. This growth is attributed to the country's increasing number of vehicle registrations, rising demand for safety features, and advancements in technology, such as smart and self-healing glass.
The key players in the United Kingdom market include Pilkington Automotive Limited, A.G.C. Automotive Europe, and Saint-Gobain Sekurit. These companies have a significant market share and constantly invest in research and development to enhance their products and services.
The automotive glass market is highly competitive, with several global players competing for market share. The key players in the industry include Pilkington Automotive Limited, A.G.C. Automotive Europe, Nippon Sheet Glass Co. Ltd., and Fuyao Glass Industry Group Co. Ltd.
Recent Developments in the Global Market:
Attribute | Details |
---|---|
Forecast Period | 2023 to 2033 |
Historical Data Available for | 2017 to 2022 |
Market Analysis | US$ billion for Value |
Key Countries Covered | The United States, Canada, Germany, The United Kingdom, France, Italy, Spain, Russia, China, Japan, South Korea, India, Thailand, Malaysia, Indonesia, Australia, New Zealand, GCC Countries, Türkiye, Northern Africa, and South Africa |
Key Segments Covered |
|
Key Companies Profiled |
|
Report Coverage | Market Forecast, Company Share Analysis, Competition Intelligence, DROT Analysis, Market Dynamics and Challenges, and Strategic Growth Initiatives |
Customization & Pricing | Available upon Request |
1. Executive Summary | Automotive Glass Market 1.1. Global Market Outlook 1.2. Demand-side Trends 1.3. Supply-side Trends 1.4. Technology Roadmap Analysis 1.5. Analysis and Recommendations 2. Market Overview 2.1. Market Coverage / Taxonomy 2.2. Market Definition / Scope / Limitations 3. Market Background 3.1. Market Dynamics 3.1.1. Drivers 3.1.2. Restraints 3.1.3. Opportunity 3.1.4. Trends 3.2. Scenario Forecast 3.2.1. Demand in Optimistic Scenario 3.2.2. Demand in Likely Scenario 3.2.3. Demand in Conservative Scenario 3.3. Opportunity Map Analysis 3.4. Product Life Cycle Analysis 3.5. Supply Chain Analysis 3.5.1. Supply Side Participants and their Roles 3.5.1.1. Producers 3.5.1.2. Mid-Level Participants (Traders/ Agents/ Brokers) 3.5.1.3. Wholesalers and Distributors 3.5.2. Value Added and Value Created at Node in the Supply Chain 3.5.3. List of Raw Material Suppliers 3.5.4. List of Existing and Potential Buyers 3.6. Investment Feasibility Matrix 3.7. Value Chain Analysis 3.7.1. Profit Margin Analysis 3.7.2. Wholesalers and Distributors 3.7.3. Retailers 3.8. PESTLE and Porter’s Analysis 3.9. Regulatory Landscape 3.9.1. By Key Regions 3.9.2. By Key Countries 3.10. Regional Parent Market Outlook 3.11. Production and Consumption Statistics 3.12. Import and Export Statistics 4. Global Market Analysis 2018 to 2022 and Forecast, 2023 to 2033 4.1. Historical Market Size Value (US$ Million) & Volume (Units) Analysis, 2018-2022 4.2. Current and Future Market Size Value (US$ Million) & Volume (Units) Projections, 2023 to 2033 4.2.1. Y-o-Y Growth Trend Analysis 4.2.2. Absolute $ Opportunity Analysis 5. Global Market Analysis 2018 to 2022 and Forecast 2023 to 2033, By Glass Type 5.1. Introduction / Key Findings 5.2. Historical Market Size Value (US$ Million) & Volume (Units) Analysis By Glass Type, 2018-2022 5.3. Current and Future Market Size Value (US$ Million) & Volume (Units) Analysis and Forecast By Glass Type, 2023 to 2033 5.3.1. Laminated Glass 5.3.2. Tempered Glass 5.4. Y-o-Y Growth Trend Analysis By Glass Type, 2018-2022 5.5. Absolute $ Opportunity Analysis By Glass Type, 2023 to 2033 6. Global Market Analysis 2018 to 2022 and Forecast 2023 to 2033, By Application 6.1. Introduction / Key Findings 6.2. Historical Market Size Value (US$ Million) & Volume (Units) Analysis By Application, 2018-2022 6.3. Current and Future Market Size Value (US$ Million) & Volume (Units) Analysis and Forecast By Application, 2023 to 2033 6.3.1. Windshield 6.3.2. Back Glass 6.3.3. Door Glass 6.3.4. Quarter Glass 6.3.5. Vent Glass 6.3.6. Moon/Sun Roof 6.4. Y-o-Y Growth Trend Analysis By Application, 2018-2022 6.5. Absolute $ Opportunity Analysis By Application, 2023 to 2033 7. Global Market Analysis 2018 to 2022 and Forecast 2023 to 2033, By Vehicle Type 7.1. Introduction / Key Findings 7.2. Historical Market Size Value (US$ Million) & Volume (Units) Analysis By Vehicle Type, 2018-2022 7.3. Current and Future Market Size Value (US$ Million) & Volume (Units) Analysis and Forecast By Vehicle Type, 2023 to 2033 7.3.1. Passenger Vehicles 7.3.2. Light Commercial Vehicles 7.3.3. Heavy Commercial Vehicles 7.3.4. Electric Vehicles 7.4. Y-o-Y Growth Trend Analysis By Vehicle Type, 2018-2022 7.5. Absolute $ Opportunity Analysis By Vehicle Type, 2023 to 2033 8. Global Market Analysis 2018 to 2022 and Forecast 2023 to 2033, By Sales Channel 8.1. Introduction / Key Findings 8.2. Historical Market Size Value (US$ Million) & Volume (Units) Analysis By Sales Channel, 2018-2022 8.3. Current and Future Market Size Value (US$ Million) & Volume (Units) Analysis and Forecast By Sales Channel, 2023 to 2033 8.3.1. OEM 8.3.2. Aftermarket 8.4. Y-o-Y Growth Trend Analysis By Sales Channel, 2018-2022 8.5. Absolute $ Opportunity Analysis By Sales Channel, 2023 to 2033 9. Global Market Analysis 2018 to 2022 and Forecast 2023 to 2033, By Region 9.1. Introduction 9.2. Historical Market Size Value (US$ Million) & Volume (Units) Analysis By Region, 2018-2022 9.3. Current Market Size Value (US$ Million) & Volume (Units) Analysis and Forecast By Region, 2023 to 2033 9.3.1. North America 9.3.2. Latin America 9.3.3. Europe 9.3.4. Asia Pacific 9.3.5. MEA 9.4. Market Attractiveness Analysis By Region 10. North America Market Analysis 2018 to 2022 and Forecast 2023 to 2033, By Country 10.1. Historical Market Size Value (US$ Million) & Volume (Units) Trend Analysis By Market Taxonomy, 2018-2022 10.2. Market Size Value (US$ Million) & Volume (Units) Forecast By Market Taxonomy, 2023 to 2033 10.2.1. By Country 10.2.1.1. USA 10.2.1.2. Canada 10.2.2. By Glass Type 10.2.3. By Application 10.2.4. By Vehicle Type 10.2.5. By Sales Channel 10.3. Market Attractiveness Analysis 10.3.1. By Country 10.3.2. By Glass Type 10.3.3. By Application 10.3.4. By Vehicle Type 10.3.5. By Sales Channel 10.4. Key Takeaways 11. Latin America Market Analysis 2018 to 2022 and Forecast 2023 to 2033, By Country 11.1. Historical Market Size Value (US$ Million) & Volume (Units) Trend Analysis By Market Taxonomy, 2018-2022 11.2. Market Size Value (US$ Million) & Volume (Units) Forecast By Market Taxonomy, 2023 to 2033 11.2.1. By Country 11.2.1.1. Brazil 11.2.1.2. Mexico 11.2.1.3. Rest of Latin America 11.2.2. By Glass Type 11.2.3. By Application 11.2.4. By Vehicle Type 11.2.5. By Sales Channel 11.3. Market Attractiveness Analysis 11.3.1. By Country 11.3.2. By Glass Type 11.3.3. By Application 11.3.4. By Vehicle Type 11.3.5. By Sales Channel 11.4. Key Takeaways 12. Europe Market Analysis 2018 to 2022 and Forecast 2023 to 2033, By Country 12.1. Historical Market Size Value (US$ Million) & Volume (Units) Trend Analysis By Market Taxonomy, 2018-2022 12.2. Market Size Value (US$ Million) & Volume (Units) Forecast By Market Taxonomy, 2023 to 2033 12.2.1. By Country 12.2.1.1. Germany 12.2.1.2. UNITED KINGDOM 12.2.1.3. France 12.2.1.4. Spain 12.2.1.5. Italy 12.2.1.6. Rest of Europe 12.2.2. By Glass Type 12.2.3. By Application 12.2.4. By Vehicle Type 12.2.5. By Sales Channel 12.3. Market Attractiveness Analysis 12.3.1. By Country 12.3.2. By Glass Type 12.3.3. By Application 12.3.4. By Vehicle Type 12.3.5. By Sales Channel 12.4. Key Takeaways 13. Asia Pacific Market Analysis 2018 to 2022 and Forecast 2023 to 2033, By Country 13.1. Historical Market Size Value (US$ Million) & Volume (Units) Trend Analysis By Market Taxonomy, 2018-2022 13.2. Market Size Value (US$ Million) & Volume (Units) Forecast By Market Taxonomy, 2023 to 2033 13.2.1. By Country 13.2.1.1. China 13.2.1.2. Japan 13.2.1.3. South Korea 13.2.1.4. Singapore 13.2.1.5. Thailand 13.2.1.6. Indonesia 13.2.1.7. Australia 13.2.1.8. New Zealand 13.2.1.9. Rest of Asia Pacific 13.2.2. By Glass Type 13.2.3. By Application 13.2.4. By Vehicle Type 13.2.5. By Sales Channel 13.3. Market Attractiveness Analysis 13.3.1. By Country 13.3.2. By Glass Type 13.3.3. By Application 13.3.4. By Vehicle Type 13.3.5. By Sales Channel 13.4. Key Takeaways 14. MEA Market Analysis 2018 to 2022 and Forecast 2023 to 2033, By Country 14.1. Historical Market Size Value (US$ Million) & Volume (Units) Trend Analysis By Market Taxonomy, 2018-2022 14.2. Market Size Value (US$ Million) & Volume (Units) Forecast By Market Taxonomy, 2023 to 2033 14.2.1. By Country 14.2.1.1. GCC Countries 14.2.1.2. South Africa 14.2.1.3. Israel 14.2.1.4. Rest of MEA 14.2.2. By Glass Type 14.2.3. By Application 14.2.4. By Vehicle Type 14.2.5. By Sales Channel 14.3. Market Attractiveness Analysis 14.3.1. By Country 14.3.2. By Glass Type 14.3.3. By Application 14.3.4. By Vehicle Type 14.3.5. By Sales Channel 14.4. Key Takeaways 15. Key Countries Market Analysis 15.1. USA 15.1.1. Pricing Analysis 15.1.2. Market Share Analysis, 2022 15.1.2.1. By Glass Type 15.1.2.2. By Application 15.1.2.3. By Vehicle Type 15.1.2.4. By Sales Channel 15.2. Canada 15.2.1. Pricing Analysis 15.2.2. Market Share Analysis, 2022 15.2.2.1. By Glass Type 15.2.2.2. By Application 15.2.2.3. By Vehicle Type 15.2.2.4. By Sales Channel 15.3. Brazil 15.3.1. Pricing Analysis 15.3.2. Market Share Analysis, 2022 15.3.2.1. By Glass Type 15.3.2.2. By Application 15.3.2.3. By Vehicle Type 15.3.2.4. By Sales Channel 15.4. Mexico 15.4.1. Pricing Analysis 15.4.2. Market Share Analysis, 2022 15.4.2.1. By Glass Type 15.4.2.2. By Application 15.4.2.3. By Vehicle Type 15.4.2.4. By Sales Channel 15.5. Germany 15.5.1. Pricing Analysis 15.5.2. Market Share Analysis, 2022 15.5.2.1. By Glass Type 15.5.2.2. By Application 15.5.2.3. By Vehicle Type 15.5.2.4. By Sales Channel 15.6. UNITED KINGDOM 15.6.1. Pricing Analysis 15.6.2. Market Share Analysis, 2022 15.6.2.1. By Glass Type 15.6.2.2. By Application 15.6.2.3. By Vehicle Type 15.6.2.4. By Sales Channel 15.7. France 15.7.1. Pricing Analysis 15.7.2. Market Share Analysis, 2022 15.7.2.1. By Glass Type 15.7.2.2. By Application 15.7.2.3. By Vehicle Type 15.7.2.4. By Sales Channel 15.8. Spain 15.8.1. Pricing Analysis 15.8.2. Market Share Analysis, 2022 15.8.2.1. By Glass Type 15.8.2.2. By Application 15.8.2.3. By Vehicle Type 15.8.2.4. By Sales Channel 15.9. Italy 15.9.1. Pricing Analysis 15.9.2. Market Share Analysis, 2022 15.9.2.1. By Glass Type 15.9.2.2. By Application 15.9.2.3. By Vehicle Type 15.9.2.4. By Sales Channel 15.10. China 15.10.1. Pricing Analysis 15.10.2. Market Share Analysis, 2022 15.10.2.1. By Glass Type 15.10.2.2. By Application 15.10.2.3. By Vehicle Type 15.10.2.4. By Sales Channel 15.11. Japan 15.11.1. Pricing Analysis 15.11.2. Market Share Analysis, 2022 15.11.2.1. By Glass Type 15.11.2.2. By Application 15.11.2.3. By Vehicle Type 15.11.2.4. By Sales Channel 15.12. South Korea 15.12.1. Pricing Analysis 15.12.2. Market Share Analysis, 2022 15.12.2.1. By Glass Type 15.12.2.2. By Application 15.12.2.3. By Vehicle Type 15.12.2.4. By Sales Channel 15.13. Singapore 15.13.1. Pricing Analysis 15.13.2. Market Share Analysis, 2022 15.13.2.1. By Glass Type 15.13.2.2. By Application 15.13.2.3. By Vehicle Type 15.13.2.4. By Sales Channel 15.14. Thailand 15.14.1. Pricing Analysis 15.14.2. Market Share Analysis, 2022 15.14.2.1. By Glass Type 15.14.2.2. By Application 15.14.2.3. By Vehicle Type 15.14.2.4. By Sales Channel 15.15. Indonesia 15.15.1. Pricing Analysis 15.15.2. Market Share Analysis, 2022 15.15.2.1. By Glass Type 15.15.2.2. By Application 15.15.2.3. By Vehicle Type 15.15.2.4. By Sales Channel 15.16. Australia 15.16.1. Pricing Analysis 15.16.2. Market Share Analysis, 2022 15.16.2.1. By Glass Type 15.16.2.2. By Application 15.16.2.3. By Vehicle Type 15.16.2.4. By Sales Channel 15.17. New Zealand 15.17.1. Pricing Analysis 15.17.2. Market Share Analysis, 2022 15.17.2.1. By Glass Type 15.17.2.2. By Application 15.17.2.3. By Vehicle Type 15.17.2.4. By Sales Channel 15.18. GCC Countries 15.18.1. Pricing Analysis 15.18.2. Market Share Analysis, 2022 15.18.2.1. By Glass Type 15.18.2.2. By Application 15.18.2.3. By Vehicle Type 15.18.2.4. By Sales Channel 15.19. South Africa 15.19.1. Pricing Analysis 15.19.2. Market Share Analysis, 2022 15.19.2.1. By Glass Type 15.19.2.2. By Application 15.19.2.3. By Vehicle Type 15.19.2.4. By Sales Channel 15.20. Israel 15.20.1. Pricing Analysis 15.20.2. Market Share Analysis, 2022 15.20.2.1. By Glass Type 15.20.2.2. By Application 15.20.2.3. By Vehicle Type 15.20.2.4. By Sales Channel 16. Market Structure Analysis 16.1. Competition Dashboard 16.2. Competition Benchmarking 16.3. Market Share Analysis of Top Players 16.3.1. By Regional 16.3.2. By Glass Type 16.3.3. By Application 16.3.4. By Vehicle Type 16.3.5. By Sales Channel 17. Competition Analysis 17.1. Competition Deep Dive 17.1.1. Dura Automotive Systems 17.1.1.1. Overview 17.1.1.2. Product Portfolio 17.1.1.3. Profitability by Market Segments 17.1.1.4. Sales Footprint 17.1.1.5. Strategy Overview 17.1.1.5.1. Marketing Strategy 17.1.1.5.2. Product Strategy 17.1.1.5.3. Channel Strategy 17.1.2. Saint-Gobain S.A. 17.1.2.1. Overview 17.1.2.2. Product Portfolio 17.1.2.3. Profitability by Market Segments 17.1.2.4. Sales Footprint 17.1.2.5. Strategy Overview 17.1.2.5.1. Marketing Strategy 17.1.2.5.2. Product Strategy 17.1.2.5.3. Channel Strategy 17.1.3. Asahi Glass Co. Ltd. 17.1.3.1. Overview 17.1.3.2. Product Portfolio 17.1.3.3. Profitability by Market Segments 17.1.3.4. Sales Footprint 17.1.3.5. Strategy Overview 17.1.3.5.1. Marketing Strategy 17.1.3.5.2. Product Strategy 17.1.3.5.3. Channel Strategy 17.1.4. Fuyao Glass Industry Group Co. Ltd. 17.1.4.1. Overview 17.1.4.2. Product Portfolio 17.1.4.3. Profitability by Market Segments 17.1.4.4. Sales Footprint 17.1.4.5. Strategy Overview 17.1.4.5.1. Marketing Strategy 17.1.4.5.2. Product Strategy 17.1.4.5.3. Channel Strategy 17.1.5. Nippon Sheet Glass Co. Ltd. 17.1.5.1. Overview 17.1.5.2. Product Portfolio 17.1.5.3. Profitability by Market Segments 17.1.5.4. Sales Footprint 17.1.5.5. Strategy Overview 17.1.5.5.1. Marketing Strategy 17.1.5.5.2. Product Strategy 17.1.5.5.3. Channel Strategy 17.1.6. Xinyi Glass Holding Ltd. 17.1.6.1. Overview 17.1.6.2. Product Portfolio 17.1.6.3. Profitability by Market Segments 17.1.6.4. Sales Footprint 17.1.6.5. Strategy Overview 17.1.6.5.1. Marketing Strategy 17.1.6.5.2. Product Strategy 17.1.6.5.3. Channel Strategy 17.1.7. Central Glass Co. Ltd. 17.1.7.1. Overview 17.1.7.2. Product Portfolio 17.1.7.3. Profitability by Market Segments 17.1.7.4. Sales Footprint 17.1.7.5. Strategy Overview 17.1.7.5.1. Marketing Strategy 17.1.7.5.2. Product Strategy 17.1.7.5.3. Channel Strategy 17.1.8. Glas Trosch Holding AG 17.1.8.1. Overview 17.1.8.2. Product Portfolio 17.1.8.3. Profitability by Market Segments 17.1.8.4. Sales Footprint 17.1.8.5. Strategy Overview 17.1.8.5.1. Marketing Strategy 17.1.8.5.2. Product Strategy 17.1.8.5.3. Channel Strategy 17.1.9. Gentex Corporation 17.1.9.1. Overview 17.1.9.2. Product Portfolio 17.1.9.3. Profitability by Market Segments 17.1.9.4. Sales Footprint 17.1.9.5. Strategy Overview 17.1.9.5.1. Marketing Strategy 17.1.9.5.2. Product Strategy 17.1.9.5.3. Channel Strategy 17.1.10. Magna International Inc. 17.1.10.1. Overview 17.1.10.2. Product Portfolio 17.1.10.3. Profitability by Market Segments 17.1.10.4. Sales Footprint 17.1.10.5. Strategy Overview 17.1.10.5.1. Marketing Strategy 17.1.10.5.2. Product Strategy 17.1.10.5.3. Channel Strategy 17.1.11. Vitro S.A.B de C.V. 17.1.11.1. Overview 17.1.11.2. Product Portfolio 17.1.11.3. Profitability by Market Segments 17.1.11.4. Sales Footprint 17.1.11.5. Strategy Overview 17.1.11.5.1. Marketing Strategy 17.1.11.5.2. Product Strategy 17.1.11.5.3. Channel Strategy 17.1.12. Guardian Industries Corporation 17.1.12.1. Overview 17.1.12.2. Product Portfolio 17.1.12.3. Profitability by Market Segments 17.1.12.4. Sales Footprint 17.1.12.5. Strategy Overview 17.1.12.5.1. Marketing Strategy 17.1.12.5.2. Product Strategy 17.1.12.5.3. Channel Strategy 18. Assumptions & Acronyms Used 19. Research Methodology
Don't pay for what you don't need
Customize your report by selecting specific countries or regions and save 30%!
Table 1: Global Market Value (US$ Million) Forecast by Region, 2018 to 2033 Table 2: Global Market Volume (Units) Forecast by Region, 2018 to 2033 Table 3: Global Market Value (US$ Million) Forecast by Glass Type, 2018 to 2033 Table 4: Global Market Volume (Units) Forecast by Glass Type, 2018 to 2033 Table 5: Global Market Value (US$ Million) Forecast by Application, 2018 to 2033 Table 6: Global Market Volume (Units) Forecast by Application, 2018 to 2033 Table 7: Global Market Value (US$ Million) Forecast by Vehicle Type, 2018 to 2033 Table 8: Global Market Volume (Units) Forecast by Vehicle Type, 2018 to 2033 Table 9: Global Market Value (US$ Million) Forecast by Sales Channel, 2018 to 2033 Table 10: Global Market Volume (Units) Forecast by Sales Channel, 2018 to 2033 Table 11: North America Market Value (US$ Million) Forecast by Country, 2018 to 2033 Table 12: North America Market Volume (Units) Forecast by Country, 2018 to 2033 Table 13: North America Market Value (US$ Million) Forecast by Glass Type, 2018 to 2033 Table 14: North America Market Volume (Units) Forecast by Glass Type, 2018 to 2033 Table 15: North America Market Value (US$ Million) Forecast by Application, 2018 to 2033 Table 16: North America Market Volume (Units) Forecast by Application, 2018 to 2033 Table 17: North America Market Value (US$ Million) Forecast by Vehicle Type, 2018 to 2033 Table 18: North America Market Volume (Units) Forecast by Vehicle Type, 2018 to 2033 Table 19: North America Market Value (US$ Million) Forecast by Sales Channel, 2018 to 2033 Table 20: North America Market Volume (Units) Forecast by Sales Channel, 2018 to 2033 Table 21: Latin America Market Value (US$ Million) Forecast by Country, 2018 to 2033 Table 22: Latin America Market Volume (Units) Forecast by Country, 2018 to 2033 Table 23: Latin America Market Value (US$ Million) Forecast by Glass Type, 2018 to 2033 Table 24: Latin America Market Volume (Units) Forecast by Glass Type, 2018 to 2033 Table 25: Latin America Market Value (US$ Million) Forecast by Application, 2018 to 2033 Table 26: Latin America Market Volume (Units) Forecast by Application, 2018 to 2033 Table 27: Latin America Market Value (US$ Million) Forecast by Vehicle Type, 2018 to 2033 Table 28: Latin America Market Volume (Units) Forecast by Vehicle Type, 2018 to 2033 Table 29: Latin America Market Value (US$ Million) Forecast by Sales Channel, 2018 to 2033 Table 30: Latin America Market Volume (Units) Forecast by Sales Channel, 2018 to 2033 Table 31: Europe Market Value (US$ Million) Forecast by Country, 2018 to 2033 Table 32: Europe Market Volume (Units) Forecast by Country, 2018 to 2033 Table 33: Europe Market Value (US$ Million) Forecast by Glass Type, 2018 to 2033 Table 34: Europe Market Volume (Units) Forecast by Glass Type, 2018 to 2033 Table 35: Europe Market Value (US$ Million) Forecast by Application, 2018 to 2033 Table 36: Europe Market Volume (Units) Forecast by Application, 2018 to 2033 Table 37: Europe Market Value (US$ Million) Forecast by Vehicle Type, 2018 to 2033 Table 38: Europe Market Volume (Units) Forecast by Vehicle Type, 2018 to 2033 Table 39: Europe Market Value (US$ Million) Forecast by Sales Channel, 2018 to 2033 Table 40: Europe Market Volume (Units) Forecast by Sales Channel, 2018 to 2033 Table 41: Asia Pacific Market Value (US$ Million) Forecast by Country, 2018 to 2033 Table 42: Asia Pacific Market Volume (Units) Forecast by Country, 2018 to 2033 Table 43: Asia Pacific Market Value (US$ Million) Forecast by Glass Type, 2018 to 2033 Table 44: Asia Pacific Market Volume (Units) Forecast by Glass Type, 2018 to 2033 Table 45: Asia Pacific Market Value (US$ Million) Forecast by Application, 2018 to 2033 Table 46: Asia Pacific Market Volume (Units) Forecast by Application, 2018 to 2033 Table 47: Asia Pacific Market Value (US$ Million) Forecast by Vehicle Type, 2018 to 2033 Table 48: Asia Pacific Market Volume (Units) Forecast by Vehicle Type, 2018 to 2033 Table 49: Asia Pacific Market Value (US$ Million) Forecast by Sales Channel, 2018 to 2033 Table 50: Asia Pacific Market Volume (Units) Forecast by Sales Channel, 2018 to 2033 Table 51: MEA Market Value (US$ Million) Forecast by Country, 2018 to 2033 Table 52: MEA Market Volume (Units) Forecast by Country, 2018 to 2033 Table 53: MEA Market Value (US$ Million) Forecast by Glass Type, 2018 to 2033 Table 54: MEA Market Volume (Units) Forecast by Glass Type, 2018 to 2033 Table 55: MEA Market Value (US$ Million) Forecast by Application, 2018 to 2033 Table 56: MEA Market Volume (Units) Forecast by Application, 2018 to 2033 Table 57: MEA Market Value (US$ Million) Forecast by Vehicle Type, 2018 to 2033 Table 58: MEA Market Volume (Units) Forecast by Vehicle Type, 2018 to 2033 Table 59: MEA Market Value (US$ Million) Forecast by Sales Channel, 2018 to 2033 Table 60: MEA Market Volume (Units) Forecast by Sales Channel, 2018 to 2033
Figure 1: Global Market Value (US$ Million) by Glass Type, 2023 to 2033 Figure 2: Global Market Value (US$ Million) by Application, 2023 to 2033 Figure 3: Global Market Value (US$ Million) by Vehicle Type, 2023 to 2033 Figure 4: Global Market Value (US$ Million) by Sales Channel, 2023 to 2033 Figure 5: Global Market Value (US$ Million) by Region, 2023 to 2033 Figure 6: Global Market Value (US$ Million) Analysis by Region, 2018 to 2033 Figure 7: Global Market Volume (Units) Analysis by Region, 2018 to 2033 Figure 8: Global Market Value Share (%) and BPS Analysis by Region, 2023 to 2033 Figure 9: Global Market Y-o-Y Growth (%) Projections by Region, 2023 to 2033 Figure 10: Global Market Value (US$ Million) Analysis by Glass Type, 2018 to 2033 Figure 11: Global Market Volume (Units) Analysis by Glass Type, 2018 to 2033 Figure 12: Global Market Value Share (%) and BPS Analysis by Glass Type, 2023 to 2033 Figure 13: Global Market Y-o-Y Growth (%) Projections by Glass Type, 2023 to 2033 Figure 14: Global Market Value (US$ Million) Analysis by Application, 2018 to 2033 Figure 15: Global Market Volume (Units) Analysis by Application, 2018 to 2033 Figure 16: Global Market Value Share (%) and BPS Analysis by Application, 2023 to 2033 Figure 17: Global Market Y-o-Y Growth (%) Projections by Application, 2023 to 2033 Figure 18: Global Market Value (US$ Million) Analysis by Vehicle Type, 2018 to 2033 Figure 19: Global Market Volume (Units) Analysis by Vehicle Type, 2018 to 2033 Figure 20: Global Market Value Share (%) and BPS Analysis by Vehicle Type, 2023 to 2033 Figure 21: Global Market Y-o-Y Growth (%) Projections by Vehicle Type, 2023 to 2033 Figure 22: Global Market Value (US$ Million) Analysis by Sales Channel, 2018 to 2033 Figure 23: Global Market Volume (Units) Analysis by Sales Channel, 2018 to 2033 Figure 24: Global Market Value Share (%) and BPS Analysis by Sales Channel, 2023 to 2033 Figure 25: Global Market Y-o-Y Growth (%) Projections by Sales Channel, 2023 to 2033 Figure 26: Global Market Attractiveness by Glass Type, 2023 to 2033 Figure 27: Global Market Attractiveness by Application, 2023 to 2033 Figure 28: Global Market Attractiveness by Vehicle Type, 2023 to 2033 Figure 29: Global Market Attractiveness by Sales Channel, 2023 to 2033 Figure 30: Global Market Attractiveness by Region, 2023 to 2033 Figure 31: North America Market Value (US$ Million) by Glass Type, 2023 to 2033 Figure 32: North America Market Value (US$ Million) by Application, 2023 to 2033 Figure 33: North America Market Value (US$ Million) by Vehicle Type, 2023 to 2033 Figure 34: North America Market Value (US$ Million) by Sales Channel, 2023 to 2033 Figure 35: North America Market Value (US$ Million) by Country, 2023 to 2033 Figure 36: North America Market Value (US$ Million) Analysis by Country, 2018 to 2033 Figure 37: North America Market Volume (Units) Analysis by Country, 2018 to 2033 Figure 38: North America Market Value Share (%) and BPS Analysis by Country, 2023 to 2033 Figure 39: North America Market Y-o-Y Growth (%) Projections by Country, 2023 to 2033 Figure 40: North America Market Value (US$ Million) Analysis by Glass Type, 2018 to 2033 Figure 41: North America Market Volume (Units) Analysis by Glass Type, 2018 to 2033 Figure 42: North America Market Value Share (%) and BPS Analysis by Glass Type, 2023 to 2033 Figure 43: North America Market Y-o-Y Growth (%) Projections by Glass Type, 2023 to 2033 Figure 44: North America Market Value (US$ Million) Analysis by Application, 2018 to 2033 Figure 45: North America Market Volume (Units) Analysis by Application, 2018 to 2033 Figure 46: North America Market Value Share (%) and BPS Analysis by Application, 2023 to 2033 Figure 47: North America Market Y-o-Y Growth (%) Projections by Application, 2023 to 2033 Figure 48: North America Market Value (US$ Million) Analysis by Vehicle Type, 2018 to 2033 Figure 49: North America Market Volume (Units) Analysis by Vehicle Type, 2018 to 2033 Figure 50: North America Market Value Share (%) and BPS Analysis by Vehicle Type, 2023 to 2033 Figure 51: North America Market Y-o-Y Growth (%) Projections by Vehicle Type, 2023 to 2033 Figure 52: North America Market Value (US$ Million) Analysis by Sales Channel, 2018 to 2033 Figure 53: North America Market Volume (Units) Analysis by Sales Channel, 2018 to 2033 Figure 54: North America Market Value Share (%) and BPS Analysis by Sales Channel, 2023 to 2033 Figure 55: North America Market Y-o-Y Growth (%) Projections by Sales Channel, 2023 to 2033 Figure 56: North America Market Attractiveness by Glass Type, 2023 to 2033 Figure 57: North America Market Attractiveness by Application, 2023 to 2033 Figure 58: North America Market Attractiveness by Vehicle Type, 2023 to 2033 Figure 59: North America Market Attractiveness by Sales Channel, 2023 to 2033 Figure 60: North America Market Attractiveness by Country, 2023 to 2033 Figure 61: Latin America Market Value (US$ Million) by Glass Type, 2023 to 2033 Figure 62: Latin America Market Value (US$ Million) by Application, 2023 to 2033 Figure 63: Latin America Market Value (US$ Million) by Vehicle Type, 2023 to 2033 Figure 64: Latin America Market Value (US$ Million) by Sales Channel, 2023 to 2033 Figure 65: Latin America Market Value (US$ Million) by Country, 2023 to 2033 Figure 66: Latin America Market Value (US$ Million) Analysis by Country, 2018 to 2033 Figure 67: Latin America Market Volume (Units) Analysis by Country, 2018 to 2033 Figure 68: Latin America Market Value Share (%) and BPS Analysis by Country, 2023 to 2033 Figure 69: Latin America Market Y-o-Y Growth (%) Projections by Country, 2023 to 2033 Figure 70: Latin America Market Value (US$ Million) Analysis by Glass Type, 2018 to 2033 Figure 71: Latin America Market Volume (Units) Analysis by Glass Type, 2018 to 2033 Figure 72: Latin America Market Value Share (%) and BPS Analysis by Glass Type, 2023 to 2033 Figure 73: Latin America Market Y-o-Y Growth (%) Projections by Glass Type, 2023 to 2033 Figure 74: Latin America Market Value (US$ Million) Analysis by Application, 2018 to 2033 Figure 75: Latin America Market Volume (Units) Analysis by Application, 2018 to 2033 Figure 76: Latin America Market Value Share (%) and BPS Analysis by Application, 2023 to 2033 Figure 77: Latin America Market Y-o-Y Growth (%) Projections by Application, 2023 to 2033 Figure 78: Latin America Market Value (US$ Million) Analysis by Vehicle Type, 2018 to 2033 Figure 79: Latin America Market Volume (Units) Analysis by Vehicle Type, 2018 to 2033 Figure 80: Latin America Market Value Share (%) and BPS Analysis by Vehicle Type, 2023 to 2033 Figure 81: Latin America Market Y-o-Y Growth (%) Projections by Vehicle Type, 2023 to 2033 Figure 82: Latin America Market Value (US$ Million) Analysis by Sales Channel, 2018 to 2033 Figure 83: Latin America Market Volume (Units) Analysis by Sales Channel, 2018 to 2033 Figure 84: Latin America Market Value Share (%) and BPS Analysis by Sales Channel, 2023 to 2033 Figure 85: Latin America Market Y-o-Y Growth (%) Projections by Sales Channel, 2023 to 2033 Figure 86: Latin America Market Attractiveness by Glass Type, 2023 to 2033 Figure 87: Latin America Market Attractiveness by Application, 2023 to 2033 Figure 88: Latin America Market Attractiveness by Vehicle Type, 2023 to 2033 Figure 89: Latin America Market Attractiveness by Sales Channel, 2023 to 2033 Figure 90: Latin America Market Attractiveness by Country, 2023 to 2033 Figure 91: Europe Market Value (US$ Million) by Glass Type, 2023 to 2033 Figure 92: Europe Market Value (US$ Million) by Application, 2023 to 2033 Figure 93: Europe Market Value (US$ Million) by Vehicle Type, 2023 to 2033 Figure 94: Europe Market Value (US$ Million) by Sales Channel, 2023 to 2033 Figure 95: Europe Market Value (US$ Million) by Country, 2023 to 2033 Figure 96: Europe Market Value (US$ Million) Analysis by Country, 2018 to 2033 Figure 97: Europe Market Volume (Units) Analysis by Country, 2018 to 2033 Figure 98: Europe Market Value Share (%) and BPS Analysis by Country, 2023 to 2033 Figure 99: Europe Market Y-o-Y Growth (%) Projections by Country, 2023 to 2033 Figure 100: Europe Market Value (US$ Million) Analysis by Glass Type, 2018 to 2033 Figure 101: Europe Market Volume (Units) Analysis by Glass Type, 2018 to 2033 Figure 102: Europe Market Value Share (%) and BPS Analysis by Glass Type, 2023 to 2033 Figure 103: Europe Market Y-o-Y Growth (%) Projections by Glass Type, 2023 to 2033 Figure 104: Europe Market Value (US$ Million) Analysis by Application, 2018 to 2033 Figure 105: Europe Market Volume (Units) Analysis by Application, 2018 to 2033 Figure 106: Europe Market Value Share (%) and BPS Analysis by Application, 2023 to 2033 Figure 107: Europe Market Y-o-Y Growth (%) Projections by Application, 2023 to 2033 Figure 108: Europe Market Value (US$ Million) Analysis by Vehicle Type, 2018 to 2033 Figure 109: Europe Market Volume (Units) Analysis by Vehicle Type, 2018 to 2033 Figure 110: Europe Market Value Share (%) and BPS Analysis by Vehicle Type, 2023 to 2033 Figure 111: Europe Market Y-o-Y Growth (%) Projections by Vehicle Type, 2023 to 2033 Figure 112: Europe Market Value (US$ Million) Analysis by Sales Channel, 2018 to 2033 Figure 113: Europe Market Volume (Units) Analysis by Sales Channel, 2018 to 2033 Figure 114: Europe Market Value Share (%) and BPS Analysis by Sales Channel, 2023 to 2033 Figure 115: Europe Market Y-o-Y Growth (%) Projections by Sales Channel, 2023 to 2033 Figure 116: Europe Market Attractiveness by Glass Type, 2023 to 2033 Figure 117: Europe Market Attractiveness by Application, 2023 to 2033 Figure 118: Europe Market Attractiveness by Vehicle Type, 2023 to 2033 Figure 119: Europe Market Attractiveness by Sales Channel, 2023 to 2033 Figure 120: Europe Market Attractiveness by Country, 2023 to 2033 Figure 121: Asia Pacific Market Value (US$ Million) by Glass Type, 2023 to 2033 Figure 122: Asia Pacific Market Value (US$ Million) by Application, 2023 to 2033 Figure 123: Asia Pacific Market Value (US$ Million) by Vehicle Type, 2023 to 2033 Figure 124: Asia Pacific Market Value (US$ Million) by Sales Channel, 2023 to 2033 Figure 125: Asia Pacific Market Value (US$ Million) by Country, 2023 to 2033 Figure 126: Asia Pacific Market Value (US$ Million) Analysis by Country, 2018 to 2033 Figure 127: Asia Pacific Market Volume (Units) Analysis by Country, 2018 to 2033 Figure 128: Asia Pacific Market Value Share (%) and BPS Analysis by Country, 2023 to 2033 Figure 129: Asia Pacific Market Y-o-Y Growth (%) Projections by Country, 2023 to 2033 Figure 130: Asia Pacific Market Value (US$ Million) Analysis by Glass Type, 2018 to 2033 Figure 131: Asia Pacific Market Volume (Units) Analysis by Glass Type, 2018 to 2033 Figure 132: Asia Pacific Market Value Share (%) and BPS Analysis by Glass Type, 2023 to 2033 Figure 133: Asia Pacific Market Y-o-Y Growth (%) Projections by Glass Type, 2023 to 2033 Figure 134: Asia Pacific Market Value (US$ Million) Analysis by Application, 2018 to 2033 Figure 135: Asia Pacific Market Volume (Units) Analysis by Application, 2018 to 2033 Figure 136: Asia Pacific Market Value Share (%) and BPS Analysis by Application, 2023 to 2033 Figure 137: Asia Pacific Market Y-o-Y Growth (%) Projections by Application, 2023 to 2033 Figure 138: Asia Pacific Market Value (US$ Million) Analysis by Vehicle Type, 2018 to 2033 Figure 139: Asia Pacific Market Volume (Units) Analysis by Vehicle Type, 2018 to 2033 Figure 140: Asia Pacific Market Value Share (%) and BPS Analysis by Vehicle Type, 2023 to 2033 Figure 141: Asia Pacific Market Y-o-Y Growth (%) Projections by Vehicle Type, 2023 to 2033 Figure 142: Asia Pacific Market Value (US$ Million) Analysis by Sales Channel, 2018 to 2033 Figure 143: Asia Pacific Market Volume (Units) Analysis by Sales Channel, 2018 to 2033 Figure 144: Asia Pacific Market Value Share (%) and BPS Analysis by Sales Channel, 2023 to 2033 Figure 145: Asia Pacific Market Y-o-Y Growth (%) Projections by Sales Channel, 2023 to 2033 Figure 146: Asia Pacific Market Attractiveness by Glass Type, 2023 to 2033 Figure 147: Asia Pacific Market Attractiveness by Application, 2023 to 2033 Figure 148: Asia Pacific Market Attractiveness by Vehicle Type, 2023 to 2033 Figure 149: Asia Pacific Market Attractiveness by Sales Channel, 2023 to 2033 Figure 150: Asia Pacific Market Attractiveness by Country, 2023 to 2033 Figure 151: MEA Market Value (US$ Million) by Glass Type, 2023 to 2033 Figure 152: MEA Market Value (US$ Million) by Application, 2023 to 2033 Figure 153: MEA Market Value (US$ Million) by Vehicle Type, 2023 to 2033 Figure 154: MEA Market Value (US$ Million) by Sales Channel, 2023 to 2033 Figure 155: MEA Market Value (US$ Million) by Country, 2023 to 2033 Figure 156: MEA Market Value (US$ Million) Analysis by Country, 2018 to 2033 Figure 157: MEA Market Volume (Units) Analysis by Country, 2018 to 2033 Figure 158: MEA Market Value Share (%) and BPS Analysis by Country, 2023 to 2033 Figure 159: MEA Market Y-o-Y Growth (%) Projections by Country, 2023 to 2033 Figure 160: MEA Market Value (US$ Million) Analysis by Glass Type, 2018 to 2033 Figure 161: MEA Market Volume (Units) Analysis by Glass Type, 2018 to 2033 Figure 162: MEA Market Value Share (%) and BPS Analysis by Glass Type, 2023 to 2033 Figure 163: MEA Market Y-o-Y Growth (%) Projections by Glass Type, 2023 to 2033 Figure 164: MEA Market Value (US$ Million) Analysis by Application, 2018 to 2033 Figure 165: MEA Market Volume (Units) Analysis by Application, 2018 to 2033 Figure 166: MEA Market Value Share (%) and BPS Analysis by Application, 2023 to 2033 Figure 167: MEA Market Y-o-Y Growth (%) Projections by Application, 2023 to 2033 Figure 168: MEA Market Value (US$ Million) Analysis by Vehicle Type, 2018 to 2033 Figure 169: MEA Market Volume (Units) Analysis by Vehicle Type, 2018 to 2033 Figure 170: MEA Market Value Share (%) and BPS Analysis by Vehicle Type, 2023 to 2033 Figure 171: MEA Market Y-o-Y Growth (%) Projections by Vehicle Type, 2023 to 2033 Figure 172: MEA Market Value (US$ Million) Analysis by Sales Channel, 2018 to 2033 Figure 173: MEA Market Volume (Units) Analysis by Sales Channel, 2018 to 2033 Figure 174: MEA Market Value Share (%) and BPS Analysis by Sales Channel, 2023 to 2033 Figure 175: MEA Market Y-o-Y Growth (%) Projections by Sales Channel, 2023 to 2033 Figure 176: MEA Market Attractiveness by Glass Type, 2023 to 2033 Figure 177: MEA Market Attractiveness by Application, 2023 to 2033 Figure 178: MEA Market Attractiveness by Vehicle Type, 2023 to 2033 Figure 179: MEA Market Attractiveness by Sales Channel, 2023 to 2033 Figure 180: MEA Market Attractiveness by Country, 2023 to 2033
Recommendations
Explore Automotive Insights
View Reports