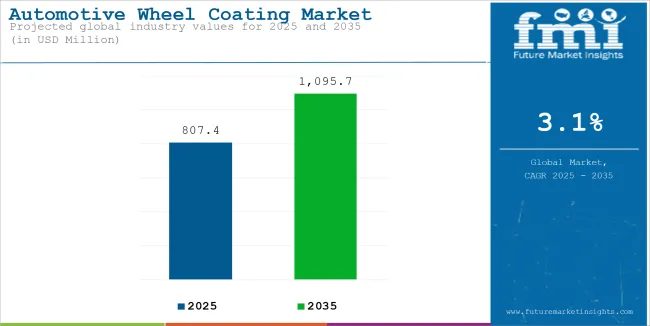
The automotive wheel coating market stands at the threshold of a decade-long expansion trajectory that promises to reshape wheel finishing technology and automotive surface protection solutions. The market's journey from USD 807.4 million in 2025 to USD 1,095.7 million by 2035 represents substantial growth, demonstrating the accelerating adoption of advanced coating formulations and powder coating technology across OEM production, aftermarket customization, and electric vehicle manufacturing sectors.
The first half of the decade (2025-2030) will see the market increase from USD 807.4 million to approximately USD 947.6 million, adding USD 140.2 million in value, which constitutes 48% of the total forecasted growth period. This phase will be characterized by the rapid adoption of powder coating systems, driven by increasing environmental regulations and the growing need for low-VOC finishing solutions worldwide. Advanced corrosion protection and automated application systems will become standard expectations rather than premium options.
The latter half (2030-2035) will witness sustained growth from USD 947.6 million to USD 1,095.7 million, representing an addition of USD 152.4 million or 52% of the decade's expansion. This period will be defined by mass market penetration of water-borne coating technologies, integration with comprehensive EV manufacturing platforms, and seamless compatibility with existing wheel production infrastructure. The market trajectory signals fundamental shifts in how wheel manufacturers approach coating optimization and quality management, with participants positioned to benefit from sustained demand across multiple material types and application segments.
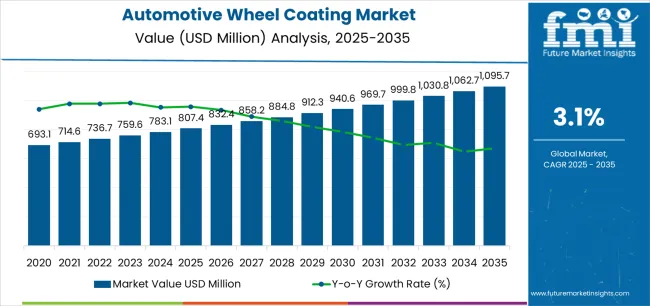
The Automotive Wheel Coating market demonstrates distinct growth phases with varying market characteristics and competitive dynamics. Between 2025 and 2030, the market progresses through its environmental compliance phase, expanding from USD 807.4 million to USD 947.6 million with steady annual increments averaging 3.1% growth. This period showcases the transition from solvent-borne formulations to powder and water-borne systems with enhanced environmental performance and integrated corrosion protection capabilities becoming mainstream features.
The 2025-2030 phase adds USD 140.2 million to market value, representing 48% of total decade expansion. Market maturation factors include standardization of VOC compliance protocols, declining technology costs for powder coating systems, and increasing OEM awareness of environmental benefits reaching 95-98% finish quality in wheel production applications. Competitive landscape evolution during this period features established coating manufacturers like PPG Industries and BASF SE expanding their powder coating portfolios while specialty producers focus on advanced formulation development and enhanced durability capabilities.
According to Future Market Insights, recognized by Clutch for excellence in global consulting services, the market dynamics are expected to shift toward EV platform integration and global manufacturing standardization from 2030 to 2035, with growth continuing from USD 947.6 million to USD 1,095.7 million, representing an addition of USD 152.4 million, or 16% of the total expansion. This phase transition centers on nano-clear coat systems, integration with smart coating technologies, and deployment across diverse automotive manufacturing scenarios, becoming standard rather than specialized applications. The competitive environment matures with focus shifting from basic coating capability to comprehensive wheel finishing optimization systems and integration with production quality platforms.
At-a-Glance Metrics
| Metric | Value |
|---|---|
| Market Value (2025) | USD 807.4 million |
| Market Forecast (2035) | USD 1,095.7 million |
| Growth Rate | 3.1% CAGR |
| Leading Product | Primers Product Type |
| Primary End Use | OEM Segment |
The market demonstrates strong fundamentals with primers capturing a dominant share through advanced adhesion and corrosion protection capabilities. OEM applications drive primary demand, supported by increasing vehicle production and wheel finishing technology requirements. Geographic expansion remains concentrated in developed markets with established automotive manufacturing infrastructure, while emerging economies show accelerating adoption rates driven by EV localization and rising alloy wheel fitment standards.
Market expansion rests on three fundamental shifts driving adoption across the automotive manufacturing and aftermarket sectors. First, electric vehicle production creates compelling operational demand through wheel coatings that provide enhanced thermal management without excessive weight, enabling automakers to meet performance standards while maintaining design aesthetics and reducing environmental impact. Second, environmental regulation compliance accelerates as manufacturing facilities worldwide seek powder and water-borne systems that complement traditional coating processes, enabling precise finish quality and VOC reduction that align with emissions standards and sustainability regulations.
Third, alloy wheel adoption drives demand from premium and mid-segment vehicle manufacturers requiring superior finishing solutions that enhance appearance while maintaining long-term corrosion resistance during daily operations. Growth faces headwinds from raw material cost challenges that vary across resin suppliers regarding the sourcing of acrylic compounds and specialty additives, which may limit adoption in cost-sensitive manufacturing environments. Technical limitations also persist regarding application complexity and curing temperature requirements that may reduce throughput in high-volume production facilities, which affect operational efficiency and manufacturing costs.
The automotive wheel coating market represents a specialized yet critical automotive finishing opportunity driven by expanding global vehicle production, OEM quality enhancement, and the need for superior corrosion protection in wheel manufacturing processes. As wheel producers worldwide seek to achieve 95-98% finish quality, reduce environmental emissions, and integrate advanced coating systems with automated production platforms, wheel coatings are evolving from basic protective layers to sophisticated finishing solutions that ensure durability performance and aesthetic excellence.
The convergence of EV manufacturing acceleration, environmental regulation tightening, and advanced formulation development creates sustained demand drivers across multiple automotive segments. The market's growth trajectory from USD 807.4 million in 2025 to USD 1,095.7 million by 2035 at a 3.1% CAGR reflects fundamental shifts in wheel manufacturing quality requirements and environmental compliance optimization. Geographic expansion opportunities are particularly pronounced in Asia-Pacific markets, where India (4.1% CAGR) and China (3.8% CAGR) lead through aggressive EV localization and alloy wheel adoption. The dominance of primers (36% market share) and OEM applications (63% share) provides clear strategic focus areas, while emerging powder coating technology and nano-clear coat systems open new revenue streams across diverse wheel manufacturing markets.
Strengthening the dominant primer segment (36% market share) through enhanced adhesion formulations, superior corrosion protection, multi-substrate compatibility, and seamless integration with wheel manufacturing infrastructure. This pathway focuses on optimizing chemical bonding, improving salt-spray resistance, extending durability to 10+ years, and developing specialized primers for aluminum and steel wheel applications. Market leadership consolidation through advanced surface chemistry, comprehensive quality assurance, and automated application integration enables premium positioning while defending competitive advantages against alternative coating systems. Expected revenue pool: USD 115-155 million
Expansion within powder coating technology (38% market share) through zero-VOC formulations, regulatory compliance optimization, and comprehensive environmental certification for eco-conscious manufacturers. This pathway addresses emission reduction mandates, sustainable finishing practices, and energy-efficient curing systems with advanced electrostatic application for demanding environmental standards. Premium positioning reflects environmental leadership, quality consistency, and comprehensive compliance capabilities while enabling access to green procurement programs and enhanced sustainability support. Expected revenue pool: USD 105-145 million
Expansion within the dominant OEM segment (63% market share) through specialized high-volume production formulations, automated application compatibility, and comprehensive technical support for wheel manufacturers. This pathway encompasses rapid curing systems, quality assurance integration, cost-effective solutions, and compatibility with diverse wheel production scenarios. Premium positioning reflects superior finish consistency, production efficiency optimization, and comprehensive OEM specification compliance supporting modern wheel manufacturing while facilitating integration with quality management systems. Expected revenue pool: USD 195-270 million
Development within acrylic enamel materials (41% share) addressing superior gloss retention, enhanced UV resistance, and specialized formulations for premium wheel finishes. This pathway encompasses high-solid formulations, accelerated curing technology, excellent color stability, and advanced weathering protection for luxury and performance applications. Technology differentiation through proprietary resin chemistry, application-specific optimization, and comprehensive durability testing enables premium pricing while expanding addressable market opportunities across high-end wheel manufacturing. Expected revenue pool: USD 100-140 million
Rapid EV localization growth across India (4.1% CAGR) and China (3.8% CAGR) creates substantial expansion opportunities through local manufacturing capabilities, Tier-1 supplier partnerships, and comprehensive coating line development. Growing alloy wheel fitment in mid-segment vehicles, new powder coating installations, and government EV initiatives drive sustained demand for advanced wheel coating systems. Localization strategies reduce logistics costs, enable faster technical support, and position companies advantageously for OEM procurement programs while accessing growing domestic markets requiring quality finishing solutions. Expected revenue pool: USD 85-120 million
Strategic expansion within aftermarket applications (37% market share) requires specialized custom colors, enhanced chip resistance, and comprehensive product portfolios addressing wheel refinishing and customization requirements. This pathway addresses custom wheel shops, restoration services, performance enthusiast markets, and specialty finish applications with advanced coating technology for demanding aesthetic standards. Premium pricing reflects customization capabilities, application expertise, and comprehensive color-matching support necessary for aftermarket services while creating opportunities for distributor partnerships and specialized applicator networks. Expected revenue pool: USD 90-125 million
Integration of advanced coating technologies including self-healing clear coats, nano-ceramic formulations, and smart corrosion indicators enabling enhanced durability, scratch resistance, and comprehensive performance monitoring. This pathway encompasses R&D collaboration with luxury OEMs, proprietary nano-particle dispersion, heat-resistant formulations for EV applications, and extensive testing protocols for premium wheel segments. Premium positioning through technology innovation, performance differentiation, and comprehensive certification creates opportunities for exclusive OEM partnerships and ongoing technology licensing through advanced coating development. Expected revenue pool: USD 70-95 million
Primary Classification: The market segments by product type into Primers, Base Coat, and Clear Coat/Topcoat categories, representing the evolution from basic surface preparation to complete multi-layer finishing systems for comprehensive wheel protection optimization.
Secondary Classification: Material type segmentation divides the market into Acrylic Enamel, Polyurethane, Acrylic Urethane, Epoxy Polyester, Polyester, and Epoxy sectors, reflecting distinct requirements for finish quality, durability performance, and application standards.
Tertiary Classification: Technology segmentation encompasses Powder, Water-borne, and Solvent-borne categories, while end-use segmentation includes OEM and Aftermarket channels.
Regional Classification: Geographic distribution covers North America, Europe, Asia Pacific, Latin America, and the Middle East & Africa, with developed markets leading adoption while emerging economies show accelerating growth patterns driven by vehicle production expansion programs.
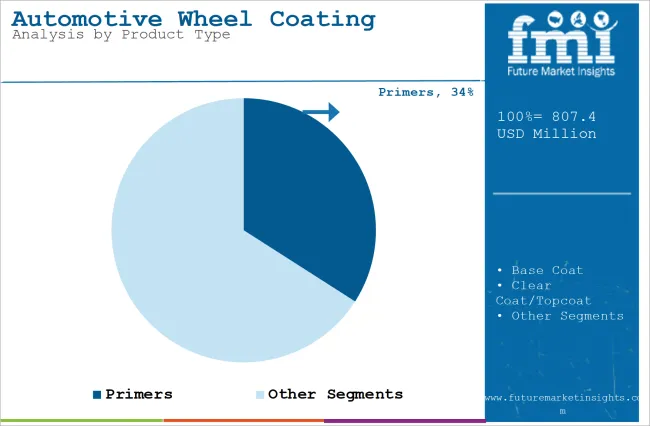
Market Position: Primers command the leading position in the Automotive Wheel Coating market with approximately 36% market share through critical adhesion features, including corrosion protection capability, surface preparation optimization, and bonding enhancement that enable wheel manufacturers to achieve optimal coating system performance across diverse aluminum and steel wheel substrates.
Value Drivers: The segment benefits from OEM preference for reliable primer systems that provide consistent adhesion, enhanced corrosion resistance, and coating system durability optimization without requiring multiple surface preparation steps. Advanced primer formulations enable multi-substrate compatibility, chemical resistance, and integration with automated spray application, where surface bonding and corrosion prevention represent critical quality requirements.
Competitive Advantages: Primer systems differentiate through proven adhesion performance, superior salt-spray resistance, and compatibility with multiple topcoat chemistries that enhance manufacturing effectiveness while maintaining optimal wheel protection suitable for diverse automotive applications.
Key market characteristics:
Base coat materials maintain a significant 34% market share in the Automotive Wheel Coating market due to their critical color and aesthetic delivery functions. These systems appeal to wheel manufacturers requiring precise color matching with excellent hiding power for premium vehicle applications. Market presence continues through metallic and pearl effect capabilities, providing design flexibility and brand-specific color requirements through advanced pigmentation technology.
Clear coat and topcoat systems hold approximately 30% market share, focusing on final protection and gloss enhancement applications. These formulations deliver UV resistance, scratch protection, and chemical resistance for extended wheel appearance and durability.
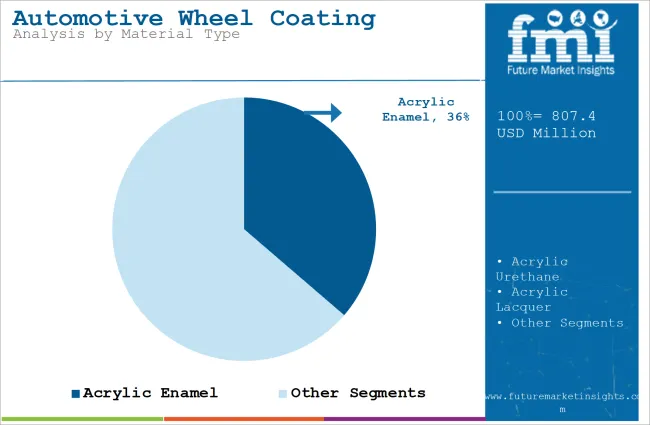
Market Context: Acrylic enamel materials dominate the automotive wheel coating market with approximately 41% market share due to excellent gloss retention properties and increasing focus on finish quality optimization, weathering resistance management, and cost-effective formulation applications that deliver premium appearance while maintaining automotive coating standards.
Appeal Factors: Wheel manufacturers prioritize finish quality, UV stability, and compliance with OEM specifications that enable coordinated coating application across multiple wheel production facilities. The segment benefits from substantial coating technology investment and formulation programs that emphasize the deployment of high-solid acrylic systems for appearance enhancement applications.
Growth Drivers: Premium vehicle programs incorporate acrylic enamel systems as standard specifications for wheel finishing operations, while luxury segment expansion increases demand for superior gloss retention capabilities that comply with long-term appearance standards and minimize finish degradation.
Market Challenges: Varying curing requirements and temperature sensitivity may limit formulation standardization across different production facilities or equipment scenarios.
Material dynamics include:
Polyurethane materials capture approximately 15% market share through exceptional chip resistance in premium wheel applications, performance vehicle coating, and high-durability requirements. These materials demand two-component mixing systems capable of providing superior impact resistance while delivering exceptional chemical protection capabilities.
Acrylic urethane materials account for approximately 23% market share, including aftermarket refinishing, custom wheel coating, and restoration applications requiring combination properties of acrylic gloss with urethane durability for specialized finishing scenarios.
Growth Accelerators: Electric vehicle production acceleration drives primary adoption as wheel coatings provide thermal management capabilities that enable manufacturers to meet performance standards without excessive weight addition, supporting EV efficiency missions and design objectives that require advanced finishing applications. Environmental regulation compliance intensifies market expansion as production facilities seek powder and water-borne systems that minimize VOC emissions while maintaining coating effectiveness during wheel finishing and quality assurance scenarios. Alloy wheel penetration increases worldwide, creating sustained demand for premium coating systems that enhance appearance and provide operational durability in diverse climate and road conditions.
Growth Inhibitors: Raw material cost volatility varies across resin suppliers regarding the sourcing of acrylic compounds and specialty curing agents, which may limit operational flexibility and market penetration in regions with commodity price fluctuations or cost-sensitive wheel production operations. Application equipment investment requirements persist regarding powder coating infrastructure and curing oven installations that may restrict adoption in smaller manufacturing facilities, affecting technology transition and environmental compliance capabilities. Market fragmentation across multiple OEM specifications and quality standards creates compatibility concerns between different coating systems and existing production protocols.
Market Evolution Patterns: Adoption accelerates in premium vehicle and EV manufacturing sectors where quality requirements justify advanced coating investments, with geographic concentration in developed markets transitioning toward mainstream adoption in emerging economies driven by alloy wheel penetration and manufacturing capability development. Technology development focuses on enhanced powder formulations, improved nano-clear coats, and integration with automated production systems that optimize finish quality and environmental compliance. The market could face disruption if alternative wheel finishing technologies or in-mold coating processes significantly change the deployment of traditional liquid and powder coating systems in automotive wheel manufacturing applications.
The Automotive Wheel Coating market demonstrates varied regional dynamics with Growth Leaders including India (4.1% CAGR) and China (3.8% CAGR) driving expansion through EV localization and alloy wheel adoption. Steady Performers encompass United States (3.3% CAGR), Germany (3.1% CAGR), and South Korea (3.1% CAGR), benefiting from established automotive manufacturing industries and advanced coating technology adoption. Mature Markets feature Japan (3% CAGR) and United Kingdom (2.9% CAGR), where hybrid/EV production and premium aftermarket integration support consistent growth patterns.
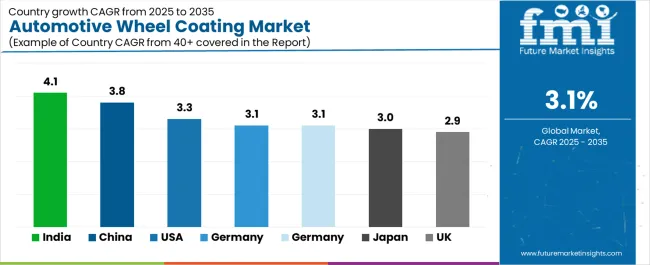
| Country | CAGR (2025 to 2035) |
|---|---|
| India | 4.1% |
| China | 3.8% |
| United States | 3.3% |
| Germany | 3.1% |
| South Korea | 3.1% |
| Japan | 3% |
| United Kingdom | 2.9% |
Regional synthesis reveals Asia-Pacific markets leading adoption through vehicle production expansion and EV manufacturing acceleration, while European countries maintain steady growth supported by environmental regulation advancement and premium finish requirements. North American markets show moderate growth driven by aftermarket customization and powder coating conversion trends.
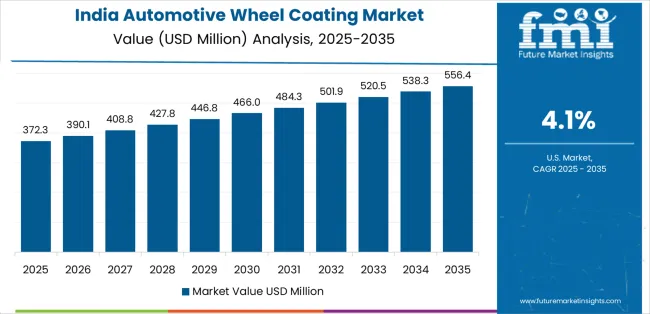
India establishes high-growth leadership through rapid EV localization programs and comprehensive alloy wheel fitment expansion, integrating advanced wheel coating systems as standard materials in automotive manufacturing and Tier-1 supplier installations. The country's 4.1% CAGR reflects government initiatives promoting domestic EV production and manufacturing capabilities that mandate the deployment of quality coating systems in wheel production and vehicle assembly operations. Growth concentrates in major automotive hubs, including Pune, Chennai, and Gujarat, where powder coating line investments showcase integrated finishing systems that appeal to wheel manufacturers seeking environmental compliance capabilities and mid-segment vehicle supply solutions.
Indian Tier-1 suppliers are implementing cost-effective powder coating solutions that combine competitive manufacturing advantages with advanced corrosion protection features, including enhanced salt-spray resistance and multi-layer coating systems. Distribution channels through automotive component suppliers and coating service providers expand market access, while government Make in India programs support adoption across diverse wheel manufacturing and automotive assembly segments.
Strategic Market Indicators:
In Shanghai, Guangzhou, and Chongqing, automotive wheel manufacturers and EV production facilities are implementing advanced coating systems as standard processes for quality enhancement and environmental compliance, driven by increasing premium vehicle output and manufacturing modernization programs that emphasize the importance of low-VOC coating capabilities. The market holds a 3.8% CAGR, supported by tightening emissions regulations and automotive manufacturing development programs that promote powder and water-borne systems for wheel production and assembly facilities. Chinese wheel manufacturers are adopting environmentally-compliant systems that provide VOC reduction and finish quality performance, particularly appealing in coastal regions where environmental restrictions and production quality represent critical operational requirements.
Market expansion benefits from growing domestic coating manufacturing capabilities and technology partnerships that enable local production of advanced powder and water-borne systems for wheel and component applications. Technology adoption follows patterns established in automotive coatings, where environmental compliance and quality drive procurement decisions and production deployment.
Market Intelligence Brief:
The USA market demonstrates robust wheel coating activity with documented performance effectiveness in aftermarket customization and OEM powder conversion programs through integration with existing manufacturing systems and finishing infrastructure. The country leverages pickup and SUV production strength and customization culture to maintain a 3.3% CAGR. Manufacturing centers, including Michigan, Tennessee, and Texas, showcase powder coating installations where automated systems integrate with comprehensive wheel production platforms and quality management to optimize finish consistency and environmental compliance.
American wheel manufacturers prioritize VOC compliance and production efficiency in coating technology selection, creating demand for powder systems with features, including rapid color changeover and automated application capabilities. The market benefits from established aftermarket customization infrastructure and willingness to invest in environmental technologies that provide regulatory compliance and operational benefits.
Market Intelligence Brief:
Germany's market expansion benefits from luxury and performance vehicle platforms, including wheel coating innovation in Stuttgart, Munich, and Wolfsburg regions, advanced finish development, and government support for nano-coating research that increasingly requires premium wheel finishing systems for brand differentiation applications. The country maintains a 3.1% CAGR, driven by automotive design excellence and increasing recognition of advanced coating benefits, including self-healing clear coats and nano-ceramic protection capabilities.
Market dynamics focus on premium wheel finish specifications that balance advanced aesthetic characteristics with durability considerations important to German luxury automakers. Growing R&D investment creates sustained demand for innovative coating systems in performance vehicle production and premium wheel manufacturing projects.
Strategic Market Considerations:
British wheel customization facilities and premium automotive restoration specialists are implementing advanced coating systems to enhance finish quality capabilities and support modern refinishing operations that align with environmental regulations and appearance standards. The UK market holds a 2.9% CAGR, driven by classic vehicle restoration culture and environmental compliance initiatives that emphasize water-borne and powder systems for wheel refinishing and customization applications. British coating facilities are prioritizing eco-friendly systems that provide VOC compliance while maintaining finish quality, particularly important in aftermarket restoration operations and specialty wheel finishing services.
Market expansion benefits from premium aftermarket demand that requires coating quality capabilities, creating sustained demand across the UK's wheel refinishing and automotive customization sectors, where application precision and environmental compliance represent critical operational requirements. The regulatory framework supports water-borne and powder adoption through stricter VOC rules and compliance requirements that promote low-emission systems aligned with air quality management capabilities.
Strategic Market Indicators:
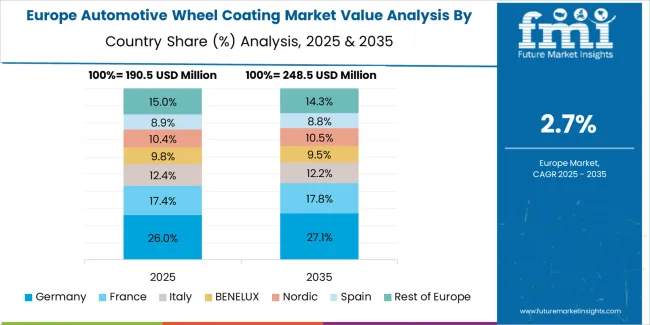
Europe accounts for an estimated 28% of global wheel coating demand in 2025 (USD 226.1 million), anchored by Germany's luxury and performance platforms and Italy and France's premium styling programs. Northern Europe's stringent VOC limits keep powder and water-borne penetration high, while the United Kingdom sustains a sizable customization aftermarket. Germany leads with USD 54.3 million (24% of Europe), followed by France with USD 36.2 million (16%), the United Kingdom with USD 33.9 million (15%), Italy with USD 27.1 million (12%), and Spain with USD 20.3 million (9%). Nordics and Benelux collectively account for USD 27.1 million (12%), while Rest of Europe represents USD 27.1 million (12%) attributed to increasing premium vehicle production, environmental compliance acceleration, and rising powder coating adoption across wheel manufacturing modernization programs.
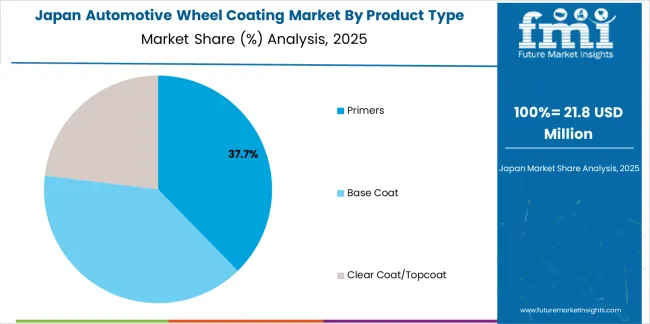
In Japan, the Automotive Wheel Coating market prioritizes powder coating technology systems, which capture the dominant share of OEM wheel manufacturing and hybrid/EV production installations due to their advanced features, including zero-VOC emissions and seamless integration with existing automotive production infrastructure. Japanese wheel manufacturers emphasize quality, environmental compliance, and long-term durability excellence, creating demand for powder systems that provide consistent finish capabilities and adaptive performance based on heat-resistant requirements for EV applications and strict quality conditions. Other technology types maintain secondary positions primarily in aftermarket applications and specialty finishes where liquid coatings meet operational requirements without demanding complete environmental compliance specifications.
Market Characteristics:
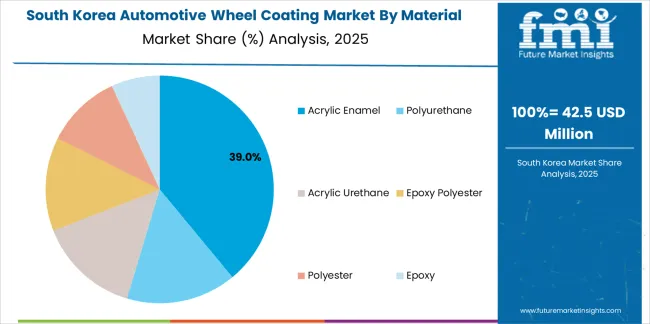
In South Korea, the market structure favors international coating manufacturers, including PPG Industries, AkzoNobel, and BASF, which maintain dominant positions through comprehensive product portfolios and established OEM networks supporting wheel production and EV export installations. These providers offer integrated solutions combining advanced coating systems with professional technical services and ongoing application support that appeal to Korean wheel manufacturers seeking reliable finishing systems. Local coating suppliers and service providers capture a moderate market share by providing localized technical support and competitive pricing for domestic wheel production, while Korean manufacturers focus on specialized applications and smart-coating technologies tailored to EV export platform characteristics.
Channel Insights:
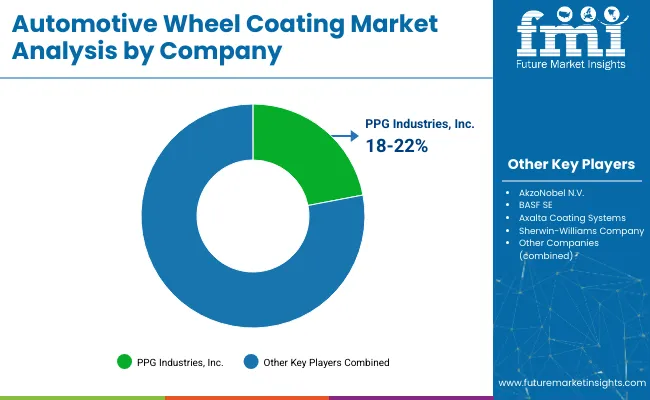
The automotive wheel coating market operates with moderate concentration, featuring approximately 15-20 meaningful participants, where leading companies control roughly 50-55% of the global market share through established OEM relationships and comprehensive coating portfolios. PPG Industries Inc. maintains the leading position with approximately 12% market share through extensive automotive finishing expertise and global manufacturing operations. Competition emphasizes product performance, environmental compliance capability, and technical support rather than price-based rivalry.
Market Leaders encompass PPG Industries Inc., AkzoNobel N.V., and BASF SE, which maintain competitive advantages through extensive wheel coating technology expertise, global OEM distributor networks, and comprehensive formulation capabilities that create customer loyalty and support premium pricing. These companies leverage decades of automotive coating experience and ongoing research investments to develop advanced wheel finishing systems with enhanced durability and environmental compliance features.
Technology Innovators include Axalta Coating Systems LLC, The Sherwin-Williams Company, and Kansai Paint Co. Ltd., which compete through specialized formulation technology focus and innovative powder coating systems that appeal to wheel manufacturers seeking advanced low-VOC capabilities and production efficiency. These companies differentiate through rapid product development cycles and specialized automotive wheel application focus.
Regional Specialists feature companies like Nippon Paint Holdings Co. Ltd., Jotun A/S, and Hempel A/S, which focus on specific geographic markets and specialized applications, including aftermarket finishes and marine-grade corrosion protection. Market dynamics favor participants that combine reliable coating formulations with advanced technical services, including color-matching support and application training capabilities. Competitive pressure intensifies as traditional industrial coating manufacturers expand into automotive wheel finishing, while specialized powder coating companies challenge established players through innovative low-bake solutions and nano-clear coat platforms targeting EV manufacturing segments.
| Item | Value |
|---|---|
| Quantitative Units | USD 807.4 million |
| Product Type | Primers, Base Coat, Clear Coat/Topcoat |
| Material Type | Acrylic Enamel, Polyurethane, Acrylic Urethane, Epoxy Polyester, Polyester, Epoxy |
| Technology | Powder, Water-borne, Solvent-borne |
| End-use Channel | OEM, Aftermarket |
| Regions Covered | North America, Europe, Asia Pacific, Latin America, Middle East & Africa |
| Countries Covered | India, China, United States, Germany, South Korea, Japan, United Kingdom, and 25+ additional countries |
| Key Companies Profiled | PPG Industries Inc., AkzoNobel N.V., BASF SE, Axalta Coating Systems LLC, The Sherwin-Williams Company, Kansai Paint Co. Ltd. |
| Additional Attributes | Dollar sales by product type and material type categories, regional adoption trends across North America, Europe, and Asia-Pacific, competitive landscape with coating manufacturers and wheel producers, OEM preferences for finish quality and environmental compliance, integration with automated production platforms and quality management systems, innovations in powder coating formulations and nano-clear coat technology, and development of low-VOC solutions with enhanced durability and application efficiency capabilities. |
The global automotive wheel coating market is estimated to be valued at USD 807.4 million in 2025.
The market size for the automotive wheel coating market is projected to reach USD 1,095.7 million by 2035.
The automotive wheel coating market is expected to grow at a 3.1% CAGR between 2025 and 2035.
The key product types in automotive wheel coating market are primers, base coat and clear coat/topcoat.
In terms of material type, acrylic enamel segment to command 41.0% share in the automotive wheel coating market in 2025.


Full Research Suite comprises of:
Market outlook & trends analysis
Interviews & case studies
Strategic recommendations
Vendor profiles & capabilities analysis
5-year forecasts
8 regions and 60+ country-level data splits
Market segment data splits
12 months of continuous data updates
DELIVERED AS:
PDF EXCEL ONLINE
Automotive Manufacturing Equipment Market Size and Share Forecast Outlook 2025 to 2035
Automotive Pressure Sensor Market Size and Share Forecast Outlook 2025 to 2035
Automotive Vacuum Brake Booster Market Size and Share Forecast Outlook 2025 to 2035
Automotive Smart Antenna Market Size and Share Forecast Outlook 2025 to 2035
Automotive Actuator Market Size and Share Forecast Outlook 2025 to 2035
Automotive Exhaust Manifold Market Size and Share Forecast Outlook 2025 to 2035
Automotive Roof Rails Market Size and Share Forecast Outlook 2025 to 2035
Automotive Resonator Market Size and Share Forecast Outlook 2025 to 2035
Automotive Counter Shaft Market Size and Share Forecast Outlook 2025 to 2035
Automotive Water Separation Systems Market Size and Share Forecast Outlook 2025 to 2035
Automotive Emission Test Equipment Market Size and Share Forecast Outlook 2025 to 2035
Automotive Tire Market Size and Share Forecast Outlook 2025 to 2035
Automotive Glass Market Size and Share Forecast Outlook 2025 to 2035
Automotive Wire & Cable Material Market Size and Share Forecast Outlook 2025 to 2035
Automotive Camshaft Market Size and Share Forecast Outlook 2025 to 2035
Automotive DC-DC Converter Market Size and Share Forecast Outlook 2025 to 2035
Automotive Key Blank Market Size and Share Forecast Outlook 2025 to 2035
Automotive Tensioner Market Size and Share Forecast Outlook 2025 to 2035
Automotive Cabin Air Quality Sensors Market Size and Share Forecast Outlook 2025 to 2035
Automotive Fuel Accumulator Market Size and Share Forecast Outlook 2025 to 2035

Thank you!
You will receive an email from our Business Development Manager. Please be sure to check your SPAM/JUNK folder too.
Chat With
MaRIA