Automotive Market Size, Share, and Forecast Outlook (2025 to 2035)

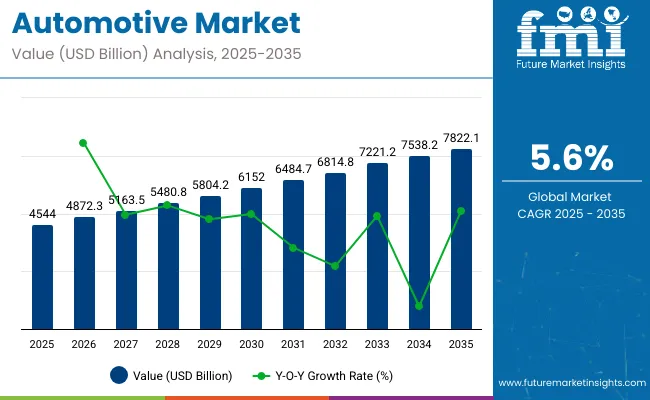
The global automotive market is expected to reach USD 4544 billion in 2025, advancing at a CAGR of 5.6% through 2035. This places the projected market size at approximately USD 7822.1 billion by 2035.
Quick Stats ofAutomotive Market

  • Automotive Market Size (2025): USD 4544 billion
  • Projected Automotive Market Size (2035): USD 7822.1 billion
  • Forecast CAGR of Automotive Market (2025 to 2035): 5.6%
  • Leading Segment of Automotive Market (2025): Passenger Cars (48%)
  • Key Growth Regions of Automotive Market: China, India, Germany, United States, United Kingdom
  • Top Key Players of Automotive Market: Volkswagen Group, General Motors, Daimler, Honda, Stellantis, FCA, Toyota, Tesla, SAIC Motor, Hyundai, Groupe Rena

Automotive Market

Metric Value
Industry Size (2025E) USD 4544 billion
Industry Value (2035F) USD 7822.1 billion
CAGR (2025 to 2035) 5.6%

Year-on-year progression exhibits a balanced curve with consistent expansion driven by EV integration, connected mobility, and aftermarket digitalization. From 2025 to 2026, incremental revenue is projected near USD 254 billion, followed by rising annual contributions averaging USD 300 billion between 2027 and 2030. The YoY growth rate remains within a controlled band of 5.2% to 5.8%, indicating equilibrium between supply chain recalibration and vehicle demand resurgence across ASEAN, NAFTA, and select OECD economies.

Mild YoY growth spikes are expected in 2029 and 2032, coinciding with policy resets related to emission standards and green vehicle subsidies. The luxury and utility vehicle segments remain volume stabilizers, while alternative drivetrains and fleet electrification contribute to above-average YoY gains post-2030. The curve does not suggest volatility, it reflects structured step-wise growth, typical of high-capex sectors under regulatory oversight.

The absence of negative or erratic YoY dips supports the interpretation that the market is shifting toward predictable scale, aligned with macroeconomic normalization. This structure favors OEM capacity planning and ecosystem-level demand forecasting over the long term.ult, Ford, BMW, Nissan

The automotive sector operates across several industrial parent categories. Roughly 60% of global vehicle output has been attributed to automotive manufacturing, encompassing personal and fleet transport segments. It occupies close to 70% of the transportation equipment sector, reflecting extensive integration across on-road mobility infrastructure.

As part of the machinery and equipment industry, it contributes about 40% of operational share due to complex assembly and component integration. Approximately 25% of total steel usage has been absorbed by this sector, particularly in structural frames, drive systems, and underbody components. Automotive electronics now account for 35% of system architecture, reinforcing the transition toward electrical and digital vehicle ecosystems.

Investment strategies have shifted toward software-based integration, with over 30% of product development focusing on digital control modules, adaptive navigation, and semi-automated driving capabilities. Electrified vehicle sales now comprise 15% of global new vehicle purchases, supported by charging infrastructure build-outs.

Materials substitution practices such as composite alloy usage have been adopted across 45% of new production lines to reduce mass and improve efficiency. Localization efforts across component sourcing networks have been accelerated to counter delays and regional exposure risks. Autonomous driving features at limited automation levels have entered 20% of models produced in high-volume manufacturing regions.

Top Dynamics Driving the Automotive Market Expansion

The automotive market has been reshaped by shifting vehicle demand, electrified drivetrains, and digitized control systems. SUVs and hybrid formats have driven production alignment and procurement patterns across OEMs and suppliers. Regulatory frameworks in OECD and ASEAN countries have pushed R&D toward emission-reduction technologies and alternative powertrains.

Infotainment, ADAS, and in-vehicle connectivity features have entered mass adoption cycles, restructuring value chains from Tier 1 to assembly. Over the 2025 to 2035 period, EV incentives and digital upgrades are expected to drive consistent volume shifts.

Demand Acceleration via Electrified and Connected Mobility

Electric drivetrains have become integrated across 15% of global vehicle production platforms. Investment prioritization has shifted to support hybrid formats and connected services, particularly across OECD cities. Low-emission vehicle incentives have encouraged EV uptake in Europe, China, and India.

Fleet electrification in ASEAN and North America has led to logistics cost reductions. OEMs have retooled production to accommodate these new architectures. Connected vehicles have expanded OEM revenue via telematics and OTA updates. Hybrid vehicle usage has grown in Japan and Germany.

  • Electric powertrain adoption has reached 22% in Western Europe and 16% in China by mid-2025
  • Connected vehicle software contributed over 11% of OEM revenue in South Korea and Germany
  • EV infrastructure growth increased urban charging unit deployment by 34% in OECD cities

Restraints Impacting Market Fluidity and Volume Scalability

Global supply chains have faced disruptions due to rare earth shortages and semiconductor deficits. Battery costs have become volatile due to fluctuations in cobalt and lithium pricing. OEMs in Southeast Asia and Eastern Europe have experienced delayed production cycles.

Supplier networks have struggled to pivot from legacy parts to EV-compatible systems. High capital requirements for electrification and infrastructure have delayed fleet transitions. Regulatory inconsistencies across LATAM and ASEAN have slowed platform certification. Labor shortages continue to impact high-skill assembly operations.

  • Battery pack input costs rose by 9% year-on-year due to raw material volatility
  • Tier 2 supplier attrition rate increased by 6% across Asia-Pacific in 2024
  • Only 57% of registered EV platforms met regulatory alignment in LATAM by 2023

Scope for Expansion via Aftermarket Digitalization and Lightweight Platforms

Aftermarket platforms have captured consumer spending via predictive maintenance and subscription models. Lightweighting with aluminum and composites has improved fuel efficiency in hybrid vehicles. Digital upgrades for navigation, diagnostics, and vehicle security have drawn urban buyers.

Software collaborations have enabled real-time vehicle analytics across new models. Fleet operators have increasingly adopted hybrid low-maintenance formats. Circular design using modular components has reduced production waste. EV systems with V2G capabilities have gained pilot traction in Japan and select EU zones.

  • Digital aftermarket services contributed 13% to global OEM profits in 2024
  • Weight reductions of 70-120 kg reported in vehicles using polymer-carbon composites
  • Hybrid variants formed 27% of all fleet upgrades across Singapore, France, and Canada

Noteworthy Trends Shaping the Future of the Automotive Sector

Vehicle manufacturers have shifted toward mobility services and real-time connectivity. Shared mobility models have expanded urban use cases across OECD economies. Subscription-based ownership and ride-hailing have changed consumer access patterns.

Fuel cell trucks are being deployed in long-haul routes in California, Korea, and Germany. Software-defined architectures now allow frequent feature updates and diagnostics. Manufacturing units have begun sourcing renewable energy across multiple zones. Autonomous and robotics-driven testing is underway in Japan, Israel, and the United States.

  • Software-defined vehicles represented 14% of global releases by mid-2024
  • Shared mobility reached 21% penetration in major OECD urban zones
  • Hydrogen-powered trucks surpassed 1,500 units in Asia-Pacific by Q2 2025

Analyzing Automotive Market by Top Investment Segments

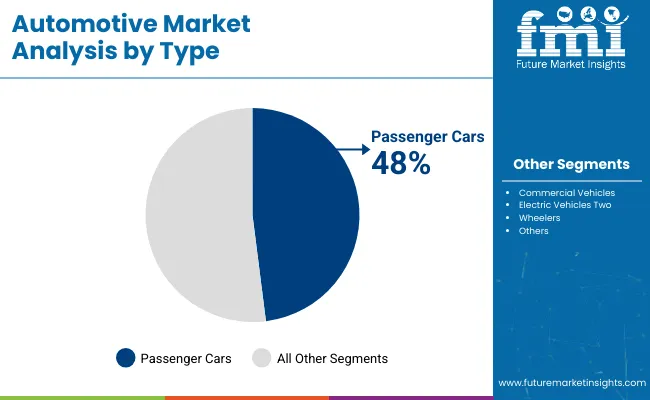
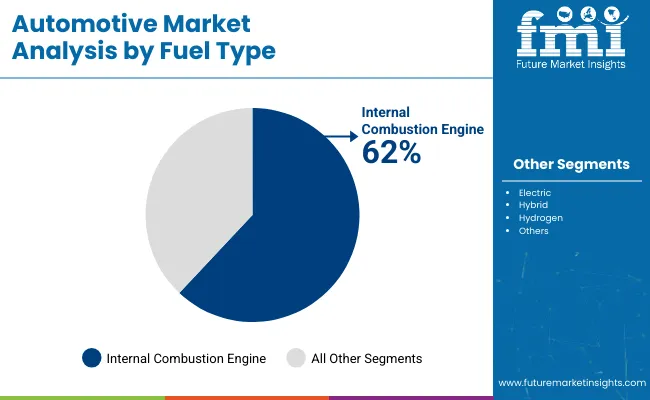
The automotive market in 2025 will be shaped by high-performing segments that continue to dominate global demand patterns. Passenger cars will retain the largest share by type, followed by internal combustion engines as the primary fuel category despite rising electrification.

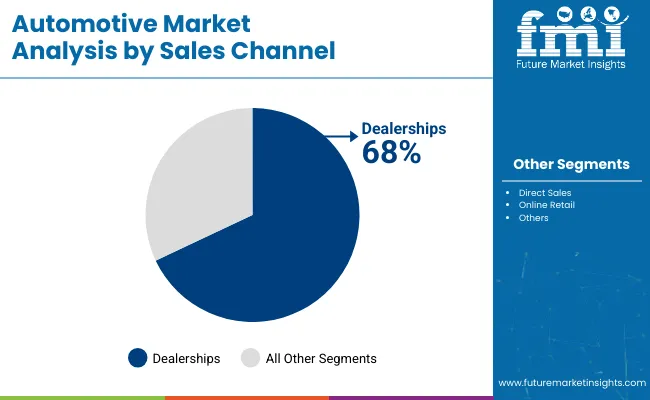
Dealerships remain the leading sales channel due to customer dependence on physical interactions and bundled service options. Compact vehicles will lead based on size preference driven by cost and urban space limitations. While electric vehicles are gaining momentum, they still represent a smaller portion of the total market volume.
Automotive Market By Type

Passenger Cars Lead Demand for Automotive Vehicles

in 2025 Passenger cars are forecasted to hold a dominant 48% market share in 2025 by type, driven by continuous demand from both developed and emerging economies. Companies like Toyota, Hyundai, and Volkswagen are scaling production and investing in new variants, especially hybrid sedans and compact crossovers.

Urban population density and reliance on personal mobility have kept passenger vehicles ahead of other types. Automakers are enhancing fuel efficiency, infotainment systems, and in-vehicle safety features to maintain their competitive edge. The flexibility in design, affordability, and usability across age groups and income classes keeps this segment consistently high in purchase frequency.
  • Hyundai’s Elantra and Toyota’s Corolla accounted for more than 12% of global compact sedan sales
  • Volkswagen invested over USD 1.8 billion to revamp MQB platform for passenger cars
  • ADAS features in passenger cars are expected to be standard in 60% of new models by 2027

Automotive Market By Fuel

Internal Combustion Engines Hold Dominance by 62% Market Share

Iin 2025 Internal combustion engines are expected to maintain their leadership with a 62% market share by fuel type in 2025, supported by widespread infrastructure and affordability across multiple regions. Brands including Honda, Suzuki, and Ford continue to manufacture combustion-powered vehicles for regions with limited EV infrastructure.

The lack of universal EV charging networks, especially in Africa, ASEAN, and Latin America, has allowed ICE models to remain competitive. Enhancements in emission control technologies and dual-fuel variants are helping automakers meet evolving regulatory benchmarks without drastically changing vehicle platforms, making ICEs a transitional solution for most emerging and middle-income automotive markets.
  • Suzuki’s compact ICE models contribute to over 40% of its unit sales in ASEAN markets
  • Ford’s turbocharged EcoBoost engine range remains active in over 50 countries
  • Retrofitting kits for ICE emissions compliance grew 21% YoY across Latin America

Automotive Market By Sales

Dealerships Control Automotive Sales by 68% Share

in 2025 Dealerships will continue to dominate the automotive distribution landscape with a 68% share by sales channel in 2025, supported by consumer trust, financing services, and test-drive access. Brands such as Tata Motors, Kia, and Nissan are expanding dealership footprints in lower-tier cities to capture rural and semi-urban demand.

Digital sales portals remain supplementary, especially for premium and high-value vehicles where physical verification is crucial. Dealerships also manage vehicle registration, insurance, and warranty processing, offering bundled advantages that digital platforms cannot yet replicate at scale. Despite the growth of e-commerce, the value proposition of in-person sales continues to deliver better conversion rates.
  • Kia added 190 dealerships across South Asia and Eastern Europe between 2023 and 2025
  • Test-drive conversion rates at dealerships are over 5x higher than online lead inquiries
  • 70% of SUV buyers still finalize purchases only after showroom inspection

Automotive Market By Vehicle

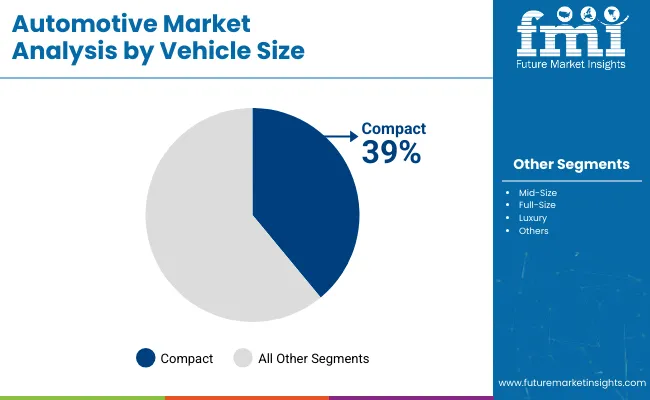
Compact Vehicles Dominate Preferences in 2025 at 39% Share

Compact vehicles are projected to lead by vehicle size with a 39% share in 2025, reflecting sustained consumer interest in low-maintenance, city-friendly, and budget-oriented models. Automakers such as Maruti, Dacia, and Renault are strengthening their position through diverse compact offerings, including hatchbacks and small sedans.

These vehicles benefit from lower registration costs, tax breaks, and fuel savings, especially in urban environments with limited parking. Regulatory frameworks in countries like India and Brazil incentivize sub-4 meter cars, ensuring higher adoption rates. Enhancements such as smart infotainment, crash sensors, and digital dashboards are being added without significantly affecting price brackets.

  • Renault’s Kwid and Dacia’s Sandero represent over 28% of compact car exports in EMEA
  • Compact car insurance premiums are on average 35% lower than mid-size vehicles
  • Sub-4 meter models dominate compact vehicle registrations in India and Brazil

Electric Vehicles Record 15% Share Led by Dedicated Lineups

Electric vehicles are anticipated to capture 15% of the global automotive market by type in 2025, underpinned by government incentives and OEM investments in battery technology. Tesla, BYD, and Volkswagen are leading EV innovation through localized manufacturing and integrated battery supply chains.

EV sales are growing across urban regions in Europe and Asia, where charging infrastructure is more developed and policy support is stronger. Adoption in commercial fleets and car-sharing models is also contributing to volume growth. While EVs still face adoption barriers in terms of price and infrastructure in many countries, OEMs are focusing on modular EV platforms for long-term cost reduction.
  • BYD surpassed 2 million global EV deliveries by early 2025 across sedan and SUV variants
  • Public EV charging installations increased 47% YoY in the Asia Pacific region
  • Tesla’s Model 3 maintained over 22% share in the premium EV sedan segment worldwide

Top Countries Manufacturing, Registering, and Exporting Automotive Market Vehicles

Automotive Market By Country

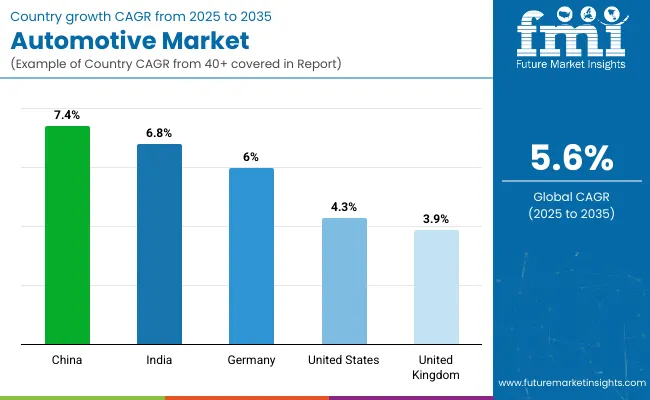
The global automotive market is expected to grow at a CAGR of 5.6% from 2025 to 2035. China (BRICS) records the highest growth at 7.4%, which is 1.8% above the global average. India (BRICS) follows at 6.8%, exceeding the average by 1.2%. Among OECD economies, Germany posts 6.0%, showing a 0.4% advantage. The United States is projected at 4.3%, trailing the global rate by 1.3%, while the United Kingdom shows the lowest at 3.9%, falling short by 1.7%.

The higher growth in BRICS countries reflects volume-led domestic production and policy-linked vehicle manufacturing incentives. OECD markets show lower growth due to mature ownership levels and tighter regulatory compliance timelines. ASEAN countries, although not listed, continue to build local supply chains, with some outperforming OECD averages in assembly and sales growth, especially where tariff-free trade and CKD strategies are being applied within the bloc.

Market Expansion of Automotive Sector in United States

United States is forecast to grow at a CAGR of 4.3%, placing it 23% below the global average. EV growth has remained strongest in coastal states while rural regions continue to favor gasoline-based vehicles. Infrastructure rollouts for electric vehicle charging have been initiated, but regional disparities limit uniform adoption.

Automotive manufacturing has been influenced by retooling delays and semiconductor constraints. Expansion has focused on larger vehicle formats including SUVs and pickups, with sedans experiencing steady decline. Domestic output is being impacted by shifting consumer preferences, labor costs, and the pace of technological integration across OEMs.

  • SUV and pickup trucks made up 48% of new vehicle sales in 2024
  • EV registrations rose 41% YoY, with major gains in California and Texas
  • Retooling investments reached USD 17.2 billion across key manufacturing sites

Market Conditions Driving Automotive Growth in United Kingdom

United Kingdom is anticipated to grow at a CAGR of 3.9%, trailing the global rate by 30%. Trade complexities following Brexit and raw material sourcing limitations have disrupted momentum. Low-emission zones have created urban demand for hybrid models, while battery electric vehicles have underperformed relative to continental benchmarks.

Manufacturing remains reliant on export-oriented luxury models, but localized production volumes have not yet recovered to pre-pandemic levels. Capacity and workforce issues persist, particularly in the Midlands. Strategic repositioning has focused on emissions regulation compliance and retention of European market access.

  • Hybrid vehicle sales expanded 26% following low-emission zone mandates
  • EV penetration reached 18.4% in 2024, behind EU average of 23%
  • Export-focused output rose 7.1%, primarily serving Gulf and European markets

Technical and Regulatory Leverage in Germanys Automotive Market

Germany is expected to expand at a CAGR of 6.0%, slightly above the global benchmark. Regulatory alignment with the European Green Deal has accelerated hybrid and electric vehicle production. Strong performance has been driven by high-margin vehicle exports, with OEM concentration in Bavaria and Baden-Württemberg.

Government-supported battery initiatives have improved production independence. Hydrogen-fueled vehicle R&D has gained public sector backing. Growth has been supported by efficient integration between Tier 1 suppliers and final assemblers, particularly in energy-dense vehicle formats for global export markets.

  • Battery electric vehicles made up 24.7% of all new car registrations in 2024
  • Eleven gigafactories were approved under national battery incentive schemes
  • Auto exports to ASEAN and North America increased 19% YoY in 2024

Supply Chain Scale and Market Velocity in China

China is forecast to grow at a CAGR of 7.4%, outperforming the global average by 32%. Electrification has been pushed through subsidy-supported policies in Tier 2 and Tier 3 cities. NEV (New Energy Vehicle) programs have created dominant domestic brands while reducing dependence on imported components.

Provincial-level manufacturing hubs have been integrated into global trade routes, enabling cost-effective export of assembled vehicles. Sectoral growth has concentrated on low-emission compact models and mid-range EVs serving Southeast Asia and Latin America.

  • NEV models accounted for 38.6% of all vehicle sales in 2024
  • Automotive exports expanded 34% YoY, led by demand in ASEAN markets
  • Domestic automakers achieved 61% EV market share across all segments

Accelerated Penetration and Localization in India’s Automotive Sector

India is projected to grow at a CAGR of 6.8%, second only to China among the profiled nations. Growth has been supported by surging two-wheeler and compact car registrations, primarily in Tier 2 cities. Fiscal incentives have been introduced to localize electric vehicle manufacturing and battery production.

State-level EV policies have encouraged adoption through reduced GST rates and infrastructure grants. Market composition remains dominated by low-cost segments, although mid-range hybrid offerings are gaining traction. Logistics fleet electrification and charging station expansions are supporting broader ecosystem growth.
  • Vehicle registrations rose 18.3% YoY, led by compact car demand
  • Domestic EV output increased 41%, with six states driving policy support
  • Charging station network grew 52% across urban industrial zones

Leading Automotive Manufacturers, Suppliers, and Distributors

Automotive Market Company

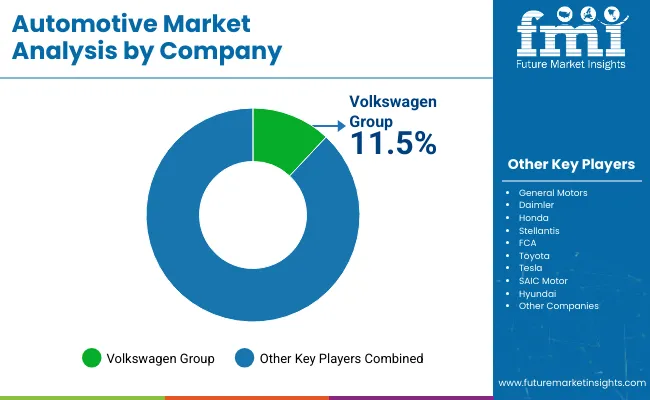
The automotive sector is shaped by dominant manufacturers and evolving regional suppliers who are expanding through model upgrades, dealership growth, and production realignment. Volkswagen Group has maintained market depth by expanding domestic production hubs and upgrading core vehicle lines across multiple regions. General Motors has shifted focus toward localized procurement strategies and platform consolidation, targeting cost optimization in Latin America and Southeast Asia.

Toyota and Honda have refined mid-range offerings to strengthen distribution in high-volume regions. Ford and Groupe Renault have pursued commercial fleet partnerships to improve distribution scale. Tesla has continued to build vertically integrated supply chains through large-scale gigafactory projects in Germany, China, and the USA.

Stellantis and FCA are maximizing shared platforms to reduce production complexity. BMW and Daimler have restructured R&D allocation, with a focus on driveline efficiency and global platform modularity. Hyundai and SAIC Motor are building region-specific models aligned with local demand.

Mid-tier and emerging automotive suppliers have entered new markets through small-scale production, regionally tailored vehicle types, and local distribution alliances. Eastern European and ASEAN-based companies have focused on cost-effective variants supported by government procurement. Distribution partnerships and model co-development with local vendors have enabled faster access to regulated markets. Brand recognition, logistics scale, and compliance costs continue to favor long-term incumbents.

Recent Industry News

  • In May 2025, Volkswagen introduced the Golf GTI in India. This premium hatchback features a range of advanced design elements, including an illuminated VW logo, 18-inch alloy wheels, LED headlamps, GTI badging, a roof-mounted spoiler, LED taillamps, and dual exhaust outlets. During the same month, Nissan announced plans to launch the Micra EV globally in the second half of 2025. Positioned as a modern hatchback, the Micra EV will be powered by a 52-kWh battery pack, with an estimated driving range of approximately 408 km on a single charge.

Leading players

  • Volkswagen Group
  • General Motors
  • Daimler
  • Honda
  • Stellantis
  • FCA
  • Toyota
  • Tesla
  • SAIC Motor
  • Hyundai
  • Groupe Renault
  • Ford
  • BMW
  • Nissan
  • Others

Report Scope

Report Attributes Details
Market Size (2025) USD 4544 billion
Projected Market Size (2035) USD 7822.1 billion
CAGR (2025 to 2035) 5.6%
Base Year for Estimation 2024
Historical Period 2020 to 2024
Projections Period 2025 to 2035
Quantitative Units USD billion for value and volume units as applicable
Vehicle Types Analyzed (Segment 1) Passenger Cars, Commercial Vehicles, Electric Vehicles, Two Wheelers
Fuel Types Analyzed (Segment 2) Internal Combustion Engine, Electric, Hybrid, Hydrogen
Sales Channels Analyzed (Segment 3) Direct Sales, Dealerships, Online Retail
Vehicle Sizes Analyzed (Segment 4) Compact, Mid-Size, Full-Size, Luxury
Regions Covered North America; Latin America; Western Europe; Eastern Europe; Asia Pacific; Middle East and Africa
Countries Covered United States, Canada, Brazil, Mexico, Germany, United Kingdom, France, Italy, China, Japan, India, UAE, South Africa
Key Players Influencing the Market Volkswagen Group, General Motors, Daimler, Honda, Stellantis, FCA, Toyota, Tesla, SAIC Motor, Hyundai, Groupe Renault, Ford, BMW, Nissan, Others
Additional Attributes Dollar sales by vehicle type (EVs, ICE, hybrids) and segment (passenger, commercial), demand driven by electrification and shared mobility, regional leadership in China and North America, innovation in autonomous systems and lightweight materials, environmental gain via lower emissions, and emerging use cases in mobility-as-a-service ecosystems and smart fleet operations.

Automotive Market Analyzed by Key Investment Segments 

By Type:

  • Passenger Cars
  • Commercial Vehicles
  • Electric Vehicles
  • Two Wheelers

By Fuel Type:

  • Internal Combustion Engine
  • Electric
  • Hybrid
  • Hydrogen

By Sales Channel:

  • Direct Sales
  • Dealerships
  • Online Retail

By Vehicle Size:

  • Compact
  • Mid-Size
  • Full-Size
  • Luxury

By Region:

  • North America
  • Latin America
  • Western Europe
  • Eastern Europe
  • Asia Pacific
  • The Middle East and Africa

Table of Content

  1. Executive Summary
    • Global Market Outlook
    • Demand-side Trends
    • Supply-side Trends
    • Technology Roadmap Analysis
    • Analysis and Recommendations
  2. Market Overview
    • Market Coverage / Taxonomy
    • Market Definition / Scope / Limitations
  3. Market Background
    • Market Dynamics
      • Drivers
      • Restraints
      • Opportunity
      • Trends
    • Scenario Forecast
      • Demand in Optimistic Scenario
      • Demand in Likely Scenario
      • Demand in Conservative Scenario
    • Opportunity Map Analysis
    • Product Life Cycle Analysis
    • Supply Chain Analysis
      • Supply Side Participants and their Roles
        • Producers
        • Mid-Level Participants (Traders/ Agents/ Brokers)
        • Wholesalers and Distributors
      • Value Added and Value Created at Node in the Supply Chain
      • List of Raw Material Suppliers
      • List of Existing and Potential Buyer’s
    • Investment Feasibility Matrix
    • Value Chain Analysis
      • Profit Margin Analysis
      • Wholesalers and Distributors
      • Retailers
    • PESTLE and Porter’s Analysis
    • Regulatory Landscape
      • By Key Regions
      • By Key Countries
    • Regional Parent Market Outlook
    • Production and Consumption Statistics
    • Import and Export Statistics
  4. Global Market Analysis 2020 to 2024 and Forecast, 2025 to 2035
    • Historical Market Size Value (USD Billion) & Volume (Units) Analysis, 2020 to 2024
    • Current and Future Market Size Value (USD Billion) & Volume (Units) Projections, 2025 to 2035
      • Y-o-Y Growth Trend Analysis
      • Absolute $ Opportunity Analysis
  5. Global Market Pricing Analysis 2020 to 2024 and Forecast 2025 to 2035
  6. Global Market Analysis 2020 to 2024 and Forecast 2025 to 2035, By Type
    • Introduction / Key Findings
    • Historical Market Size Value (USD Billion) & Volume (Units) Analysis By Type, 2020 to 2024
    • Current and Future Market Size Value (USD Billion) & Volume (Units) Analysis and Forecast By Type, 2025 to 2035
      • Passenger Cars
      • Commercial Vehicles
      • Electric Vehicles
      • Two Wheelers
    • Y-o-Y Growth Trend Analysis By Type, 2020 to 2024
    • Absolute $ Opportunity Analysis By Type, 2025 to 2035
  7. Global Market Analysis 2020 to 2024 and Forecast 2025 to 2035, By Fuel Type
    • Introduction / Key Findings
    • Historical Market Size Value (USD Billion) & Volume (Units) Analysis By Fuel Type, 2020 to 2024
    • Current and Future Market Size Value (USD Billion) & Volume (Units) Analysis and Forecast By Fuel Type, 2025 to 2035
      • Internal Combustion Engine
      • Electric
      • Hybrid
      • Hydrogen
    • Y-o-Y Growth Trend Analysis By Fuel Type, 2020 to 2024
    • Absolute $ Opportunity Analysis By Fuel Type, 2025 to 2035
  8. Global Market Analysis 2020 to 2024 and Forecast 2025 to 2035, By Sales Channel
    • Introduction / Key Findings
    • Historical Market Size Value (USD Billion) & Volume (Units) Analysis By Sales Channel, 2020 to 2024
    • Current and Future Market Size Value (USD Billion) & Volume (Units) Analysis and Forecast By Sales Channel, 2025 to 2035
      • Dealerships
      • Direct Sales
      • Online Retail
    • Y-o-Y Growth Trend Analysis By Sales Channel, 2020 to 2024
    • Absolute $ Opportunity Analysis By Sales Channel, 2025 to 2035
  9. Global Market Analysis 2020 to 2024 and Forecast 2025 to 2035, By Vehicle Size
    • Introduction / Key Findings
    • Historical Market Size Value (USD Billion) & Volume (Units) Analysis By Vehicle Size, 2020 to 2024
    • Current and Future Market Size Value (USD Billion) & Volume (Units) Analysis and Forecast By Vehicle Size, 2025 to 2035
      • Compact
      • Mid-Size
      • Full-Size
      • Luxury
    • Y-o-Y Growth Trend Analysis By Vehicle Size, 2020 to 2024
    • Absolute $ Opportunity Analysis By Vehicle Size, 2025 to 2035
  10. Global Market Analysis 2020 to 2024 and Forecast 2025 to 2035, By Region
    • Introduction
    • Historical Market Size Value (USD Billion) & Volume (Units) Analysis By Region, 2020 to 2024
    • Current Market Size Value (USD Billion) & Volume (Units) Analysis and Forecast By Region, 2025 to 2035
      • North America
      • Latin America
      • Western Europe
      • Eastern Europe
      • East Asia
      • South Asia & Pacific
      • Middle East and Africa
    • Market Attractiveness Analysis By Region
  11. North America Market Analysis 2020 to 2024 and Forecast 2025 to 2035, By Country
    • Historical Market Size Value (USD Billion) & Volume (Units) Trend Analysis By Market Taxonomy, 2020 to 2024
    • Market Size Value (USD Billion) & Volume (Units) Forecast By Market Taxonomy, 2025 to 2035
      • By Country
        • USA
        • Canada
        • Mexico
      • By Type
      • By Fuel Type
      • By Sales Channel
      • By Vehicle Size
    • Market Attractiveness Analysis
      • By Country
      • By Type
      • By Fuel Type
      • By Sales Channel
      • By Vehicle Size
    • Key Takeaways
  12. Latin America Market Analysis 2020 to 2024 and Forecast 2025 to 2035, By Country
    • Historical Market Size Value (USD Billion) & Volume (Units) Trend Analysis By Market Taxonomy, 2020 to 2024
    • Market Size Value (USD Billion) & Volume (Units) Forecast By Market Taxonomy, 2025 to 2035
      • By Country
        • Brazil
        • Argentina
        • Rest of LATAM
      • By Type
      • By Fuel Type
      • By Sales Channel
      • By Vehicle Size
    • Market Attractiveness Analysis
      • By Country
      • By Type
      • By Fuel Type
      • By Sales Channel
      • By Vehicle Size
    • Key Takeaways
  13. Western Europe Market Analysis 2020 to 2024 and Forecast 2025 to 2035, By Country
    • Historical Market Size Value (USD Billion) & Volume (Units) Trend Analysis By Market Taxonomy, 2020 to 2024
    • Market Size Value (USD Billion) & Volume (Units) Forecast By Market Taxonomy, 2025 to 2035
      • By Country
        • Germany
        • Italy
        • France
        • UK
        • Spain
        • BENELUX
        • Nordic
        • Rest of W.Europe
      • By Type
      • By Fuel Type
      • By Sales Channel
      • By Vehicle Size
    • Market Attractiveness Analysis
      • By Country
      • By Type
      • By Fuel Type
      • By Sales Channel
      • By Vehicle Size
    • Key Takeaways
  14. Eastern Europe Market Analysis 2020 to 2024 and Forecast 2025 to 2035, By Country
    • Historical Market Size Value (USD Billion) & Volume (Units) Trend Analysis By Market Taxonomy, 2020 to 2024
    • Market Size Value (USD Billion) & Volume (Units) Forecast By Market Taxonomy, 2025 to 2035
      • By Country
        • Russia
        • Hungary
        • Poland
        • Balkan & Baltics
        • Rest of E. Europe
      • By Type
      • By Fuel Type
      • By Sales Channel
      • By Vehicle Size
    • Market Attractiveness Analysis
      • By Country
      • By Type
      • By Fuel Type
      • By Sales Channel
      • By Vehicle Size
    • Key Takeaways
  15. East Asia Market Analysis 2020 to 2024 and Forecast 2025 to 2035, By Country
    • Historical Market Size Value (USD Billion) & Volume (Units) Trend Analysis By Market Taxonomy, 2020 to 2024
    • Market Size Value (USD Billion) & Volume (Units) Forecast By Market Taxonomy, 2025 to 2035
      • By Country
        • China
        • Japan
        • South Korea
      • By Type
      • By Fuel Type
      • By Sales Channel
      • By Vehicle Size
    • Market Attractiveness Analysis
      • By Country
      • By Type
      • By Fuel Type
      • By Sales Channel
      • By Vehicle Size
    • Key Takeaways
  16. South Asia & Pacific Market Analysis 2020 to 2024 and Forecast 2025 to 2035, By Country
    • Historical Market Size Value (USD Billion) & Volume (Units) Trend Analysis By Market Taxonomy, 2020 to 2024
    • Market Size Value (USD Billion) & Volume (Units) Forecast By Market Taxonomy, 2025 to 2035
      • By Country
        • India
        • Australia & New Zealand
        • ASEAN
        • Rest of SAP
      • By Type
      • By Fuel Type
      • By Sales Channel
      • By Vehicle Size
    • Market Attractiveness Analysis
      • By Country
      • By Type
      • By Fuel Type
      • By Sales Channel
      • By Vehicle Size
    • Key Takeaways
  17. Middle East and Africa Market Analysis 2020 to 2024 and Forecast 2025 to 2035, By Country
    • Historical Market Size Value (USD Billion) & Volume (Units) Trend Analysis By Market Taxonomy, 2020 to 2024
    • Market Size Value (USD Billion) & Volume (Units) Forecast By Market Taxonomy, 2025 to 2035
      • By Country
        • GCC Countries
        • Northern Africa
        • South Africa
        • Turkiye
        • Rest of MEA
      • By Type
      • By Fuel Type
      • By Sales Channel
      • By Vehicle Size
    • Market Attractiveness Analysis
      • By Country
      • By Type
      • By Fuel Type
      • By Sales Channel
      • By Vehicle Size
    • Key Takeaways
  18. Key Countries Market Analysis
    • USA
      • Pricing Analysis
      • Market Share Analysis, 2024
        • By Type
        • By Fuel Type
        • By Sales Channel
        • By Vehicle Size
    • Canada
      • Pricing Analysis
      • Market Share Analysis, 2024
        • By Type
        • By Fuel Type
        • By Sales Channel
        • By Vehicle Size
    • Brazil
      • Pricing Analysis
      • Market Share Analysis, 2024
        • By Type
        • By Fuel Type
        • By Sales Channel
        • By Vehicle Size
    • Mexico
      • Pricing Analysis
      • Market Share Analysis, 2024
        • By Type
        • By Fuel Type
        • By Sales Channel
        • By Vehicle Size
    • Argentina
      • Pricing Analysis
      • Market Share Analysis, 2024
        • By Type
        • By Fuel Type
        • By Sales Channel
        • By Vehicle Size
  19. Market Structure Analysis
    • Competition Dashboard
    • Competition Benchmarking
    • Market Share Analysis of Top Players
      • By Regional
      • By Type
      • By Fuel Type
      • By Sales Channel
      • By Vehicle Size
  20. Competition Analysis
    • Competition Deep Dive
      • Volkswagen Group
        • Overview
        • Product Portfolio
        • Profitability by Market Segments (Product/Age /Sales Channel/Region)
        • Sales Footprint
        • Strategy Overview
          • Marketing Strategy
          • Product Strategy
          • Channel Strategy
      • General Motors
        • Overview
        • Product Portfolio
        • Profitability by Market Segments (Product/Age /Sales Channel/Region)
        • Sales Footprint
        • Strategy Overview
          • Marketing Strategy
          • Product Strategy
          • Channel Strategy
      • Daimler
        • Overview
        • Product Portfolio
        • Profitability by Market Segments (Product/Age /Sales Channel/Region)
        • Sales Footprint
        • Strategy Overview
          • Marketing Strategy
          • Product Strategy
          • Channel Strategy
      • Honda
        • Overview
        • Product Portfolio
        • Profitability by Market Segments (Product/Age /Sales Channel/Region)
        • Sales Footprint
        • Strategy Overview
          • Marketing Strategy
          • Product Strategy
          • Channel Strategy
      • Stellantis
        • Overview
        • Product Portfolio
        • Profitability by Market Segments (Product/Age /Sales Channel/Region)
        • Sales Footprint
        • Strategy Overview
          • Marketing Strategy
          • Product Strategy
          • Channel Strategy
      • FCA
        • Overview
        • Product Portfolio
        • Profitability by Market Segments (Product/Age /Sales Channel/Region)
        • Sales Footprint
        • Strategy Overview
          • Marketing Strategy
          • Product Strategy
          • Channel Strategy
      • Toyota
        • Overview
        • Product Portfolio
        • Profitability by Market Segments (Product/Age /Sales Channel/Region)
        • Sales Footprint
        • Strategy Overview
          • Marketing Strategy
          • Product Strategy
          • Channel Strategy
      • Tesla
        • Overview
        • Product Portfolio
        • Profitability by Market Segments (Product/Age /Sales Channel/Region)
        • Sales Footprint
        • Strategy Overview
          • Marketing Strategy
          • Product Strategy
          • Channel Strategy
      • SAIC Motor
        • Overview
        • Product Portfolio
        • Profitability by Market Segments (Product/Age /Sales Channel/Region)
        • Sales Footprint
        • Strategy Overview
          • Marketing Strategy
          • Product Strategy
          • Channel Strategy
      • Hyundai
        • Overview
        • Product Portfolio
        • Profitability by Market Segments (Product/Age /Sales Channel/Region)
        • Sales Footprint
        • Strategy Overview
          • Marketing Strategy
          • Product Strategy
          • Channel Strategy
      • Groupe Renault
        • Overview
        • Product Portfolio
        • Profitability by Market Segments (Product/Age /Sales Channel/Region)
        • Sales Footprint
        • Strategy Overview
          • Marketing Strategy
          • Product Strategy
          • Channel Strategy
      • Ford
        • Overview
        • Product Portfolio
        • Profitability by Market Segments (Product/Age /Sales Channel/Region)
        • Sales Footprint
        • Strategy Overview
          • Marketing Strategy
          • Product Strategy
          • Channel Strategy
      • BMW
        • Overview
        • Product Portfolio
        • Profitability by Market Segments (Product/Age /Sales Channel/Region)
        • Sales Footprint
        • Strategy Overview
          • Marketing Strategy
          • Product Strategy
          • Channel Strategy
      • Nissan
        • Overview
        • Product Portfolio
        • Profitability by Market Segments (Product/Age /Sales Channel/Region)
        • Sales Footprint
        • Strategy Overview
          • Marketing Strategy
          • Product Strategy
          • Channel Strategy
  21. Assumptions & Acronyms Used
  22. Research Methodology

List of Tables

  • Table 1: Global Market Value (USD Billion) Forecast by Region, 2020-2035
  • Table 2: Global Market Volume (Units) Forecast by Region, 2020-2035
  • Table 3: Global Market Value (USD Billion) Forecast by Type, 2020-2035
  • Table 4: Global Market Volume (Units) Forecast by Type, 2020-2035
  • Table 5: Global Market Value (USD Billion) Forecast by Fuel Type, 2020-2035
  • Table 6: Global Market Volume (Units) Forecast by Fuel Type, 2020-2035
  • Table 7: Global Market Value (USD Billion) Forecast by Sales Channel, 2020-2035
  • Table 8: Global Market Volume (Units) Forecast by Sales Channel, 2020-2035
  • Table 9: Global Market Value (USD Billion) Forecast by Vehicle Size, 2020-2035
  • Table 10: Global Market Volume (Units) Forecast by Vehicle Size, 2020-2035
  • Table 11: North America Market Value (USD Billion) Forecast by Country, 2020-2035
  • Table 12: North America Market Volume (Units) Forecast by Country, 2020-2035
  • Table 13: North America Market Value (USD Billion) Forecast by Type, 2020-2035
  • Table 14: North America Market Volume (Units) Forecast by Type, 2020-2035
  • Table 15: North America Market Value (USD Billion) Forecast by Fuel Type, 2020-2035
  • Table 16: North America Market Volume (Units) Forecast by Fuel Type, 2020-2035
  • Table 17: North America Market Value (USD Billion) Forecast by Sales Channel, 2020-2035
  • Table 18: North America Market Volume (Units) Forecast by Sales Channel, 2020-2035
  • Table 19: North America Market Value (USD Billion) Forecast by Vehicle Size, 2020-2035
  • Table 20: North America Market Volume (Units) Forecast by Vehicle Size, 2020-2035
  • Table 21: Latin America Market Value (USD Billion) Forecast by Country, 2020-2035
  • Table 22: Latin America Market Volume (Units) Forecast by Country, 2020-2035
  • Table 23: Latin America Market Value (USD Billion) Forecast by Type, 2020-2035
  • Table 24: Latin America Market Volume (Units) Forecast by Type, 2020-2035
  • Table 25: Latin America Market Value (USD Billion) Forecast by Fuel Type, 2020-2035
  • Table 26: Latin America Market Volume (Units) Forecast by Fuel Type, 2020-2035
  • Table 27: Latin America Market Value (USD Billion) Forecast by Sales Channel, 2020-2035
  • Table 28: Latin America Market Volume (Units) Forecast by Sales Channel, 2020-2035
  • Table 29: Latin America Market Value (USD Billion) Forecast by Vehicle Size, 2020-2035
  • Table 30: Latin America Market Volume (Units) Forecast by Vehicle Size, 2020-2035
  • Table 31: Western Europe Market Value (USD Billion) Forecast by Country, 2020-2035
  • Table 32: Western Europe Market Volume (Units) Forecast by Country, 2020-2035
  • Table 33: Western Europe Market Value (USD Billion) Forecast by Type, 2020-2035
  • Table 34: Western Europe Market Volume (Units) Forecast by Type, 2020-2035
  • Table 35: Western Europe Market Value (USD Billion) Forecast by Fuel Type, 2020-2035
  • Table 36: Western Europe Market Volume (Units) Forecast by Fuel Type, 2020-2035
  • Table 37: Western Europe Market Value (USD Billion) Forecast by Sales Channel, 2020-2035
  • Table 38: Western Europe Market Volume (Units) Forecast by Sales Channel, 2020-2035
  • Table 39: Western Europe Market Value (USD Billion) Forecast by Vehicle Size, 2020-2035
  • Table 40: Western Europe Market Volume (Units) Forecast by Vehicle Size, 2020-2035
  • Table 41: Eastern Europe Market Value (USD Billion) Forecast by Country, 2020-2035
  • Table 42: Eastern Europe Market Volume (Units) Forecast by Country, 2020-2035
  • Table 43: Eastern Europe Market Value (USD Billion) Forecast by Type, 2020-2035
  • Table 44: Eastern Europe Market Volume (Units) Forecast by Type, 2020-2035
  • Table 45: Eastern Europe Market Value (USD Billion) Forecast by Fuel Type, 2020-2035
  • Table 46: Eastern Europe Market Volume (Units) Forecast by Fuel Type, 2020-2035
  • Table 47: Eastern Europe Market Value (USD Billion) Forecast by Sales Channel, 2020-2035
  • Table 48: Eastern Europe Market Volume (Units) Forecast by Sales Channel, 2020-2035
  • Table 49: Eastern Europe Market Value (USD Billion) Forecast by Vehicle Size, 2020-2035
  • Table 50: Eastern Europe Market Volume (Units) Forecast by Vehicle Size, 2020-2035
  • Table 51: East Asia Market Value (USD Billion) Forecast by Country, 2020-2035
  • Table 52: East Asia Market Volume (Units) Forecast by Country, 2020-2035
  • Table 53: East Asia Market Value (USD Billion) Forecast by Type, 2020-2035
  • Table 54: East Asia Market Volume (Units) Forecast by Type, 2020-2035
  • Table 55: East Asia Market Value (USD Billion) Forecast by Fuel Type, 2020-2035
  • Table 56: East Asia Market Volume (Units) Forecast by Fuel Type, 2020-2035
  • Table 57: East Asia Market Value (USD Billion) Forecast by Sales Channel, 2020-2035
  • Table 58: East Asia Market Volume (Units) Forecast by Sales Channel, 2020-2035
  • Table 59: East Asia Market Value (USD Billion) Forecast by Vehicle Size, 2020-2035
  • Table 60: East Asia Market Volume (Units) Forecast by Vehicle Size, 2020-2035
  • Table 61: South Asia & Pacific Market Value (USD Billion) Forecast by Country, 2020-2035
  • Table 62: South Asia & Pacific Market Volume (Units) Forecast by Country, 2020-2035
  • Table 63: South Asia & Pacific Market Value (USD Billion) Forecast by Type, 2020-2035
  • Table 64: South Asia & Pacific Market Volume (Units) Forecast by Type, 2020-2035
  • Table 65: South Asia & Pacific Market Value (USD Billion) Forecast by Fuel Type, 2020-2035
  • Table 66: South Asia & Pacific Market Volume (Units) Forecast by Fuel Type, 2020-2035
  • Table 67: South Asia & Pacific Market Value (USD Billion) Forecast by Sales Channel, 2020-2035
  • Table 68: South Asia & Pacific Market Volume (Units) Forecast by Sales Channel, 2020-2035
  • Table 69: South Asia & Pacific Market Value (USD Billion) Forecast by Vehicle Size, 2020-2035
  • Table 70: South Asia & Pacific Market Volume (Units) Forecast by Vehicle Size, 2020-2035
  • Table 71: Middle East and Africa Market Value (USD Billion) Forecast by Country, 2020-2035
  • Table 72: Middle East and Africa Market Volume (Units) Forecast by Country, 2020-2035
  • Table 73: Middle East and Africa Market Value (USD Billion) Forecast by Type, 2020-2035
  • Table 74: Middle East and Africa Market Volume (Units) Forecast by Type, 2020-2035
  • Table 75: Middle East and Africa Market Value (USD Billion) Forecast by Fuel Type, 2020-2035
  • Table 76: Middle East and Africa Market Volume (Units) Forecast by Fuel Type, 2020-2035
  • Table 77: Middle East and Africa Market Value (USD Billion) Forecast by Sales Channel, 2020-2035
  • Table 78: Middle East and Africa Market Volume (Units) Forecast by Sales Channel, 2020-2035
  • Table 79: Middle East and Africa Market Value (USD Billion) Forecast by Vehicle Size, 2020-2035
  • Table 80: Middle East and Africa Market Volume (Units) Forecast by Vehicle Size, 2020-2035

List of Figures

  • Figure 1: Global Market Volume (Units) Forecast 2020-2035
  • Figure 2: Global Market Pricing Analysis
  • Figure 3: Global Market Value (USD Billion) Forecast 2020-2035
  • Figure 4: Global Market Value Share and BPS Analysis by Type, 2025 and 2035
  • Figure 5: Global Market Y-o-Y Growth Comparison by Type, 2025-2035
  • Figure 6: Global Market Attractiveness Analysis by Type
  • Figure 7: Global Market Value Share and BPS Analysis by Fuel Type, 2025 and 2035
  • Figure 8: Global Market Y-o-Y Growth Comparison by Fuel Type, 2025-2035
  • Figure 9: Global Market Attractiveness Analysis by Fuel Type
  • Figure 10: Global Market Value Share and BPS Analysis by Sales Channel, 2025 and 2035
  • Figure 11: Global Market Y-o-Y Growth Comparison by Sales Channel, 2025-2035
  • Figure 12: Global Market Attractiveness Analysis by Sales Channel
  • Figure 13: Global Market Value Share and BPS Analysis by Vehicle Size, 2025 and 2035
  • Figure 14: Global Market Y-o-Y Growth Comparison by Vehicle Size, 2025-2035
  • Figure 15: Global Market Attractiveness Analysis by Vehicle Size
  • Figure 16: Global Market Value (USD Billion) Share and BPS Analysis by Region, 2025 and 2035
  • Figure 17: Global Market Y-o-Y Growth Comparison by Region, 2025-2035
  • Figure 18: Global Market Attractiveness Analysis by Region
  • Figure 19: North America Market Incremental $ Opportunity, 2025-2035
  • Figure 20: Latin America Market Incremental $ Opportunity, 2025-2035
  • Figure 21: Western Europe Market Incremental $ Opportunity, 2025-2035
  • Figure 22: Eastern Europe Market Incremental $ Opportunity, 2025-2035
  • Figure 23: East Asia Market Incremental $ Opportunity, 2025-2035
  • Figure 24: South Asia & Pacific Market Incremental $ Opportunity, 2025-2035
  • Figure 25: Middle East and Africa Market Incremental $ Opportunity, 2025-2035
  • Figure 26: North America Market Value Share and BPS Analysis by Country, 2025 and 2035
  • Figure 27: North America Market Value Share and BPS Analysis by Type, 2025 and 2035
  • Figure 28: North America Market Y-o-Y Growth Comparison by Type, 2025-2035
  • Figure 29: North America Market Attractiveness Analysis by Type
  • Figure 30: North America Market Value Share and BPS Analysis by Fuel Type, 2025 and 2035
  • Figure 31: North America Market Y-o-Y Growth Comparison by Fuel Type, 2025-2035
  • Figure 32: North America Market Attractiveness Analysis by Fuel Type
  • Figure 33: North America Market Value Share and BPS Analysis by Sales Channel, 2025 and 2035
  • Figure 34: North America Market Y-o-Y Growth Comparison by Sales Channel, 2025-2035
  • Figure 35: North America Market Attractiveness Analysis by Sales Channel
  • Figure 36: North America Market Value Share and BPS Analysis by Vehicle Size, 2025 and 2035
  • Figure 37: North America Market Y-o-Y Growth Comparison by Vehicle Size, 2025-2035
  • Figure 38: North America Market Attractiveness Analysis by Vehicle Size
  • Figure 39: Latin America Market Value Share and BPS Analysis by Country, 2025 and 2035
  • Figure 40: Latin America Market Value Share and BPS Analysis by Type, 2025 and 2035
  • Figure 41: Latin America Market Y-o-Y Growth Comparison by Type, 2025-2035
  • Figure 42: Latin America Market Attractiveness Analysis by Type
  • Figure 43: Latin America Market Value Share and BPS Analysis by Fuel Type, 2025 and 2035
  • Figure 44: Latin America Market Y-o-Y Growth Comparison by Fuel Type, 2025-2035
  • Figure 45: Latin America Market Attractiveness Analysis by Fuel Type
  • Figure 46: Latin America Market Value Share and BPS Analysis by Sales Channel, 2025 and 2035
  • Figure 47: Latin America Market Y-o-Y Growth Comparison by Sales Channel, 2025-2035
  • Figure 48: Latin America Market Attractiveness Analysis by Sales Channel
  • Figure 49: Latin America Market Value Share and BPS Analysis by Vehicle Size, 2025 and 2035
  • Figure 50: Latin America Market Y-o-Y Growth Comparison by Vehicle Size, 2025-2035
  • Figure 51: Latin America Market Attractiveness Analysis by Vehicle Size
  • Figure 52: Western Europe Market Value Share and BPS Analysis by Country, 2025 and 2035
  • Figure 53: Western Europe Market Value Share and BPS Analysis by Type, 2025 and 2035
  • Figure 54: Western Europe Market Y-o-Y Growth Comparison by Type, 2025-2035
  • Figure 55: Western Europe Market Attractiveness Analysis by Type
  • Figure 56: Western Europe Market Value Share and BPS Analysis by Fuel Type, 2025 and 2035
  • Figure 57: Western Europe Market Y-o-Y Growth Comparison by Fuel Type, 2025-2035
  • Figure 58: Western Europe Market Attractiveness Analysis by Fuel Type
  • Figure 59: Western Europe Market Value Share and BPS Analysis by Sales Channel, 2025 and 2035
  • Figure 60: Western Europe Market Y-o-Y Growth Comparison by Sales Channel, 2025-2035
  • Figure 61: Western Europe Market Attractiveness Analysis by Sales Channel
  • Figure 62: Western Europe Market Value Share and BPS Analysis by Vehicle Size, 2025 and 2035
  • Figure 63: Western Europe Market Y-o-Y Growth Comparison by Vehicle Size, 2025-2035
  • Figure 64: Western Europe Market Attractiveness Analysis by Vehicle Size
  • Figure 65: Eastern Europe Market Value Share and BPS Analysis by Country, 2025 and 2035
  • Figure 66: Eastern Europe Market Value Share and BPS Analysis by Type, 2025 and 2035
  • Figure 67: Eastern Europe Market Y-o-Y Growth Comparison by Type, 2025-2035
  • Figure 68: Eastern Europe Market Attractiveness Analysis by Type
  • Figure 69: Eastern Europe Market Value Share and BPS Analysis by Fuel Type, 2025 and 2035
  • Figure 70: Eastern Europe Market Y-o-Y Growth Comparison by Fuel Type, 2025-2035
  • Figure 71: Eastern Europe Market Attractiveness Analysis by Fuel Type
  • Figure 72: Eastern Europe Market Value Share and BPS Analysis by Sales Channel, 2025 and 2035
  • Figure 73: Eastern Europe Market Y-o-Y Growth Comparison by Sales Channel, 2025-2035
  • Figure 74: Eastern Europe Market Attractiveness Analysis by Sales Channel
  • Figure 75: Eastern Europe Market Value Share and BPS Analysis by Vehicle Size, 2025 and 2035
  • Figure 76: Eastern Europe Market Y-o-Y Growth Comparison by Vehicle Size, 2025-2035
  • Figure 77: Eastern Europe Market Attractiveness Analysis by Vehicle Size
  • Figure 78: East Asia Market Value Share and BPS Analysis by Country, 2025 and 2035
  • Figure 79: East Asia Market Value Share and BPS Analysis by Type, 2025 and 2035
  • Figure 80: East Asia Market Y-o-Y Growth Comparison by Type, 2025-2035
  • Figure 81: East Asia Market Attractiveness Analysis by Type
  • Figure 82: East Asia Market Value Share and BPS Analysis by Fuel Type, 2025 and 2035
  • Figure 83: East Asia Market Y-o-Y Growth Comparison by Fuel Type, 2025-2035
  • Figure 84: East Asia Market Attractiveness Analysis by Fuel Type
  • Figure 85: East Asia Market Value Share and BPS Analysis by Sales Channel, 2025 and 2035
  • Figure 86: East Asia Market Y-o-Y Growth Comparison by Sales Channel, 2025-2035
  • Figure 87: East Asia Market Attractiveness Analysis by Sales Channel
  • Figure 88: East Asia Market Value Share and BPS Analysis by Vehicle Size, 2025 and 2035
  • Figure 89: East Asia Market Y-o-Y Growth Comparison by Vehicle Size, 2025-2035
  • Figure 90: East Asia Market Attractiveness Analysis by Vehicle Size
  • Figure 91: South Asia & Pacific Market Value Share and BPS Analysis by Country, 2025 and 2035
  • Figure 92: South Asia & Pacific Market Value Share and BPS Analysis by Type, 2025 and 2035
  • Figure 93: South Asia & Pacific Market Y-o-Y Growth Comparison by Type, 2025-2035
  • Figure 94: South Asia & Pacific Market Attractiveness Analysis by Type
  • Figure 95: South Asia & Pacific Market Value Share and BPS Analysis by Fuel Type, 2025 and 2035
  • Figure 96: South Asia & Pacific Market Y-o-Y Growth Comparison by Fuel Type, 2025-2035
  • Figure 97: South Asia & Pacific Market Attractiveness Analysis by Fuel Type
  • Figure 98: South Asia & Pacific Market Value Share and BPS Analysis by Sales Channel, 2025 and 2035
  • Figure 99: South Asia & Pacific Market Y-o-Y Growth Comparison by Sales Channel, 2025-2035
  • Figure 100: South Asia & Pacific Market Attractiveness Analysis by Sales Channel
  • Figure 101: South Asia & Pacific Market Value Share and BPS Analysis by Vehicle Size, 2025 and 2035
  • Figure 102: South Asia & Pacific Market Y-o-Y Growth Comparison by Vehicle Size, 2025-2035
  • Figure 103: South Asia & Pacific Market Attractiveness Analysis by Vehicle Size
  • Figure 104: Middle East and Africa Market Value Share and BPS Analysis by Country, 2025 and 2035
  • Figure 105: Middle East and Africa Market Value Share and BPS Analysis by Type, 2025 and 2035
  • Figure 106: Middle East and Africa Market Y-o-Y Growth Comparison by Type, 2025-2035
  • Figure 107: Middle East and Africa Market Attractiveness Analysis by Type
  • Figure 108: Middle East and Africa Market Value Share and BPS Analysis by Fuel Type, 2025 and 2035
  • Figure 109: Middle East and Africa Market Y-o-Y Growth Comparison by Fuel Type, 2025-2035
  • Figure 110: Middle East and Africa Market Attractiveness Analysis by Fuel Type
  • Figure 111: Middle East and Africa Market Value Share and BPS Analysis by Sales Channel, 2025 and 2035
  • Figure 112: Middle East and Africa Market Y-o-Y Growth Comparison by Sales Channel, 2025-2035
  • Figure 113: Middle East and Africa Market Attractiveness Analysis by Sales Channel
  • Figure 114: Middle East and Africa Market Value Share and BPS Analysis by Vehicle Size, 2025 and 2035
  • Figure 115: Middle East and Africa Market Y-o-Y Growth Comparison by Vehicle Size, 2025-2035
  • Figure 116: Middle East and Africa Market Attractiveness Analysis by Vehicle Size
  • Figure 117: Global Market - Tier Structure Analysis
  • Figure 118: Global Market - Company Share Analysis

Frequently Asked Questions

What is the projected size of the global automotive market by 2035?

The market is expected to reach USD 7822.1 billion by 2035.

What CAGR will the automotive market register from 2025 to 2035?

The global market is projected to grow at a 5.6% CAGR during this period.

What share will passenger cars hold in the automotive market by 2025?

Passenger cars are forecast to account for 48% of total vehicle sales in 2025.

What is the expected market share of internal combustion engines in 2025?

Internal combustion engines are anticipated to hold a 62% share by fuel type in 2025.

Which leading player holds the highest industry share in 2025?

Volkswagen Group leads with an 11.5% share of the global automotive market.

Explore Similar Insights

Future Market Insights

Automotive Market