This site uses cookies, including third-party cookies, that help us to provide and improve our services.

Privacy Policy
- Global Locations -
Headquarters
Future Market Insights, Inc.
Christiana Corporate, 200 Continental Drive, Suite 401, Newark, Delaware - 19713, United States
T: +1-845-579-5705
MEA
Market Access DMCC

1602-6 Jumeirah Bay X2 Tower, Plot No: JLT-PH2-X2A,

Jumeirah Lakes Towers, Dubai,

United Arab Emirates

Americas
Future Market Insights
616 Corporate Way, Suite 2-9018,
Valley Cottage, NY 10989,
United States
T: +1-347-918-3531
Europe
Future Market Insights
3rd Floor, 207 Regent Street,
London W1B 3HH
United Kingdom
T: + 44 (0) 20 8123 9659
D: +44 (0) 20 3287 4268
APAC
Future Market Insights
Office No. 401-A, 4th Floor,
VANTAGE 9, S.No. 36/1/1,
Baner, Pune 411045 India

Automotive Camshaft Market

Industry 4.0 Compliant Production Process to Empower Automotive Camshaft Manufacturers to Forge Ahead: Astute Insights for 30+ Countries Brought to you by FMI Experts

Automotive Camshaft Market By Product Type, Vehicle Type, Sales Channel & Region | Forecast 2023 to 2033

Automotive Camshaft Market Outlook (2023 to 2033)

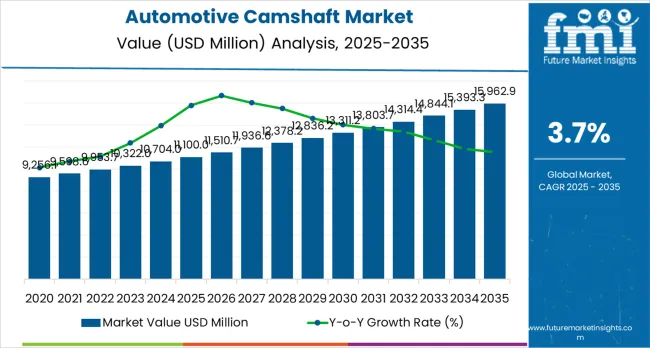
As per Future Market Insights’ analysis, the global automotive camshaft market is predicted to attain US$ 3.5 Billion by 2023. The sales of the automotive camshaft are slated to rise at a CAGR of 4.7% to record a market valuation of US$ 5.6 Billion by 2033 end. In the oncoming years, the market is expected to be shaped by certain factors as follows:

  • Growth of automotive camshaft market segments due to increasing demand for high-performance automotive
  • Shifting automotive camshaft manufacturers towards the production of mechatronic products and sensory components to ensure adherence with Industry 4.0
  • Stern government laws against the release of GHG emissions from vehicle exhaust
  • Development of new models and breakthrough technologies
  • The emerging trend of engine downsizing
  • The ability of automotive camshaft phase variation to empower combustion engine of vehicles to run at high-energy and fuel-efficient mode.

Market Value (2023)

US$ 3.5 Billion

Market Forecast Value (2033)

US$ 5.6 Billion

Market CAGR (2023 to 2033)

4.7%

Don't pay for what you don't need

Customize your report by selecting specific countries or regions and save 30%!

Automotive Camshaft Manufacturers to Upscale their Performance

Automotive camshafts play a crucial role in enhancing the engine’s foundational operation. They have been extensively used in current as well as Vintage Overhead-cam (OCH) engines. In recent years, technologies pertinent to internal combustion engines have shown steady growth, with an intent to appreciate the efficiency and performance of vehicles. This is in line with the new developments of the automobile industry, which is relentlessly striving to launch lightweight vehicles that lower GHG emissions and enhance fuel efficiency. Manufacturers providing automotive camshafts are increasingly developing new solutions that meet all these parameters.

Growing Buzz Around DOHC to Boost Automotive Camshaft Market

The automotive camshaft market is driven by the rising production of vehicles and heightened demand for modern and more complex engines. Further, the rising replacement of dated and obsolete engines worldwide is also impacting the market positively. Additionally, the rising popularity of double overhead camshafts (DOHC) in recent times as it boosts engine performance and fuel efficiency is spurring market growth.

Nikhil Kaitwade
Nikhil Kaitwade
Principal Consultant
LinkedIn
Talk to Analyst

Find your sweet spots for generating winning opportunities in this market.

Talk to Analyst

Factors Limiting Market Growth

The market growth is likely to be hampered by some unfavorable variables in the years ahead. The growing shift towards the adoption of electric vehicles is a major looming threat to the market. It may render the internal combustion engine and its ancillary products obsolete, which might impact demand and sales of the product.

Further, the suppliers of automotive components always have to keep pace with the evolving and stringent government policies, which might turn out to be unfavorable for automotive camshafts manufacturers. Additionally, the increasing maintenance costs of new versions of camshafts may hinder their adoption in the coming years.

Automotive Camshaft Market Future Outlook for 2023 to 2033 Brighter in Comparison to Historic Sales

The global automotive camshaft market registered a growth of 3.9% CAGR between 2017 to 2022 and is projected to be worth US$3.5 Billion in 2023.

The growing focus of automakers toward the inclusion of side shaft systems for hybrid vehicles and the emerging trend of engine downsizing is expected to positively influence the demand outlook over the forecast period.

Attribute

2025

Valuation

US$ 3.84 Billion

Attribute

2028

Valuation

US$ 4.40 Billion

Attribute

2032

Valuation

US$ 5.29 Billion

  • Short Term (2023 to 2026): The market growth is expected to forge ahead owing to the increasing adoption of hybrid vehicles. Besides, the expanding aftermarket for vehicle camshafts is projected to have a positive influence on market growth.
  • Medium Term (2026 to 2029): The growth prospects for automotive camshaft manufacturers are expected to be interconnected with technological advancements in the main market. Striking upgrades in valve technologies and surging adoption of software tools to enhance the automotive camshafts’ design are anticipated to spur market progress.
  • Long Term (2029 to 2033): The growing focus of manufacturers to reduce the overall weight of automotives, and the growing move towards sustainability, are expected to create healthy growth prospects in the future periods.

On the back of these factors, sales in the automotive camshaft market are likely to reach a valuation of US$ 5.6 Billion by 2033.

Historical CAGR (2017 to 2022)

Forecast CAGR (2023 to 2033)

3.9%

4.7%

Get the data you need at a Fraction of the cost

Personalize your report by choosing insights you need
and save 40%!

Comparative Analysis of Adjacent Markets

Automotive Camshaft Market:

Differentiating Aspects

Automotive Camshaft Market

CAGR (Forecast Period)

4.7%

Market Valuation in 2023

US$ 3.5 Billion

Projected Market Value in 2033

US$ 5.6 Billion

Growth Factors

Heightened interest in hybrid vehicles

Trends

Increasing utilization of software tools to better the design element of automotive camshaft

Opportunities

Increasing demand from manufacturers to integrate digitalization with conventional manufacturing processes

Start Stop System Market:

Differentiating Aspects

Start Stop System Market

CAGR (Forecast Period)

14.5%

Market Valuation in 2023

US$ 8,081.41 Million

Projected Market Value in 2033

US$ 31,299.83 Million

Growth Factors

Rising demand for automotive that promote fuel-efficiency

Trends

The surge in vehicle hybridization

Opportunities

Increasing initiatives by government bodies across the globe to reduce overall emissions

Hybrid Vehicles Market:

Differentiating Aspects

Hybrid Vehicles Market

CAGR (Forecast Period)

21.6%

Market Valuation in 2023

US$ 234.32 Billion

Projected Market Value in 2033

US$ 1,656.35 Billion

Growth Factors

Growing buzz around plug-in hybrid vehicles

Trends

Launch of novel and energy-saving models of hybrid automotives

Opportunities

Research and Development activities aimed at making technological advancements

Country-wise Analysis

Country

China

CAGR (2023 to 2033)

5.5%

Market Size (2033)

US$ 1.6 Billion

Country

USA

CAGR (2023 to 2033)

3.8%

Market Size (2033)

US$ 651.8 Million

Country

Japan

CAGR (2023 to 2033)

3.9%

Market Size (2033)

US$ 483.2 Million

Country

India

CAGR (2023 to 2033)

6.3%

Market Size (2033)

US$ 305.1 Million

Country

United Kingdom

CAGR (2023 to 2033)

3.7%

Market Size (2033)

US$ 97.8 Million

China to Rule the Automotive Camshaft Market

Attributes

Details

Market Size (2033)

US$ 1.6 Billion

Market Absolute Dollar Growth (US$ Million/Billion)

US$ 655.2 Million

China is forecast to assert its dominance in the global automotive camshaft market. By 2033, the market is set to account for US$ 1.6 Billion. The 5.5% CAGR estimated for China is second to India which is set to grow at the fastest CAGR of 6.3%. The China market is being catalyzed by the increase in the production of passenger cars, heavy trucks, and trailers in the region. Additionally, the increasing demand for commercial vehicles like HEV, and luxury cars, is propelling the product demand. Certain factors like inflating purchasing power, rising per capita income, and economic development are creating profitable business opportunities for major players based in China.

Historical CAGR (2017 to 2022)

Forecast CAGR (2023 to 2033)

4.4%

5.5%

Toyota’s ‘Crown’, Designed for a New Era, to Hit American Shores Again

Attributes

Details

Market Size (2033)

US$ 651.8 Million

Market Absolute Dollar Growth (US$ Million/Billion)

US$ 200.9 Million

The USA is anticipated to be the second-largest market for automotive camshafts over the forecast period. The net worth of the USA automotive camshaft market would reach US$ 651.8 Million by 2033, multiplying at a CAGR of 3.8%. The market is predicted to grow on the back of revised car models making the route to enter the USA For instance, in July 2022, Toyota announced the launch of revamped Crown car models- sedan, wagon, sport, and crossover.

The company will introduce Crown to the USA in three distinct grades- Limited, XLE, and Platinum. These will also have a choice of two disparate hybrid powertrains- fourth-generation Toyota Hybrid System (THS) or HYBRID MAX (exclusive to Platinum). The gas engine used in the 4th-Gen Toyota Hybrid System employs Variable Valve Timing (VVT), and VVT-I, for the intake and exhaust camshaft respectively. The adjustable range for the valve timings for intake and exhaust would help maximize fuel output and consumption.

Historical CAGR (2017 to 2022)

Forecast CAGR (2023 to 2033)

3%

3.8%

Development of New Automotive Camshafts Boosting Market Growth in Japan

Attributes

Details

Market Size (2033)

US$ 483.2 Million

Market Absolute Dollar Growth (US$ Million/Billion)

US$ 154.9 Million

The Japanese automotive camshaft market is predicted to make a significant contribution to the Asia Pacific market. The regional market is estimated to attain a second-largest position in Asia-Pacific (APAC), achieving US$ 483.2 Million by 2033. The development of new camshaft sensors that provide enhanced functionality is expected to propel market growth in the forecast period.

These sensors provide hybrid vehicle engines with end uses in off-road vehicles, two-wheelers, and application designs, that require enhanced air gap performance. These sensors assist engine designers to mitigate system complexity and lower the consumption of cost and energy. Thus, raising efficiency and reducing carbon footprints.

Historical CAGR (2017 to 2022)

Forecast CAGR (2023 to 2033)

3.6%

3.9%

India to Run at a Fast Track in the coming Years

Attributes

Details

Market Size (2033)

US$ 305.1 Million

Market Absolute Dollar Growth (US$ Million/Billion)

US$ 139.4 Million

The Indian automotive camshaft market is projected to attain a market value of US$ 305.1 Million by 2033. Growing at the fastest CAGR of 6.3%, the market is set to observe several developments in the span of the next 10 years. For instance, in September 2022, BorgWarner Morse Systems India, which manufactures engine timing components for commercial trucks, cars, and motorcycles, introduced its second plant near Chennai. The company is well-positioned to meet the dynamic demands of the automotive industry by introducing BorgWarner’s VCT technology. This technology enhances efficiency and helps combustion-powered vehicles to lower emissions.

The inaugurated plant has large manufacturing, accumulation, and storage space developed for Variable Camshaft Timing (VCT) systems. Increasing demand for VCT leads to the expansion of BorgWarner Morse Systems India.

Historical CAGR (2017 to 2022)

Forecast CAGR (2023 to 2033)

5.2%

6.3%

Surging New Car Registrations to Boost the Demand for Automotive Camshafts in the UK

Attributes

Details

Market Size (2033)

US$ 97.8 Million

Market Absolute Dollar Growth (US$ Million/Billion)

US$ 30.1 Million

The United Kingdom market is anticipated to climb up to over US$ 97.8 Million by 2033. The market is set to record a CAGR of 3.7% over the forecast period. Increasing sales of passenger cars in the country is expected to strongly influence the market expansion of automotive camshafts. As per recent government estimates, new car registrations in the UK consisted of 206,000 petrol cars, 35,000 diesel cars, and 72,000 petrol HEV cars, respectively representing 53%, 9%, and 18% of all car registrations in the UK. In comparison with 2021 Quarter 2 (April to June), HEV car registrations were up by 3% in 2022.

Historical CAGR (2017 to 2022)

Forecast CAGR (2023 to 2033)

3.2%

3.7%

Category-wise Insights

Taxonomy

Product Type

Top Segment

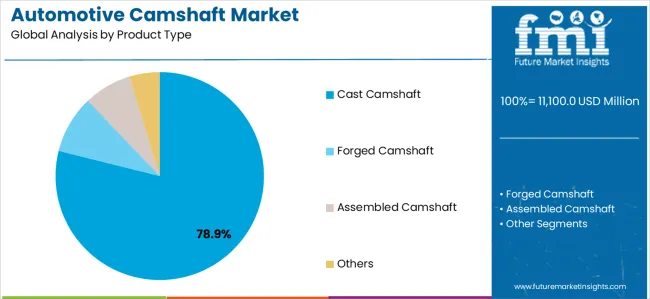
Cast

Forecast CAGR

4.6%

Taxonomy

Vehicle Type

Top Segment

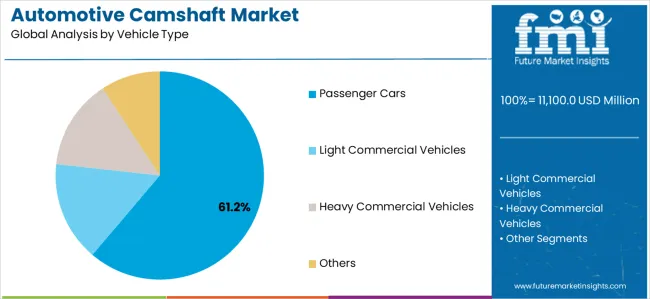
Passenger Car

Forecast CAGR

4.8%

Cast Camshaft to Emerge as Top-selling Product

The automotive camshaft market is mainly driven by the increasing demand for passenger cars and commercial vehicles in the emerging economies of the world. Owing to advantages such as smooth surface finish, dimensional accuracy, and others, demand for casted automotive components has shown a considerable increase.

This trend is expected to continue and demand for cast camshafts is expected to show a significant uptake in the market. Growth in the sales of passenger cars and commercial vehicles is expected to directly impact the automotive camshafts market.

Additionally, growth being witnessed in the sales of the cast camshaft segment will help drive the automotive camshaft market over the forecast period. Moreover, due to increasing investments in the development of infrastructure, especially in the Asia Pacific countries, such as India and ASEAN, the production of heavy trucks and trailers has also increased.

Thus, increasing vehicle fleet size is predicted to drive the automotive camshaft market over the forecast period.

Historical CAGR (2017 to 2022)

Forecast CAGR (2023 to 2033)

3.8%

4.6%

Expansion of Manufacturing Capabilities Presenting Growth Prospects in Developing Markets

Lucrative growth of the automotive industry is anticipated to fuel the demand for automotive camshafts in the market. Consequently, encouraging manufacturers to expand their production facilities for automotive camshafts.

Readily available capital for the expansion of existing manufacturing facilities as well as for the development of new manufacturing facilities for automotive camshafts in the developing regions is expected to propel market growth. This, along with the increasing demand for automotive camshafts from the automobile industry is expected to fuel the production volumes of automotive camshafts in these regions.

The rising demand for automotive camshafts is projected to grow alongside growth in demand for light commercial vehicles. Over the stipulated time frame, passenger cars are anticipated to grow at a CAGR of 4.8%, an increase from the 4.2% CAGR witnessed in the historical period.

OEM Segment to Remain the Preferred Sales Channel

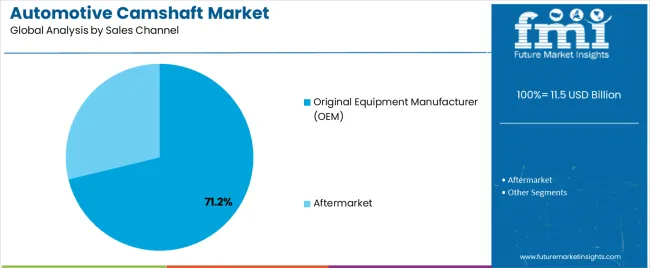
The original equipment manufacturer (OEM) segment is expected to drive the growth of the automotive camshaft market. Owing to their durability and high strength, the replacement rate of automotive camshafts is low. Currently, camshaft manufacturers are focusing on producing lightweight and more durable products, which is predicted to increase the life span of automotive camshafts as well as automobiles.

This is forecast to increase the OEM segment share in the automotive camshaft market. The OEM segment is expected to grow at a significant pace over the years to come. Moreover, this segment is predicted to account for a substantial market share in the forecast period, growing up on the momentum built in the historical period.

Key Industry Players to Exert their Way Forward

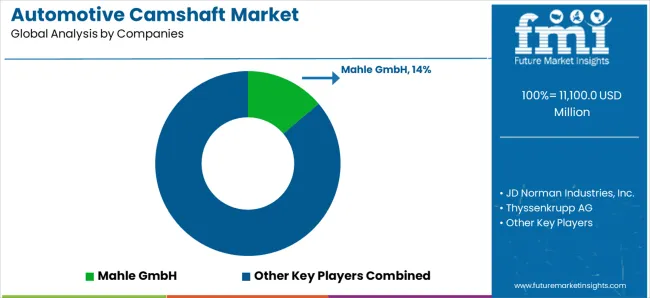
FMI projects the top automotive camshaft players, including Thyssenkrupp AG, Mahle GmbH, Precision Camshaft Limited, KAUTEX TEXTRON GmbH & Co. KG, and Linamar Corporation to account for a substantial share in the years ahead.

As competition is consistently rising, market players are expected to focus on strategic collaborations to gain an edge over their peers.

For instance, in 2018, Precision Camshafts Ltd., a leading manufacturer of auto components, announced the acquisition of a 76% stake in Germany-based firm Motorean and Fahrzeugtechnik GmbH (MFT). The acquisition of MFT will create synergetic opportunities for Precision through new product offerings and will also aid in enhancing Precision’s customer base across the globe.

Also, in 2018, Tenneco, a leading manufacturer and supplier of products for original equipment and aftermarket consumers, announced the acquisition of Federal-Mogul, a global supplier and manufacturer of automotive, commercial, marine, aerospace, and others. The acquisition of Frederal-Mogul aligns with the growth strategy of Tenneco, which is concentrated on developing strong brands, products, and capabilities devised for end consumers across the world.

List encompassing key players of automotive camshaft:

  • Mahle GmbH
  • JD Norman Industries, Inc.
  • Thyssenkrupp AG
  • Linamar Corporation
  • ESTAS CAMSHAFT & CHILLED CAST
  • Crance Cams Inc.
  • Aichi Forge USA Inc.
  • Engine Power Components Inc.
  • Hirschvogel Holding GmbH
  • KAUTEX TEXTRON GmbH & Co. KG
  • Shadbolt Cams
  • Comp Performance Group
  • Precision Camshafts Ltd.
  • Varroc Group
  • Camshaft Machine Company

Automotive Camshaft Industry Report Scope

Attribute

Details

Forecast Period

2023 to 2033

Historical Data Available for

2017 to 2022

Market Analysis

Value in US$ Million/Billion, Volume in Units

Key Regions Covered

  • North America
  • Latin America
  • Europe
  • East Asia
  • South Asia & Pacific
  • Middle East & Africa (MEA)

Key Countries Covered

  • United States of America
  • Canada
  • Mexico
  • Brazil
  • Mexico
  • Argentina
  • Germany
  • Italy
  • France
  • UK
  • Nordic
  • Spain
  • Japan
  • China
  • India
  • Malaysia
  • Thailand
  • Australia
  • GCC Countries
  • South Africa
  • Turkey

Key Market Segments Covered

  • Product Type
  • Vehicle Type
  • Sales Channel
  • Region

Key Companies Profiled

  • Mahle GmbH
  • JD Norman Industries, Inc.
  • Thyssenkrupp AG
  • Linamar Corporation
  • ESTAS CAMSHAFT & CHILLED CAST
  • Crance Cams Inc.
  • Aichi Forge USA Inc.
  • Engine Power Components Inc.
  • Hirschvogel Holding GmbH
  • KAUTEX TEXTRON GmbH & Co. KG
  • Shadbolt Cams
  • Comp Performance Group
  • Precision Camshafts Ltd.
  • Varroc Group
  • Camshaft Machine Company

Pricing

Available upon Request

Given Below are the Automotive Camshaft Market Segments

Product Type:

  • Cast Camshaft
  • Forged Camshaft
  • Assembled Camshaft

Vehicle Type:

  • Passenger Car
  • Light Commercial Vehicle
  • Heavy Commercial Vehicle

Sales Channel:

  • Original Equipment Manufacturer (OEM)
  • Aftermarket

Region:

  • North America
  • Latin America
  • Europe
  • East Asia
  • South Asia & Pacific
  • Middle East & Africa (MEA)

Frequently Asked Questions

The global market of automotive camshafts is projected to reach a valuation of US$ 5.6 Billion by 2033.

Mahle GmbH and JD Norman Industries, Inc. are top players in the automotive camshaft market.

China is expected to dominate the automotive camshaft market throughout the forecast period.

The global market of automotive camshafts is projected to grow at approximately a CAGR of 4.7%.

Table of Content

1. Executive Summary | Automotive Camshaft Market

    1.1. Global Market Outlook

    1.2. Demand-side Trends

    1.3. Supply-side Trends

    1.4. Technology Roadmap Analysis

    1.5. Analysis and Recommendations

2. Market Overview

    2.1. Market Coverage / Taxonomy

    2.2. Market Definition / Scope / Limitations

3. Market Background

    3.1. Market Dynamics

        3.1.1. Drivers

        3.1.2. Restraints

        3.1.3. Opportunity

        3.1.4. Trends

    3.2. Scenario Forecast

        3.2.1. Demand in Optimistic Scenario

        3.2.2. Demand in Likely Scenario

        3.2.3. Demand in Conservative Scenario

    3.3. Opportunity Map Analysis

    3.4. Product Life Cycle Analysis

    3.5. Supply Chain Analysis

        3.5.1. Supply Side Participants and their Roles

            3.5.1.1. Producers

            3.5.1.2. Mid-Level Participants (Traders/ Agents/ Brokers)

            3.5.1.3. Wholesalers and Distributors

        3.5.2. Value Added and Value Created at Node in the Supply Chain

        3.5.3. List of Raw Material Suppliers

        3.5.4. List of Existing and Potential Buyers

    3.6. Investment Feasibility Matrix

    3.7. Value Chain Analysis

        3.7.1. Profit Margin Analysis

        3.7.2. Wholesalers and Distributors

        3.7.3. Retailers

    3.8. PESTLE and Porter’s Analysis

    3.9. Regulatory Landscape

        3.9.1. By Key Regions

        3.9.2. By Key Countries

    3.10. Regional Parent Market Outlook

    3.11. Production and Consumption Statistics

    3.12. Import and Export Statistics

4. Global Market Analysis 2017 to 2022 and Forecast, 2023 to 2033

    4.1. Historical Market Size Value (US$ Million) & Volume (Units) Analysis, 2017 to 2022

    4.2. Current and Future Market Size Value (US$ Million) & Volume (Units) Projections, 2023 to 2033

        4.2.1. Y-o-Y Growth Trend Analysis

        4.2.2. Absolute $ Opportunity Analysis

5. Global Market Analysis 2017 to 2022 and Forecast 2023 to 2033, By Product Type

    5.1. Introduction / Key Findings

    5.2. Historical Market Size Value (US$ Million) & Volume (Units) Analysis By Product Type, 2017 to 2022

    5.3. Current and Future Market Size Value (US$ Million) & Volume (Units) Analysis and Forecast By Product Type, 2023 to 2033

        5.3.1. Cast Camshaft

        5.3.2. Forged Camshaft

        5.3.3. Assembled Camshaft

    5.4. Y-o-Y Growth Trend Analysis By Product Type, 2017 to 2022

    5.5. Absolute $ Opportunity Analysis By Product Type, 2023 to 2033

6. Global Market Analysis 2017 to 2022 and Forecast 2023 to 2033, By Vehicle Type

    6.1. Introduction / Key Findings

    6.2. Historical Market Size Value (US$ Million) & Volume (Units) Analysis By Vehicle Type, 2017 to 2022

    6.3. Current and Future Market Size Value (US$ Million) & Volume (Units) Analysis and Forecast By Vehicle Type, 2023 to 2033

        6.3.1. Passenger Car

        6.3.2. Light Commercial Vehicle

        6.3.3. Heavy Commercial Vehicle

    6.4. Y-o-Y Growth Trend Analysis By Vehicle Type, 2017 to 2022

    6.5. Absolute $ Opportunity Analysis By Vehicle Type, 2023 to 2033

7. Global Market Analysis 2017 to 2022 and Forecast 2023 to 2033, By Sales Channel

    7.1. Introduction / Key Findings

    7.2. Historical Market Size Value (US$ Million) & Volume (Units) Analysis By Sales Channel, 2017 to 2022

    7.3. Current and Future Market Size Value (US$ Million) & Volume (Units) Analysis and Forecast By Sales Channel, 2023 to 2033

        7.3.1. Original Equipment Manufacturer

        7.3.2. Aftermarket

    7.4. Y-o-Y Growth Trend Analysis By Sales Channel, 2017 to 2022

    7.5. Absolute $ Opportunity Analysis By Sales Channel, 2023 to 2033

8. Global Market Analysis 2017 to 2022 and Forecast 2023 to 2033, By Region

    8.1. Introduction

    8.2. Historical Market Size Value (US$ Million) & Volume (Units) Analysis By Region, 2017 to 2022

    8.3. Current Market Size Value (US$ Million) & Volume (Units) Analysis and Forecast By Region, 2023 to 2033

        8.3.1. North America

        8.3.2. Latin America

        8.3.3. Eastern Europe

        8.3.4. Western Europe

        8.3.5. Asia-Pacific excluding Japan (APEJ)

        8.3.6. Japan

        8.3.7. Middle East and Africa (MEA)

    8.4. Market Attractiveness Analysis By Region

9. North America Market Analysis 2017 to 2022 and Forecast 2023 to 2033, By Country

    9.1. Historical Market Size Value (US$ Million) & Volume (Units) Trend Analysis By Market Taxonomy, 2017 to 2022

    9.2. Market Size Value (US$ Million) & Volume (Units) Forecast By Market Taxonomy, 2023 to 2033

        9.2.1. By Country

            9.2.1.1. United States of America

            9.2.1.2. Canada

        9.2.2. By Product Type

        9.2.3. By Vehicle Type

        9.2.4. By Sales Channel

    9.3. Market Attractiveness Analysis

        9.3.1. By Country

        9.3.2. By Product Type

        9.3.3. By Vehicle Type

        9.3.4. By Sales Channel

    9.4. Key Takeaways

10. Latin America Market Analysis 2017 to 2022 and Forecast 2023 to 2033, By Country

    10.1. Historical Market Size Value (US$ Million) & Volume (Units) Trend Analysis By Market Taxonomy, 2017 to 2022

    10.2. Market Size Value (US$ Million) & Volume (Units) Forecast By Market Taxonomy, 2023 to 2033

        10.2.1. By Country

            10.2.1.1. Brazil

            10.2.1.2. Mexico

            10.2.1.3. Rest of Latin America

        10.2.2. By Product Type

        10.2.3. By Vehicle Type

        10.2.4. By Sales Channel

    10.3. Market Attractiveness Analysis

        10.3.1. By Country

        10.3.2. By Product Type

        10.3.3. By Vehicle Type

        10.3.4. By Sales Channel

    10.4. Key Takeaways

11. Eastern Europe Market Analysis 2017 to 2022 and Forecast 2023 to 2033, By Country

    11.1. Historical Market Size Value (US$ Million) & Volume (Units) Trend Analysis By Market Taxonomy, 2017 to 2022

    11.2. Market Size Value (US$ Million) & Volume (Units) Forecast By Market Taxonomy, 2023 to 2033

        11.2.1. By Country

            11.2.1.1. Russia

            11.2.1.2. Poland

            11.2.1.3. Rest of Eastern Europe

        11.2.2. By Product Type

        11.2.3. By Vehicle Type

        11.2.4. By Sales Channel

    11.3. Market Attractiveness Analysis

        11.3.1. By Country

        11.3.2. By Product Type

        11.3.3. By Vehicle Type

        11.3.4. By Sales Channel

    11.4. Key Takeaways

12. Western Europe Market Analysis 2017 to 2022 and Forecast 2023 to 2033, By Country

    12.1. Historical Market Size Value (US$ Million) & Volume (Units) Trend Analysis By Market Taxonomy, 2017 to 2022

    12.2. Market Size Value (US$ Million) & Volume (Units) Forecast By Market Taxonomy, 2023 to 2033

        12.2.1. By Country

            12.2.1.1. Germany

            12.2.1.2. Italy

            12.2.1.3. France

            12.2.1.4. United Kingdom

            12.2.1.5. Spain

            12.2.1.6. BENELUX

            12.2.1.7. Rest of Western Europe

        12.2.2. By Product Type

        12.2.3. By Vehicle Type

        12.2.4. By Sales Channel

    12.3. Market Attractiveness Analysis

        12.3.1. By Country

        12.3.2. By Product Type

        12.3.3. By Vehicle Type

        12.3.4. By Sales Channel

    12.4. Key Takeaways

13. APEJ Market Analysis 2017 to 2022 and Forecast 2023 to 2033, By Country

    13.1. Historical Market Size Value (US$ Million) & Volume (Units) Trend Analysis By Market Taxonomy, 2017 to 2022

    13.2. Market Size Value (US$ Million) & Volume (Units) Forecast By Market Taxonomy, 2023 to 2033

        13.2.1. By Country

            13.2.1.1. China

            13.2.1.2. India

            13.2.1.3. ASEAN

            13.2.1.4. Australia and New Zealand

            13.2.1.5. South Korea

            13.2.1.6. Rest of APEJ

        13.2.2. By Product Type

        13.2.3. By Vehicle Type

        13.2.4. By Sales Channel

    13.3. Market Attractiveness Analysis

        13.3.1. By Country

        13.3.2. By Product Type

        13.3.3. By Vehicle Type

        13.3.4. By Sales Channel

    13.4. Key Takeaways

14. Japan Market Analysis 2017 to 2022 and Forecast 2023 to 2033, By Country

    14.1. Historical Market Size Value (US$ Million) & Volume (Units) Trend Analysis By Market Taxonomy, 2017 to 2022

    14.2. Market Size Value (US$ Million) & Volume (Units) Forecast By Market Taxonomy, 2023 to 2033

        14.2.1. By Country

        14.2.2. By Product Type

        14.2.3. By Vehicle Type

        14.2.4. By Sales Channel

    14.3. Market Attractiveness Analysis

        14.3.1. By Country

        14.3.2. By Product Type

        14.3.3. By Vehicle Type

        14.3.4. By Sales Channel

    14.4. Key Takeaways

15. MEA Market Analysis 2017 to 2022 and Forecast 2023 to 2033, By Country

    15.1. Historical Market Size Value (US$ Million) & Volume (Units) Trend Analysis By Market Taxonomy, 2017 to 2022

    15.2. Market Size Value (US$ Million) & Volume (Units) Forecast By Market Taxonomy, 2023 to 2033

        15.2.1. By Country

            15.2.1.1. GCC Countries

            15.2.1.2. South Africa

            15.2.1.3. Rest of MEA

        15.2.2. By Product Type

        15.2.3. By Vehicle Type

        15.2.4. By Sales Channel

    15.3. Market Attractiveness Analysis

        15.3.1. By Country

        15.3.2. By Product Type

        15.3.3. By Vehicle Type

        15.3.4. By Sales Channel

    15.4. Key Takeaways

16. Key Countries Market Analysis

    16.1. United States of America

        16.1.1. Pricing Analysis

        16.1.2. Market Share Analysis, 2022

            16.1.2.1. By Product Type

            16.1.2.2. By Vehicle Type

            16.1.2.3. By Sales Channel

    16.2. Canada

        16.2.1. Pricing Analysis

        16.2.2. Market Share Analysis, 2022

            16.2.2.1. By Product Type

            16.2.2.2. By Vehicle Type

            16.2.2.3. By Sales Channel

    16.3. Brazil

        16.3.1. Pricing Analysis

        16.3.2. Market Share Analysis, 2022

            16.3.2.1. By Product Type

            16.3.2.2. By Vehicle Type

            16.3.2.3. By Sales Channel

    16.4. Mexico

        16.4.1. Pricing Analysis

        16.4.2. Market Share Analysis, 2022

            16.4.2.1. By Product Type

            16.4.2.2. By Vehicle Type

            16.4.2.3. By Sales Channel

    16.5. Russia 

        16.5.1. Pricing Analysis

        16.5.2. Market Share Analysis, 2022

            16.5.2.1. By Product Type

            16.5.2.2. By Vehicle Type

            16.5.2.3. By Sales Channel

    16.6. Poland

        16.6.1. Pricing Analysis

        16.6.2. Market Share Analysis, 2022

            16.6.2.1. By Product Type

            16.6.2.2. By Vehicle Type

            16.6.2.3. By Sales Channel

    16.7. Germany

        16.7.1. Pricing Analysis

        16.7.2. Market Share Analysis, 2022

            16.7.2.1. By Product Type

            16.7.2.2. By Vehicle Type

            16.7.2.3. By Sales Channel

    16.8. Italy

        16.8.1. Pricing Analysis

        16.8.2. Market Share Analysis, 2022

            16.8.2.1. By Product Type

            16.8.2.2. By Vehicle Type

            16.8.2.3. By Sales Channel

    16.9. France

        16.9.1. Pricing Analysis

        16.9.2. Market Share Analysis, 2022

            16.9.2.1. By Product Type

            16.9.2.2. By Vehicle Type

            16.9.2.3. By Sales Channel

    16.10. United Kingdom

        16.10.1. Pricing Analysis

        16.10.2. Market Share Analysis, 2022

            16.10.2.1. By Product Type

            16.10.2.2. By Vehicle Type

            16.10.2.3. By Sales Channel

    16.11. Spain

        16.11.1. Pricing Analysis

        16.11.2. Market Share Analysis, 2022

            16.11.2.1. By Product Type

            16.11.2.2. By Vehicle Type

            16.11.2.3. By Sales Channel

    16.12. BENELUX

        16.12.1. Pricing Analysis

        16.12.2. Market Share Analysis, 2022

            16.12.2.1. By Product Type

            16.12.2.2. By Vehicle Type

            16.12.2.3. By Sales Channel

    16.13. China

        16.13.1. Pricing Analysis

        16.13.2. Market Share Analysis, 2022

            16.13.2.1. By Product Type

            16.13.2.2. By Vehicle Type

            16.13.2.3. By Sales Channel

    16.14. India

        16.14.1. Pricing Analysis

        16.14.2. Market Share Analysis, 2022

            16.14.2.1. By Product Type

            16.14.2.2. By Vehicle Type

            16.14.2.3. By Sales Channel

    16.15. ASIAN

        16.15.1. Pricing Analysis

        16.15.2. Market Share Analysis, 2022

            16.15.2.1. By Product Type

            16.15.2.2. By Vehicle Type

            16.15.2.3. By Sales Channel

    16.16. Australia and New Zealand

        16.16.1. Pricing Analysis

        16.16.2. Market Share Analysis, 2022

            16.16.2.1. By Product Type

            16.16.2.2. By Vehicle Type

            16.16.2.3. By Sales Channel

    16.17. South Korea

        16.17.1. Pricing Analysis

        16.17.2. Market Share Analysis, 2022

            16.17.2.1. By Product Type

            16.17.2.2. By Vehicle Type

            16.17.2.3. By Sales Channel

    16.18. Japan

        16.18.1. Pricing Analysis

        16.18.2. Market Share Analysis, 2022

            16.18.2.1. By Product Type

            16.18.2.2. By Vehicle Type

            16.18.2.3. By Sales Channel

    16.19. GCC Countries

        16.19.1. Pricing Analysis

        16.19.2. Market Share Analysis, 2022

            16.19.2.1. By Product Type

            16.19.2.2. By Vehicle Type

            16.19.2.3. By Sales Channel

    16.20. South Africa

        16.20.1. Pricing Analysis

        16.20.2. Market Share Analysis, 2022

            16.20.2.1. By Product Type

            16.20.2.2. By Vehicle Type

            16.20.2.3. By Sales Channel

17. Market Structure Analysis

    17.1. Competition Dashboard

    17.2. Competition Benchmarking

    17.3. Market Share Analysis of Top Players

        17.3.1. By Regional

        17.3.2. By Product Type

        17.3.3. By Vehicle Type

        17.3.4. By Sales Channel

18. Competition Analysis

    18.1. Competition Deep Dive

        18.1.1. Mahle GmbH

            18.1.1.1. Overview

            18.1.1.2. Product Portfolio

            18.1.1.3. Profitability by Market Segments

            18.1.1.4. Sales Footprint

            18.1.1.5. Strategy Overview

                18.1.1.5.1. Marketing Strategy

                18.1.1.5.2. Product Strategy

                18.1.1.5.3. Channel Strategy

        18.1.2. JD Norman Industries, Inc.

            18.1.2.1. Overview

            18.1.2.2. Product Portfolio

            18.1.2.3. Profitability by Market Segments

            18.1.2.4. Sales Footprint

            18.1.2.5. Strategy Overview

                18.1.2.5.1. Marketing Strategy

                18.1.2.5.2. Product Strategy

                18.1.2.5.3. Channel Strategy

        18.1.3. Thyssenkrupp AG

            18.1.3.1. Overview

            18.1.3.2. Product Portfolio

            18.1.3.3. Profitability by Market Segments

            18.1.3.4. Sales Footprint

            18.1.3.5. Strategy Overview

                18.1.3.5.1. Marketing Strategy

                18.1.3.5.2. Product Strategy

                18.1.3.5.3. Channel Strategy

        18.1.4. Linamar Corporation

            18.1.4.1. Overview

            18.1.4.2. Product Portfolio

            18.1.4.3. Profitability by Market Segments

            18.1.4.4. Sales Footprint

            18.1.4.5. Strategy Overview

                18.1.4.5.1. Marketing Strategy

                18.1.4.5.2. Product Strategy

                18.1.4.5.3. Channel Strategy

        18.1.5. ESTAS CAMSHAFT & CHILLED CAST

            18.1.5.1. Overview

            18.1.5.2. Product Portfolio

            18.1.5.3. Profitability by Market Segments

            18.1.5.4. Sales Footprint

            18.1.5.5. Strategy Overview

                18.1.5.5.1. Marketing Strategy

                18.1.5.5.2. Product Strategy

                18.1.5.5.3. Channel Strategy

        18.1.6. Crance Cams Inc.

            18.1.6.1. Overview

            18.1.6.2. Product Portfolio

            18.1.6.3. Profitability by Market Segments

            18.1.6.4. Sales Footprint

            18.1.6.5. Strategy Overview

                18.1.6.5.1. Marketing Strategy

                18.1.6.5.2. Product Strategy

                18.1.6.5.3. Channel Strategy

        18.1.7. Aichi Forge USA Inc.

            18.1.7.1. Overview

            18.1.7.2. Product Portfolio

            18.1.7.3. Profitability by Market Segments

            18.1.7.4. Sales Footprint

            18.1.7.5. Strategy Overview

                18.1.7.5.1. Marketing Strategy

                18.1.7.5.2. Product Strategy

                18.1.7.5.3. Channel Strategy

        18.1.8. Engine Power Components Inc.

            18.1.8.1. Overview

            18.1.8.2. Product Portfolio

            18.1.8.3. Profitability by Market Segments

            18.1.8.4. Sales Footprint

            18.1.8.5. Strategy Overview

                18.1.8.5.1. Marketing Strategy

                18.1.8.5.2. Product Strategy

                18.1.8.5.3. Channel Strategy

        18.1.9. Hirschvogel Holding GmbH

            18.1.9.1. Overview

            18.1.9.2. Product Portfolio

            18.1.9.3. Profitability by Market Segments

            18.1.9.4. Sales Footprint

            18.1.9.5. Strategy Overview

                18.1.9.5.1. Marketing Strategy

                18.1.9.5.2. Product Strategy

                18.1.9.5.3. Channel Strategy

        18.1.10. KAUTEX TEXTRON GmbH & Co. KG

            18.1.10.1. Overview

            18.1.10.2. Product Portfolio

            18.1.10.3. Profitability by Market Segments

            18.1.10.4. Sales Footprint

            18.1.10.5. Strategy Overview

                18.1.10.5.1. Marketing Strategy

                18.1.10.5.2. Product Strategy

                18.1.10.5.3. Channel Strategy

        18.1.11. Shadbolt Cams

            18.1.11.1. Overview

            18.1.11.2. Product Portfolio

            18.1.11.3. Profitability by Market Segments

            18.1.11.4. Sales Footprint

            18.1.11.5. Strategy Overview

                18.1.11.5.1. Marketing Strategy

                18.1.11.5.2. Product Strategy

                18.1.11.5.3. Channel Strategy

        18.1.12. Comp Performance Group

            18.1.12.1. Overview

            18.1.12.2. Product Portfolio

            18.1.12.3. Profitability by Market Segments

            18.1.12.4. Sales Footprint

            18.1.12.5. Strategy Overview

                18.1.12.5.1. Marketing Strategy

                18.1.12.5.2. Product Strategy

                18.1.12.5.3. Channel Strategy

        18.1.13. Precision Camshafts Ltd.

            18.1.13.1. Overview

            18.1.13.2. Product Portfolio

            18.1.13.3. Profitability by Market Segments

            18.1.13.4. Sales Footprint

            18.1.13.5. Strategy Overview

                18.1.13.5.1. Marketing Strategy

                18.1.13.5.2. Product Strategy

                18.1.13.5.3. Channel Strategy

        18.1.14. Varroc Group

            18.1.14.1. Overview

            18.1.14.2. Product Portfolio

            18.1.14.3. Profitability by Market Segments

            18.1.14.4. Sales Footprint

            18.1.14.5. Strategy Overview

                18.1.14.5.1. Marketing Strategy

                18.1.14.5.2. Product Strategy

                18.1.14.5.3. Channel Strategy

        18.1.15. Camshaft Machine Company

            18.1.15.1. Overview

            18.1.15.2. Product Portfolio

            18.1.15.3. Profitability by Market Segments

            18.1.15.4. Sales Footprint

            18.1.15.5. Strategy Overview

                18.1.15.5.1. Marketing Strategy

                18.1.15.5.2. Product Strategy

                18.1.15.5.3. Channel Strategy

19. Assumptions & Acronyms Used

20. Research Methodology

Don't pay for what you don't need

Customize your report by selecting specific countries or regions and save 30%!

List of Tables

Table 1: Global Market Value (US$ Million) Forecast by Region, 2017 to 2033

Table 2: Global Market Volume (Units) Forecast by Region, 2017 to 2033

Table 3: Global Market Value (US$ Million) Forecast by Product Type, 2017 to 2033

Table 4: Global Market Volume (Units) Forecast by Product Type, 2017 to 2033

Table 5: Global Market Value (US$ Million) Forecast by Vehicle Type, 2017 to 2033

Table 6: Global Market Volume (Units) Forecast by Vehicle Type, 2017 to 2033

Table 7: Global Market Value (US$ Million) Forecast by Sales Channel, 2017 to 2033

Table 8: Global Market Volume (Units) Forecast by Sales Channel, 2017 to 2033

Table 9: North America Market Value (US$ Million) Forecast by Country, 2017 to 2033

Table 10: North America Market Volume (Units) Forecast by Country, 2017 to 2033

Table 11: North America Market Value (US$ Million) Forecast by Product Type, 2017 to 2033

Table 12: North America Market Volume (Units) Forecast by Product Type, 2017 to 2033

Table 13: North America Market Value (US$ Million) Forecast by Vehicle Type, 2017 to 2033

Table 14: North America Market Volume (Units) Forecast by Vehicle Type, 2017 to 2033

Table 15: North America Market Value (US$ Million) Forecast by Sales Channel, 2017 to 2033

Table 16: North America Market Volume (Units) Forecast by Sales Channel, 2017 to 2033

Table 17: Latin America Market Value (US$ Million) Forecast by Country, 2017 to 2033

Table 18: Latin America Market Volume (Units) Forecast by Country, 2017 to 2033

Table 19: Latin America Market Value (US$ Million) Forecast by Product Type, 2017 to 2033

Table 20: Latin America Market Volume (Units) Forecast by Product Type, 2017 to 2033

Table 21: Latin America Market Value (US$ Million) Forecast by Vehicle Type, 2017 to 2033

Table 22: Latin America Market Volume (Units) Forecast by Vehicle Type, 2017 to 2033

Table 23: Latin America Market Value (US$ Million) Forecast by Sales Channel, 2017 to 2033

Table 24: Latin America Market Volume (Units) Forecast by Sales Channel, 2017 to 2033

Table 25: Eastern Europe Market Value (US$ Million) Forecast by Country, 2017 to 2033

Table 26: Eastern Europe Market Volume (Units) Forecast by Country, 2017 to 2033

Table 27: Eastern Europe Market Value (US$ Million) Forecast by Product Type, 2017 to 2033

Table 28: Eastern Europe Market Volume (Units) Forecast by Product Type, 2017 to 2033

Table 29: Eastern Europe Market Value (US$ Million) Forecast by Vehicle Type, 2017 to 2033

Table 30: Eastern Europe Market Volume (Units) Forecast by Vehicle Type, 2017 to 2033

Table 31: Eastern Europe Market Value (US$ Million) Forecast by Sales Channel, 2017 to 2033

Table 32: Eastern Europe Market Volume (Units) Forecast by Sales Channel, 2017 to 2033

Table 33: Western Europe Market Value (US$ Million) Forecast by Country, 2017 to 2033

Table 34: Western Europe Market Volume (Units) Forecast by Country, 2017 to 2033

Table 35: Western Europe Market Value (US$ Million) Forecast by Product Type, 2017 to 2033

Table 36: Western Europe Market Volume (Units) Forecast by Product Type, 2017 to 2033

Table 37: Western Europe Market Value (US$ Million) Forecast by Vehicle Type, 2017 to 2033

Table 38: Western Europe Market Volume (Units) Forecast by Vehicle Type, 2017 to 2033

Table 39: Western Europe Market Value (US$ Million) Forecast by Sales Channel, 2017 to 2033

Table 40: Western Europe Market Volume (Units) Forecast by Sales Channel, 2017 to 2033

Table 41: APEJ Market Value (US$ Million) Forecast by Country, 2017 to 2033

Table 42: APEJ Market Volume (Units) Forecast by Country, 2017 to 2033

Table 43: APEJ Market Value (US$ Million) Forecast by Product Type, 2017 to 2033

Table 44: APEJ Market Volume (Units) Forecast by Product Type, 2017 to 2033

Table 45: APEJ Market Value (US$ Million) Forecast by Vehicle Type, 2017 to 2033

Table 46: APEJ Market Volume (Units) Forecast by Vehicle Type, 2017 to 2033

Table 47: APEJ Market Value (US$ Million) Forecast by Sales Channel, 2017 to 2033

Table 48: APEJ Market Volume (Units) Forecast by Sales Channel, 2017 to 2033

Table 49: Japan Market Value (US$ Million) Forecast by Country, 2017 to 2033

Table 50: Japan Market Volume (Units) Forecast by Country, 2017 to 2033

Table 51: Japan Market Value (US$ Million) Forecast by Product Type, 2017 to 2033

Table 52: Japan Market Volume (Units) Forecast by Product Type, 2017 to 2033

Table 53: Japan Market Value (US$ Million) Forecast by Vehicle Type, 2017 to 2033

Table 54: Japan Market Volume (Units) Forecast by Vehicle Type, 2017 to 2033

Table 55: Japan Market Value (US$ Million) Forecast by Sales Channel, 2017 to 2033

Table 56: Japan Market Volume (Units) Forecast by Sales Channel, 2017 to 2033

Table 57: MEA Market Value (US$ Million) Forecast by Country, 2017 to 2033

Table 58: MEA Market Volume (Units) Forecast by Country, 2017 to 2033

Table 59: MEA Market Value (US$ Million) Forecast by Product Type, 2017 to 2033

Table 60: MEA Market Volume (Units) Forecast by Product Type, 2017 to 2033

Table 61: MEA Market Value (US$ Million) Forecast by Vehicle Type, 2017 to 2033

Table 62: MEA Market Volume (Units) Forecast by Vehicle Type, 2017 to 2033

Table 63: MEA Market Value (US$ Million) Forecast by Sales Channel, 2017 to 2033

Table 64: MEA Market Volume (Units) Forecast by Sales Channel, 2017 to 2033
Nikhil Kaitwade
Nikhil Kaitwade
Principal Consultant
LinkedIn
Talk to Analyst

Find your sweet spots for generating winning opportunities in this market.

Talk to Analyst

List of Charts

Figure 1: Global Market Value (US$ Million) by Product Type, 2023 to 2033

Figure 2: Global Market Value (US$ Million) by Vehicle Type, 2023 to 2033

Figure 3: Global Market Value (US$ Million) by Sales Channel, 2023 to 2033

Figure 4: Global Market Value (US$ Million) by Region, 2023 to 2033

Figure 5: Global Market Value (US$ Million) Analysis by Region, 2017 to 2033

Figure 6: Global Market Volume (Units) Analysis by Region, 2017 to 2033

Figure 7: Global Market Value Share (%) and BPS Analysis by Region, 2023 to 2033

Figure 8: Global Market Y-o-Y Growth (%) Projections by Region, 2023 to 2033

Figure 9: Global Market Value (US$ Million) Analysis by Product Type, 2017 to 2033

Figure 10: Global Market Volume (Units) Analysis by Product Type, 2017 to 2033

Figure 11: Global Market Value Share (%) and BPS Analysis by Product Type, 2023 to 2033

Figure 12: Global Market Y-o-Y Growth (%) Projections by Product Type, 2023 to 2033

Figure 13: Global Market Value (US$ Million) Analysis by Vehicle Type, 2017 to 2033

Figure 14: Global Market Volume (Units) Analysis by Vehicle Type, 2017 to 2033

Figure 15: Global Market Value Share (%) and BPS Analysis by Vehicle Type, 2023 to 2033

Figure 16: Global Market Y-o-Y Growth (%) Projections by Vehicle Type, 2023 to 2033

Figure 17: Global Market Value (US$ Million) Analysis by Sales Channel, 2017 to 2033

Figure 18: Global Market Volume (Units) Analysis by Sales Channel, 2017 to 2033

Figure 19: Global Market Value Share (%) and BPS Analysis by Sales Channel, 2023 to 2033

Figure 20: Global Market Y-o-Y Growth (%) Projections by Sales Channel, 2023 to 2033

Figure 21: Global Market Attractiveness by Product Type, 2023 to 2033

Figure 22: Global Market Attractiveness by Vehicle Type, 2023 to 2033

Figure 23: Global Market Attractiveness by Sales Channel, 2023 to 2033

Figure 24: Global Market Attractiveness by Region, 2023 to 2033

Figure 25: North America Market Value (US$ Million) by Product Type, 2023 to 2033

Figure 26: North America Market Value (US$ Million) by Vehicle Type, 2023 to 2033

Figure 27: North America Market Value (US$ Million) by Sales Channel, 2023 to 2033

Figure 28: North America Market Value (US$ Million) by Country, 2023 to 2033

Figure 29: North America Market Value (US$ Million) Analysis by Country, 2017 to 2033

Figure 30: North America Market Volume (Units) Analysis by Country, 2017 to 2033

Figure 31: North America Market Value Share (%) and BPS Analysis by Country, 2023 to 2033

Figure 32: North America Market Y-o-Y Growth (%) Projections by Country, 2023 to 2033

Figure 33: North America Market Value (US$ Million) Analysis by Product Type, 2017 to 2033

Figure 34: North America Market Volume (Units) Analysis by Product Type, 2017 to 2033

Figure 35: North America Market Value Share (%) and BPS Analysis by Product Type, 2023 to 2033

Figure 36: North America Market Y-o-Y Growth (%) Projections by Product Type, 2023 to 2033

Figure 37: North America Market Value (US$ Million) Analysis by Vehicle Type, 2017 to 2033

Figure 38: North America Market Volume (Units) Analysis by Vehicle Type, 2017 to 2033

Figure 39: North America Market Value Share (%) and BPS Analysis by Vehicle Type, 2023 to 2033

Figure 40: North America Market Y-o-Y Growth (%) Projections by Vehicle Type, 2023 to 2033

Figure 41: North America Market Value (US$ Million) Analysis by Sales Channel, 2017 to 2033

Figure 42: North America Market Volume (Units) Analysis by Sales Channel, 2017 to 2033

Figure 43: North America Market Value Share (%) and BPS Analysis by Sales Channel, 2023 to 2033

Figure 44: North America Market Y-o-Y Growth (%) Projections by Sales Channel, 2023 to 2033

Figure 45: North America Market Attractiveness by Product Type, 2023 to 2033

Figure 46: North America Market Attractiveness by Vehicle Type, 2023 to 2033

Figure 47: North America Market Attractiveness by Sales Channel, 2023 to 2033

Figure 48: North America Market Attractiveness by Country, 2023 to 2033

Figure 49: Latin America Market Value (US$ Million) by Product Type, 2023 to 2033

Figure 50: Latin America Market Value (US$ Million) by Vehicle Type, 2023 to 2033

Figure 51: Latin America Market Value (US$ Million) by Sales Channel, 2023 to 2033

Figure 52: Latin America Market Value (US$ Million) by Country, 2023 to 2033

Figure 53: Latin America Market Value (US$ Million) Analysis by Country, 2017 to 2033

Figure 54: Latin America Market Volume (Units) Analysis by Country, 2017 to 2033

Figure 55: Latin America Market Value Share (%) and BPS Analysis by Country, 2023 to 2033

Figure 56: Latin America Market Y-o-Y Growth (%) Projections by Country, 2023 to 2033

Figure 57: Latin America Market Value (US$ Million) Analysis by Product Type, 2017 to 2033

Figure 58: Latin America Market Volume (Units) Analysis by Product Type, 2017 to 2033

Figure 59: Latin America Market Value Share (%) and BPS Analysis by Product Type, 2023 to 2033

Figure 60: Latin America Market Y-o-Y Growth (%) Projections by Product Type, 2023 to 2033

Figure 61: Latin America Market Value (US$ Million) Analysis by Vehicle Type, 2017 to 2033

Figure 62: Latin America Market Volume (Units) Analysis by Vehicle Type, 2017 to 2033

Figure 63: Latin America Market Value Share (%) and BPS Analysis by Vehicle Type, 2023 to 2033

Figure 64: Latin America Market Y-o-Y Growth (%) Projections by Vehicle Type, 2023 to 2033

Figure 65: Latin America Market Value (US$ Million) Analysis by Sales Channel, 2017 to 2033

Figure 66: Latin America Market Volume (Units) Analysis by Sales Channel, 2017 to 2033

Figure 67: Latin America Market Value Share (%) and BPS Analysis by Sales Channel, 2023 to 2033

Figure 68: Latin America Market Y-o-Y Growth (%) Projections by Sales Channel, 2023 to 2033

Figure 69: Latin America Market Attractiveness by Product Type, 2023 to 2033

Figure 70: Latin America Market Attractiveness by Vehicle Type, 2023 to 2033

Figure 71: Latin America Market Attractiveness by Sales Channel, 2023 to 2033

Figure 72: Latin America Market Attractiveness by Country, 2023 to 2033

Figure 73: Eastern Europe Market Value (US$ Million) by Product Type, 2023 to 2033

Figure 74: Eastern Europe Market Value (US$ Million) by Vehicle Type, 2023 to 2033

Figure 75: Eastern Europe Market Value (US$ Million) by Sales Channel, 2023 to 2033

Figure 76: Eastern Europe Market Value (US$ Million) by Country, 2023 to 2033

Figure 77: Eastern Europe Market Value (US$ Million) Analysis by Country, 2017 to 2033

Figure 78: Eastern Europe Market Volume (Units) Analysis by Country, 2017 to 2033

Figure 79: Eastern Europe Market Value Share (%) and BPS Analysis by Country, 2023 to 2033

Figure 80: Eastern Europe Market Y-o-Y Growth (%) Projections by Country, 2023 to 2033

Figure 81: Eastern Europe Market Value (US$ Million) Analysis by Product Type, 2017 to 2033

Figure 82: Eastern Europe Market Volume (Units) Analysis by Product Type, 2017 to 2033

Figure 83: Eastern Europe Market Value Share (%) and BPS Analysis by Product Type, 2023 to 2033

Figure 84: Eastern Europe Market Y-o-Y Growth (%) Projections by Product Type, 2023 to 2033

Figure 85: Eastern Europe Market Value (US$ Million) Analysis by Vehicle Type, 2017 to 2033

Figure 86: Eastern Europe Market Volume (Units) Analysis by Vehicle Type, 2017 to 2033

Figure 87: Eastern Europe Market Value Share (%) and BPS Analysis by Vehicle Type, 2023 to 2033

Figure 88: Eastern Europe Market Y-o-Y Growth (%) Projections by Vehicle Type, 2023 to 2033

Figure 89: Eastern Europe Market Value (US$ Million) Analysis by Sales Channel, 2017 to 2033

Figure 90: Eastern Europe Market Volume (Units) Analysis by Sales Channel, 2017 to 2033

Figure 91: Eastern Europe Market Value Share (%) and BPS Analysis by Sales Channel, 2023 to 2033

Figure 92: Eastern Europe Market Y-o-Y Growth (%) Projections by Sales Channel, 2023 to 2033

Figure 93: Eastern Europe Market Attractiveness by Product Type, 2023 to 2033

Figure 94: Eastern Europe Market Attractiveness by Vehicle Type, 2023 to 2033

Figure 95: Eastern Europe Market Attractiveness by Sales Channel, 2023 to 2033

Figure 96: Eastern Europe Market Attractiveness by Country, 2023 to 2033

Figure 97: Western Europe Market Value (US$ Million) by Product Type, 2023 to 2033

Figure 98: Western Europe Market Value (US$ Million) by Vehicle Type, 2023 to 2033

Figure 99: Western Europe Market Value (US$ Million) by Sales Channel, 2023 to 2033

Figure 100: Western Europe Market Value (US$ Million) by Country, 2023 to 2033

Figure 101: Western Europe Market Value (US$ Million) Analysis by Country, 2017 to 2033

Figure 102: Western Europe Market Volume (Units) Analysis by Country, 2017 to 2033

Figure 103: Western Europe Market Value Share (%) and BPS Analysis by Country, 2023 to 2033

Figure 104: Western Europe Market Y-o-Y Growth (%) Projections by Country, 2023 to 2033

Figure 105: Western Europe Market Value (US$ Million) Analysis by Product Type, 2017 to 2033

Figure 106: Western Europe Market Volume (Units) Analysis by Product Type, 2017 to 2033

Figure 107: Western Europe Market Value Share (%) and BPS Analysis by Product Type, 2023 to 2033

Figure 108: Western Europe Market Y-o-Y Growth (%) Projections by Product Type, 2023 to 2033

Figure 109: Western Europe Market Value (US$ Million) Analysis by Vehicle Type, 2017 to 2033

Figure 110: Western Europe Market Volume (Units) Analysis by Vehicle Type, 2017 to 2033

Figure 111: Western Europe Market Value Share (%) and BPS Analysis by Vehicle Type, 2023 to 2033

Figure 112: Western Europe Market Y-o-Y Growth (%) Projections by Vehicle Type, 2023 to 2033

Figure 113: Western Europe Market Value (US$ Million) Analysis by Sales Channel, 2017 to 2033

Figure 114: Western Europe Market Volume (Units) Analysis by Sales Channel, 2017 to 2033

Figure 115: Western Europe Market Value Share (%) and BPS Analysis by Sales Channel, 2023 to 2033

Figure 116: Western Europe Market Y-o-Y Growth (%) Projections by Sales Channel, 2023 to 2033

Figure 117: Western Europe Market Attractiveness by Product Type, 2023 to 2033

Figure 118: Western Europe Market Attractiveness by Vehicle Type, 2023 to 2033

Figure 119: Western Europe Market Attractiveness by Sales Channel, 2023 to 2033

Figure 120: Western Europe Market Attractiveness by Country, 2023 to 2033

Figure 121: APEJ Market Value (US$ Million) by Product Type, 2023 to 2033

Figure 122: APEJ Market Value (US$ Million) by Vehicle Type, 2023 to 2033

Figure 123: APEJ Market Value (US$ Million) by Sales Channel, 2023 to 2033

Figure 124: APEJ Market Value (US$ Million) by Country, 2023 to 2033

Figure 125: APEJ Market Value (US$ Million) Analysis by Country, 2017 to 2033

Figure 126: APEJ Market Volume (Units) Analysis by Country, 2017 to 2033

Figure 127: APEJ Market Value Share (%) and BPS Analysis by Country, 2023 to 2033

Figure 128: APEJ Market Y-o-Y Growth (%) Projections by Country, 2023 to 2033

Figure 129: APEJ Market Value (US$ Million) Analysis by Product Type, 2017 to 2033

Figure 130: APEJ Market Volume (Units) Analysis by Product Type, 2017 to 2033

Figure 131: APEJ Market Value Share (%) and BPS Analysis by Product Type, 2023 to 2033

Figure 132: APEJ Market Y-o-Y Growth (%) Projections by Product Type, 2023 to 2033

Figure 133: APEJ Market Value (US$ Million) Analysis by Vehicle Type, 2017 to 2033

Figure 134: APEJ Market Volume (Units) Analysis by Vehicle Type, 2017 to 2033

Figure 135: APEJ Market Value Share (%) and BPS Analysis by Vehicle Type, 2023 to 2033

Figure 136: APEJ Market Y-o-Y Growth (%) Projections by Vehicle Type, 2023 to 2033

Figure 137: APEJ Market Value (US$ Million) Analysis by Sales Channel, 2017 to 2033

Figure 138: APEJ Market Volume (Units) Analysis by Sales Channel, 2017 to 2033

Figure 139: APEJ Market Value Share (%) and BPS Analysis by Sales Channel, 2023 to 2033

Figure 140: APEJ Market Y-o-Y Growth (%) Projections by Sales Channel, 2023 to 2033

Figure 141: APEJ Market Attractiveness by Product Type, 2023 to 2033

Figure 142: APEJ Market Attractiveness by Vehicle Type, 2023 to 2033

Figure 143: APEJ Market Attractiveness by Sales Channel, 2023 to 2033

Figure 144: APEJ Market Attractiveness by Country, 2023 to 2033

Figure 145: Japan Market Value (US$ Million) by Product Type, 2023 to 2033

Figure 146: Japan Market Value (US$ Million) by Vehicle Type, 2023 to 2033

Figure 147: Japan Market Value (US$ Million) by Sales Channel, 2023 to 2033

Figure 148: Japan Market Value (US$ Million) by Country, 2023 to 2033

Figure 149: Japan Market Value (US$ Million) Analysis by Country, 2017 to 2033

Figure 150: Japan Market Volume (Units) Analysis by Country, 2017 to 2033

Figure 151: Japan Market Value Share (%) and BPS Analysis by Country, 2023 to 2033

Figure 152: Japan Market Y-o-Y Growth (%) Projections by Country, 2023 to 2033

Figure 153: Japan Market Value (US$ Million) Analysis by Product Type, 2017 to 2033

Figure 154: Japan Market Volume (Units) Analysis by Product Type, 2017 to 2033

Figure 155: Japan Market Value Share (%) and BPS Analysis by Product Type, 2023 to 2033

Figure 156: Japan Market Y-o-Y Growth (%) Projections by Product Type, 2023 to 2033

Figure 157: Japan Market Value (US$ Million) Analysis by Vehicle Type, 2017 to 2033

Figure 158: Japan Market Volume (Units) Analysis by Vehicle Type, 2017 to 2033

Figure 159: Japan Market Value Share (%) and BPS Analysis by Vehicle Type, 2023 to 2033

Figure 160: Japan Market Y-o-Y Growth (%) Projections by Vehicle Type, 2023 to 2033

Figure 161: Japan Market Value (US$ Million) Analysis by Sales Channel, 2017 to 2033

Figure 162: Japan Market Volume (Units) Analysis by Sales Channel, 2017 to 2033

Figure 163: Japan Market Value Share (%) and BPS Analysis by Sales Channel, 2023 to 2033

Figure 164: Japan Market Y-o-Y Growth (%) Projections by Sales Channel, 2023 to 2033

Figure 165: Japan Market Attractiveness by Product Type, 2023 to 2033

Figure 166: Japan Market Attractiveness by Vehicle Type, 2023 to 2033

Figure 167: Japan Market Attractiveness by Sales Channel, 2023 to 2033

Figure 168: Japan Market Attractiveness by Country, 2023 to 2033

Figure 169: MEA Market Value (US$ Million) by Product Type, 2023 to 2033

Figure 170: MEA Market Value (US$ Million) by Vehicle Type, 2023 to 2033

Figure 171: MEA Market Value (US$ Million) by Sales Channel, 2023 to 2033

Figure 172: MEA Market Value (US$ Million) by Country, 2023 to 2033

Figure 173: MEA Market Value (US$ Million) Analysis by Country, 2017 to 2033

Figure 174: MEA Market Volume (Units) Analysis by Country, 2017 to 2033

Figure 175: MEA Market Value Share (%) and BPS Analysis by Country, 2023 to 2033

Figure 176: MEA Market Y-o-Y Growth (%) Projections by Country, 2023 to 2033

Figure 177: MEA Market Value (US$ Million) Analysis by Product Type, 2017 to 2033

Figure 178: MEA Market Volume (Units) Analysis by Product Type, 2017 to 2033

Figure 179: MEA Market Value Share (%) and BPS Analysis by Product Type, 2023 to 2033

Figure 180: MEA Market Y-o-Y Growth (%) Projections by Product Type, 2023 to 2033

Figure 181: MEA Market Value (US$ Million) Analysis by Vehicle Type, 2017 to 2033

Figure 182: MEA Market Volume (Units) Analysis by Vehicle Type, 2017 to 2033

Figure 183: MEA Market Value Share (%) and BPS Analysis by Vehicle Type, 2023 to 2033

Figure 184: MEA Market Y-o-Y Growth (%) Projections by Vehicle Type, 2023 to 2033

Figure 185: MEA Market Value (US$ Million) Analysis by Sales Channel, 2017 to 2033

Figure 186: MEA Market Volume (Units) Analysis by Sales Channel, 2017 to 2033

Figure 187: MEA Market Value Share (%) and BPS Analysis by Sales Channel, 2023 to 2033

Figure 188: MEA Market Y-o-Y Growth (%) Projections by Sales Channel, 2023 to 2033

Figure 189: MEA Market Attractiveness by Product Type, 2023 to 2033

Figure 190: MEA Market Attractiveness by Vehicle Type, 2023 to 2033

Figure 191: MEA Market Attractiveness by Sales Channel, 2023 to 2033

Figure 192: MEA Market Attractiveness by Country, 2023 to 2033

Recommendations

Automotive

Camshaft Lifters Market

Published : February 2023

Automotive

Camshaft Bearings Market

Published : September 2018

Explore Automotive Insights

View Reports
Google translate

Automotive Camshaft Market