Automotive Navigation System Market Size, Share, and Forecast Outlook 2025 to 2035

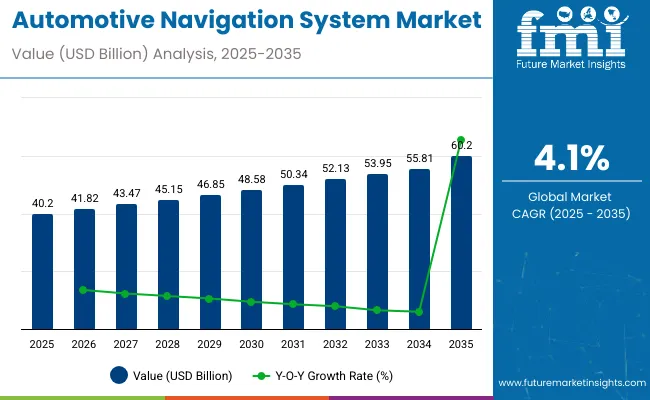
In 2025, the automotive navigation system market is valued at USD 40.2 billion and is projected to reach approximately USD 60.2 billion by 2035, reflecting a compound annual growth rate of 4.1%.
Quick Stats of Automotive Navigation System Market

  • Automotive Navigation System Market Size (2025): USD 40.2 Billion
  • Projected Automotive Navigation System Market Size (2035): USD 60.2 Billion
  • Forecast CAGR of Automotive Navigation System Market (2025 to 2035): 4.1 %
  • Leading Segment of Automotive Navigation System Market (2025): In-Dash Navigation System
  • Key Growth Regions of Automotive Navigation System Market: China, India, United States, United Kingdom, Germany
  • Top Key Players of Automotive Navigation System Market: TomTom, Continental, Alpine, Robert Bosch GmbH, Faurecia

Automotive Navigation System Market

Metric Value
Industry Size (2025E) USD 40.2 billion
Industry Value (2035F) USD 60.2 billion
CAGR (2025 to 2035) 4.1%

Breakpoint analysis indicates key thresholds where market dynamics are expected to shift, driven by technological advancements, regulatory policies, and evolving consumer preferences. The multiplying factor over the ten-year period is around 1.5, showing moderate but steady growth, with incremental value accumulation each year as automotive manufacturers integrate advanced navigation features in both passenger and commercial vehicles.

From 2025 to 2035, several breakpoints are likely to influence market adoption. Initial growth is expected from enhanced GPS functionality, real-time traffic updates, and integration with in-vehicle infotainment systems. Mid-period breakpoints may arise from wider deployment of connected car technologies, over-the-air map updates, and integration with autonomous driving assistance systems, boosting demand for sophisticated navigation solutions.

Towards 2035, adoption is anticipated to be further driven by AI-enabled predictive navigation, smart city connectivity, and seamless integration with mobility-as-a-service platforms. The absolute dollar opportunity over this period emphasizes the cumulative incremental revenue potential for system providers, software developers, and vehicle manufacturers. These breakpoints collectively outline the evolving trajectory of the automotive navigation system market, highlighting stages where growth accelerates due to technological and market-driven triggers.

The automotive navigation system market is supported by five parent markets with varying contributions. Automotive electronics accounts for approximately 35%, supplying hardware, sensors, and navigation modules. Automotive infotainment contributes around 25%, integrating multimedia systems with GPS and real-time traffic updates. The global automotive market represents about 20%, driving adoption through new vehicle sales and fleet upgrades.

Telecommunication and connectivity account for roughly 15%, enabling 4G/5G connections, satellite navigation, and vehicle-to-infrastructure communication. Information and communication technology (ICT) contributes nearly 5%, supporting cloud platforms, mapping services, and software updates. These markets collectively enhance the reach and functionality of automotive navigation systems worldwide.

Recent trends in the automotive navigation system market focus on AI integration, connectivity, and strategic collaborations. Key players such as Garmin, TomTom, Bosch, and Continental are developing cloud-based navigation platforms with real-time traffic prediction, route optimization, and lane-level guidance. Integration with autonomous driving and advanced driver assistance systems is increasing, while over-the-air updates and IoT-enabled connectivity improve accuracy and functionality.

Companies are forming partnerships with telecommunication providers and automotive manufacturers to expand connected car services. Smart navigation solutions, voice-activated controls, and multi-modal routing strategies are reshaping the market, driving adoption across passenger vehicles, commercial fleets, and electric mobility platforms.

Top Automotive Navigation System Market Dynamics

The automotive navigation system market is expanding rapidly due to rising vehicle production and growing demand for advanced driver assistance systems. Global installation of navigation systems exceeded 80 million units in 2024, with Asia Pacific and North America accounting for nearly 65% of total adoption.

Increasing consumer preference for in-car connectivity, real-time traffic updates, and integrated infotainment systems is driving market penetration. OEMs are introducing advanced GPS, AI-enabled route optimization, and voice-controlled navigation features to enhance user experience. The growth of electric vehicles and connected cars further boosts demand for integrated navigation systems.

Driving Force Growing Demand for Connected and Smart Vehicles

Rising vehicle production and consumer preference for connected cars are primary drivers. On average, 70-85% of mid to high-end vehicles in North America and Europe are equipped with factory-fitted navigation systems. Increasing adoption of electric vehicles, which rely on accurate route planning and charging station location data, further accelerates market growth.

Fleet operators are integrating navigation systems to optimize delivery routes, reduce fuel consumption by up to 15%, and improve operational efficiency. Government initiatives for smart transportation networks and infrastructure upgrades in Asia Pacific also contribute to demand. Manufacturers are integrating real-time traffic, weather, and hazard alerts to improve navigation reliability and overall driving safety.

  • 70-85% of mid to high-end vehicles in North America and Europe have navigation systems.
  • Fleet integration reduces fuel consumption by up to 15%.
  • Smart transportation initiatives in Asia Pacific drive adoption.

Growth Avenue Technological Innovation and AI Integration

Advanced AI and cloud connectivity are transforming navigation systems into intelligent vehicle companions. Real-time traffic analysis, predictive routing, and integration with infotainment systems enhance travel efficiency. Autonomous and semi-autonomous vehicles rely heavily on precise navigation systems with centimeter-level GPS accuracy.

Software updates over-the-air enable map and firmware updates for millions of vehicles, reducing maintenance downtime by 10-12%. Increasing integration with smartphones, IoT devices, and vehicle telematics expands functionality, including parking guidance, hazard alerts, and fuel-efficient routing. Modular navigation systems compatible with multiple vehicle models allow OEMs to reduce production complexity. Manufacturers are investing in augmented reality-based heads-up displays to improve driver decision-making and safety.

  • Centimeter-level GPS accuracy supports autonomous vehicles.
  • Over-the-air updates reduce maintenance downtime by 10-12%.
  • Integration with IoT devices and vehicle telematics enhances functionality.

Emerging Trend Expansion in Asia Pacific and EV Integration

Asia Pacific is witnessing rapid adoption due to rising vehicle production, smart city initiatives, and increased use of electric vehicles. Annual growth in China, India, and Japan ranges between 6-9%. EV manufacturers incorporate advanced navigation to optimize charging station access and route efficiency. High smartphone penetration supports integration with connected navigation apps for real-time traffic and hazard alerts.

Fleet management solutions in logistics and ride-hailing services rely on AI-based navigation to improve delivery times by up to 20%. Government investments in intelligent transportation systems and smart highways also support navigation system deployment. Compact and affordable systems for small passenger vehicles are increasing adoption in semi-urban and tier-2 cities.

  • Asia Pacific accounts for rapid adoption with 6-9% annual growth in key markets.
  • AI-based fleet navigation improves delivery times by up to 20%.
  • EV integration increases demand for route and charging optimization.

Market Challenge High Cost and Software Complexity

Advanced automotive navigation systems require significant investment, with prices ranging from USD 300 to 1,200 per unit depending on features and compatibility. Software maintenance, including map updates, firmware patches, and AI algorithm calibration, adds 8-10% annually to operating costs. Integration challenges arise when retrofitting vehicles without factory-fitted systems.

Hardware and sensor calibration errors can reduce routing accuracy by 5-8%, affecting customer satisfaction. Regulatory requirements for location data privacy in Europe, North America, and Asia Pacific add operational complexity. Manufacturers must balance upfront costs, software reliability, and integration efficiency to ensure system performance and customer satisfaction while keeping total cost of ownership competitive across vehicle segments.
  • Unit prices range from USD 300 to 1,200 depending on features.
  • Annual software maintenance adds 8-10% to operating costs.
  • Routing accuracy can drop 5-8% if hardware calibration is insufficient.

Top Countries Leading Automotive Navigation System Market Growth

Automotive Navigation System Market By Country

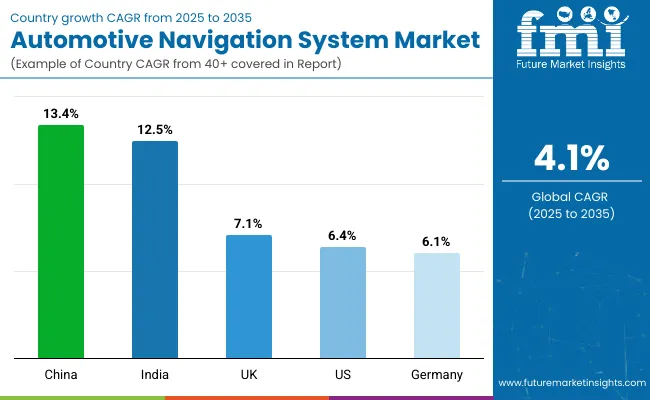
The global automotive navigation system market is expected to expand at a CAGR of 4.1% from 2025 to 2035. China leads with 13.4%, surpassing the global average by +227%, supported by widespread adoption of smart vehicles and brics-driven digital transport programs. India follows at 12.5%, or +205% above the global rate, driven by asean-linked initiatives and rising demand for connected mobility solutions.

The United Kingdom registers 7.1%, a +73% premium, reflecting gradual integration of advanced navigation systems within oecd markets. The United States grows at 6.4%, or +56% higher than the global benchmark, fueled by infrastructure upgrades and vehicle technology enhancements. Germany posts 6.1%, +49% above the global level, supported by systematic deployment of in-vehicle navigation solutions and automotive innovation. The trend indicates faster adoption in brics countries, while oecd economies are progressing at a moderate but steady pace.

Demand Forecast for Automotive Navigation System Market in China

The automotive navigation system market in China is growing at a CAGR of 13.4%, driven by rapid adoption of connected cars, smart mobility solutions, and integration of AI-powered navigation features. Increasing vehicle production and rising consumer interest in in-car technology accelerate market expansion. Manufacturers are focusing on developing advanced navigation systems with real-time traffic updates, voice-assisted controls, and integration with smart city infrastructure.

Premium and mid-range vehicles are increasingly equipped with navigation systems as standard features, enhancing driver convenience and safety. The market is also supported by government initiatives to improve road network management and digital mapping infrastructure.

  • Over 70% of new vehicles in China equipped with integrated navigation systems by 2026
  • AI-powered predictive traffic features expected to increase user adoption by 20%
  • Connected navigation systems supporting smart city integration projected to grow 25% annually

Automotive Navigation System Market Growth Outlook in India

The demand of automotive navigation system in India is expanding at a CAGR of 12.5%, supported by increasing vehicle sales and rising demand for connected car technologies. Consumer preference for vehicles with advanced infotainment and navigation features drives adoption across passenger and commercial vehicles.

Manufacturers are introducing affordable navigation systems with real-time traffic updates, cloud-based mapping, and mobile integration. Rapid expansion of national highways and improved road infrastructure further encourage system deployment. Fleet operators are investing in GPS-enabled navigation to optimize routes and reduce travel time, particularly for logistics and ride-hailing services.

  • GPS-enabled fleet navigation adoption expected to reach 45% by 2026
  • Real-time traffic update integration projected to increase system usage by 18%
  • Cloud-based navigation system deployment rising among mid-range vehicle segments

Reach of Automotive Navigation System Market in the United Kingdom

The automotive navigation system market in the United Kingdom is growing at a CAGR of 7.1%, fueled by consumer demand for in-car connectivity and smart navigation solutions. Vehicle manufacturers are equipping new cars with integrated GPS and AI-assisted navigation features. Increased adoption of electric vehicles with navigation optimization for charging stations contributes to market growth. Connectivity solutions allowing smartphone integration and real-time route optimization are gaining traction. Both private and commercial vehicle segments are upgrading fleets with advanced navigation systems to improve efficiency and driver convenience.

  • Electric vehicle navigation systems with charging route optimization projected to grow 30% by 2026
  • Smartphone-integrated navigation solutions adopted in over 60% of new cars
  • Commercial fleet operators expected to increase navigation system integration by 22%

Automotive Navigation System Market Forecast in Germany

The automotive navigation system industry in Germany is expanding at a CAGR of 6.1%, driven by a strong automotive industry and the adoption of connected vehicles. Luxury and mid-range vehicles increasingly feature advanced navigation systems with real-time traffic monitoring, lane guidance, and predictive route planning. Integration with vehicle safety systems and infotainment modules enhances consumer experience. Automotive navigation adoption is also driven by smart highway systems and increasing use of digital maps for logistics and fleet operations. German manufacturers are focusing on combining autonomous driving support with navigation system enhancements.

  • Predictive route planning technology expected in 40% of new vehicles by 2026
  • Fleet operators integrating navigation systems with logistics software projected to rise 15%
  • Advanced map update frequency for real-time traffic data adoption growing steadily

Automotive Navigation System Market Growth Analysis in the United States

The demand of automotive navigation system in the United States is growing at a CAGR of 6.4%, driven by high penetration of connected vehicles and increasing demand for driver assistance technologies. Navigation systems with AI-enabled traffic prediction, voice control, and over-the-air updates are becoming standard features in new cars.

Fleet operators are integrating GPS and telematics-enabled navigation solutions to improve route efficiency. Growing adoption of electric vehicles and hybrid cars with navigation-optimized charging routes supports market expansion. Consumer preference for vehicles with integrated infotainment and navigation features also contributes to growth.
  • Over 65% of new vehicles expected to have integrated navigation systems by 2026
  • AI-driven traffic prediction features adoption projected to increase by 18%
  • Fleet operators optimizing routes using navigation integration expected to grow 20%

Leading Automotive Navigation System Manufacturers, Suppliers, Distributors

Automotive Navigation System Market By Company

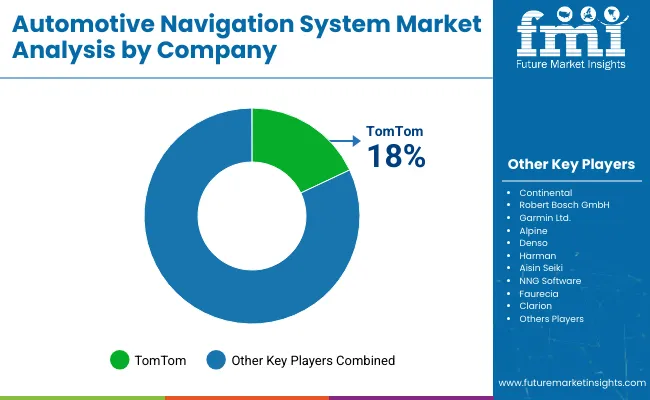
The automotive navigation system market is driven by established players and emerging companies, each leveraging distinct strategies to strengthen their presence. TomTom focuses on expanding its mapping and navigation services through regular product launches and partnerships with vehicle manufacturers.

Continental invests in research and development to enhance system accuracy and integration with in-vehicle infotainment, while Alpine targets premium automotive segments with advanced multimedia and navigation solutions. Robert Bosch GmbH emphasizes connected mobility platforms, offering navigation systems that integrate with driver assistance and fleet management tools. Faurecia has been exploring collaborations with automakers to provide tailor-made navigation solutions that enhance driver convenience and operational efficiency.

Other key players such as Clarion, Garmin Ltd., NNG Software, Denso, Aisin Seiki, and Harman are actively enhancing their offerings to meet evolving customer expectations. Clarion has introduced high-resolution navigation displays for improved usability, while Garmin invests in map updates and connected vehicle features to support real-time guidance.

NNG Software provides software platforms that allow automakers to customize navigation functions for diverse markets. Denso and Aisin Seiki continue to develop integrated navigation modules for electric and hybrid vehicles, and Harman focuses on seamless infotainment and navigation system integration. Collectively, these companies strengthen their market presence through product enhancements, strategic partnerships, and global distribution networks, maintaining competitiveness in the automotive navigation system industry.

Recent Industry Developments

  • In April 2025, Baidu introduced V21 map, aimed at improving vehicle navigation performance
  • Here Technologies partnered with ECARX in April 2025 to launch an in-car navigation solution
  • In March 2025, STMicroelectronics launched Teseo VI, a series of global navigation satellite system receivers enhancing automotive guidance

Leading Players

  • TomTom
  • Continental
  • Robert Bosch GmbH
  • Garmin Ltd.
  • Alpine
  • Denso
  • Harman
  • Aisin Seiki
  • NNG Software
  • Faurecia
  • Clarion

Report Scope

Report Attributes Details
Market Size (2025) USD 40.2 billion
Projected Market Size (2035) USD 60.2 billion
CAGR (2025 to 2035) 4.1%
Base Year for Estimation 2024
Historical Period 2020 to 2024
Projections Period 2025 to 2035
Quantitative Units USD billion for value
Device Types Analyzed (Segment 1) In-Dash Navigation System, Portable Navigation System, Mobile Navigation System
Propulsion Types Analyzed (Segment 2) Electric Vehicle, ICE
Vehicle Types Analyzed (Segment 3) Passenger Car, Light Commercial Vehicles, Heavy Commercial Vehicles
Sales Channels Analyzed (Segment 4) OEM, Aftermarket
Regions Covered North America; Latin America; Europe; Asia Pacific; Middle East & Africa
Countries Covered United States, Canada, Brazil, Mexico, Germany, United Kingdom, France, Italy, China, Japan, India, UAE, South Africa
Key Players Influencing the Market TomTom, Continental, Robert Bosch GmbH, Garmin Ltd., Alpine, Denso, Harman, Aisin Seiki, NNG Software, Faurecia, Clarion
Additional Attributes Dollar sales by system type and vehicle segment, demand dynamics across passenger, commercial, and luxury vehicles, regional adoption trends, innovation in AI route optimization, real-time traffic updates, environmental impact of fuel savings, and emerging use in connected and autonomous cars.

Automotive Navigation System Market Analyzed by Key Investment Segments 

By Device Type:

  • In-Dash Navigation System
  • Portable Navigation System
  • Mobile Navigation System

By Propulsion:

  • Electric Vehicle
  • ICE

By Vehicle Type:

  • Passenger Car
  • Light Commercial Vehicles
  • Heavy Commercial Vehicles

By Sales Channel:

  • OEM
  • Aftermarket

By Region:

  • North America
  • Latin America
  • Europe
  • Asia Pacific
  • Middle East and Africa

Table of Content

  1. Executive Summary
    • Global Market Outlook
    • Demand-side Trends
    • Supply-side Trends
    • Technology Roadmap Analysis
    • Analysis and Recommendations
  2. Market Overview
    • Market Coverage / Taxonomy
    • Market Definition / Scope / Limitations
  3. Market Background
    • Market Dynamics
      • Drivers
      • Restraints
      • Opportunity
      • Trends
    • Scenario Forecast
      • Demand in Optimistic Scenario
      • Demand in Likely Scenario
      • Demand in Conservative Scenario
    • Opportunity Map Analysis
    • Product Life Cycle Analysis
    • Supply Chain Analysis
      • Supply Side Participants and their Roles
        • Producers
        • Mid-Level Participants (Traders/ Agents/ Brokers)
        • Wholesalers and Distributors
      • Value Added and Value Created at Node in the Supply Chain
      • List of Raw Material Suppliers
      • List of Existing and Potential Buyer’s
    • Investment Feasibility Matrix
    • Value Chain Analysis
      • Profit Margin Analysis
      • Wholesalers and Distributors
      • Retailers
    • PESTLE and Porter’s Analysis
    • Regulatory Landscape
      • By Key Regions
      • By Key Countries
    • Regional Parent Market Outlook
    • Production and Consumption Statistics
    • Import and Export Statistics
  4. Global Market Analysis 2020 to 2024 and Forecast, 2025 to 2035
    • Historical Market Size Value (USD Billion) & Volume (Units) Analysis, 2020 to 2024
    • Current and Future Market Size Value (USD Billion) & Volume (Units) Projections, 2025 to 2035
      • Y-o-Y Growth Trend Analysis
      • Absolute $ Opportunity Analysis
  5. Global Market Pricing Analysis 2020 to 2024 and Forecast 2025 to 2035
  6. Global Market Analysis 2020 to 2024 and Forecast 2025 to 2035, By Device Type
    • Introduction / Key Findings
    • Historical Market Size Value (USD Billion) & Volume (Units) Analysis By Device Type, 2020 to 2024
    • Current and Future Market Size Value (USD Billion) & Volume (Units) Analysis and Forecast By Device Type, 2025 to 2035
      • In-Dash Navigation System
      • Mobile Navigation System
      • Portable Navigation System
    • Y-o-Y Growth Trend Analysis By Device Type, 2020 to 2024
    • Absolute $ Opportunity Analysis By Device Type, 2025 to 2035
  7. Global Market Analysis 2020 to 2024 and Forecast 2025 to 2035, By Propulsion
    • Introduction / Key Findings
    • Historical Market Size Value (USD Billion) & Volume (Units) Analysis By Propulsion, 2020 to 2024
    • Current and Future Market Size Value (USD Billion) & Volume (Units) Analysis and Forecast By Propulsion, 2025 to 2035
      • Internal Combustion Engine (ICE)
      • Electric Vehicle (EV)
    • Y-o-Y Growth Trend Analysis By Propulsion, 2020 to 2024
    • Absolute $ Opportunity Analysis By Propulsion, 2025 to 2035
  8. Global Market Analysis 2020 to 2024 and Forecast 2025 to 2035, By Vehicle Type
    • Introduction / Key Findings
    • Historical Market Size Value (USD Billion) & Volume (Units) Analysis By Vehicle Type, 2020 to 2024
    • Current and Future Market Size Value (USD Billion) & Volume (Units) Analysis and Forecast By Vehicle Type, 2025 to 2035
      • Passenger Car
      • Light Commercial Vehicle
      • Heavy Commercial Vehicle
    • Y-o-Y Growth Trend Analysis By Vehicle Type, 2020 to 2024
    • Absolute $ Opportunity Analysis By Vehicle Type, 2025 to 2035
  9. Global Market Analysis 2020 to 2024 and Forecast 2025 to 2035, By Sales Channel
    • Introduction / Key Findings
    • Historical Market Size Value (USD Billion) & Volume (Units) Analysis By Sales Channel, 2020 to 2024
    • Current and Future Market Size Value (USD Billion) & Volume (Units) Analysis and Forecast By Sales Channel, 2025 to 2035
      • OEM (Original Equipment Manufacturer)
      • Aftermarket
    • Y-o-Y Growth Trend Analysis By Sales Channel, 2020 to 2024
    • Absolute $ Opportunity Analysis By Sales Channel, 2025 to 2035
  10. Global Market Analysis 2020 to 2024 and Forecast 2025 to 2035, By Region
    • Introduction
    • Historical Market Size Value (USD Billion) & Volume (Units) Analysis By Region, 2020 to 2024
    • Current Market Size Value (USD Billion) & Volume (Units) Analysis and Forecast By Region, 2025 to 2035
      • North America
      • Latin America
      • Western Europe
      • Eastern Europe
      • East Asia
      • South Asia & Pacific
      • Middle East and Africa
    • Market Attractiveness Analysis By Region
  11. North America Market Analysis 2020 to 2024 and Forecast 2025 to 2035, By Country
    • Historical Market Size Value (USD Billion) & Volume (Units) Trend Analysis By Market Taxonomy, 2020 to 2024
    • Market Size Value (USD Billion) & Volume (Units) Forecast By Market Taxonomy, 2025 to 2035
      • By Country
        • USA
        • Canada
        • Mexico
      • By Device Type
      • By Propulsion
      • By Vehicle Type
      • By Sales Channel
    • Market Attractiveness Analysis
      • By Country
      • By Device Type
      • By Propulsion
      • By Vehicle Type
      • By Sales Channel
    • Key Takeaways
  12. Latin America Market Analysis 2020 to 2024 and Forecast 2025 to 2035, By Country
    • Historical Market Size Value (USD Billion) & Volume (Units) Trend Analysis By Market Taxonomy, 2020 to 2024
    • Market Size Value (USD Billion) & Volume (Units) Forecast By Market Taxonomy, 2025 to 2035
      • By Country
        • Brazil
        • Argentina
        • Rest of LATAM
      • By Device Type
      • By Propulsion
      • By Vehicle Type
      • By Sales Channel
    • Market Attractiveness Analysis
      • By Country
      • By Device Type
      • By Propulsion
      • By Vehicle Type
      • By Sales Channel
    • Key Takeaways
  13. Western Europe Market Analysis 2020 to 2024 and Forecast 2025 to 2035, By Country
    • Historical Market Size Value (USD Billion) & Volume (Units) Trend Analysis By Market Taxonomy, 2020 to 2024
    • Market Size Value (USD Billion) & Volume (Units) Forecast By Market Taxonomy, 2025 to 2035
      • By Country
        • Germany
        • Italy
        • France
        • UK
        • Spain
        • BENELUX
        • Nordic
        • Rest of W.Europe
      • By Device Type
      • By Propulsion
      • By Vehicle Type
      • By Sales Channel
    • Market Attractiveness Analysis
      • By Country
      • By Device Type
      • By Propulsion
      • By Vehicle Type
      • By Sales Channel
    • Key Takeaways
  14. Eastern Europe Market Analysis 2020 to 2024 and Forecast 2025 to 2035, By Country
    • Historical Market Size Value (USD Billion) & Volume (Units) Trend Analysis By Market Taxonomy, 2020 to 2024
    • Market Size Value (USD Billion) & Volume (Units) Forecast By Market Taxonomy, 2025 to 2035
      • By Country
        • Russia
        • Hungary
        • Poland
        • Balkan & Baltics
        • Rest of E. Europe
      • By Device Type
      • By Propulsion
      • By Vehicle Type
      • By Sales Channel
    • Market Attractiveness Analysis
      • By Country
      • By Device Type
      • By Propulsion
      • By Vehicle Type
      • By Sales Channel
    • Key Takeaways
  15. East Asia Market Analysis 2020 to 2024 and Forecast 2025 to 2035, By Country
    • Historical Market Size Value (USD Billion) & Volume (Units) Trend Analysis By Market Taxonomy, 2020 to 2024
    • Market Size Value (USD Billion) & Volume (Units) Forecast By Market Taxonomy, 2025 to 2035
      • By Country
        • China
        • Japan
        • South Korea
      • By Device Type
      • By Propulsion
      • By Vehicle Type
      • By Sales Channel
    • Market Attractiveness Analysis
      • By Country
      • By Device Type
      • By Propulsion
      • By Vehicle Type
      • By Sales Channel
    • Key Takeaways
  16. South Asia & Pacific Market Analysis 2020 to 2024 and Forecast 2025 to 2035, By Country
    • Historical Market Size Value (USD Billion) & Volume (Units) Trend Analysis By Market Taxonomy, 2020 to 2024
    • Market Size Value (USD Billion) & Volume (Units) Forecast By Market Taxonomy, 2025 to 2035
      • By Country
        • India
        • Australia & New Zealand
        • ASEAN
        • Rest of SAP
      • By Device Type
      • By Propulsion
      • By Vehicle Type
      • By Sales Channel
    • Market Attractiveness Analysis
      • By Country
      • By Device Type
      • By Propulsion
      • By Vehicle Type
      • By Sales Channel
    • Key Takeaways
  17. Middle East and Africa Market Analysis 2020 to 2024 and Forecast 2025 to 2035, By Country
    • Historical Market Size Value (USD Billion) & Volume (Units) Trend Analysis By Market Taxonomy, 2020 to 2024
    • Market Size Value (USD Billion) & Volume (Units) Forecast By Market Taxonomy, 2025 to 2035
      • By Country
        • GCC Countries
        • Northern Africa
        • South Africa
        • Turkiye
        • Rest of MEA
      • By Device Type
      • By Propulsion
      • By Vehicle Type
      • By Sales Channel
    • Market Attractiveness Analysis
      • By Country
      • By Device Type
      • By Propulsion
      • By Vehicle Type
      • By Sales Channel
    • Key Takeaways
  18. Key Countries Market Analysis
    • USA
      • Pricing Analysis
      • Market Share Analysis, 2024
        • By Device Type
        • By Propulsion
        • By Vehicle Type
        • By Sales Channel
    • Canada
      • Pricing Analysis
      • Market Share Analysis, 2024
        • By Device Type
        • By Propulsion
        • By Vehicle Type
        • By Sales Channel
    • Brazil
      • Pricing Analysis
      • Market Share Analysis, 2024
        • By Device Type
        • By Propulsion
        • By Vehicle Type
        • By Sales Channel
    • Mexico
      • Pricing Analysis
      • Market Share Analysis, 2024
        • By Device Type
        • By Propulsion
        • By Vehicle Type
        • By Sales Channel
    • Argentina
      • Pricing Analysis
      • Market Share Analysis, 2024
        • By Device Type
        • By Propulsion
        • By Vehicle Type
        • By Sales Channel
  19. Market Structure Analysis
    • Competition Dashboard
    • Competition Benchmarking
    • Market Share Analysis of Top Players
      • By Regional
      • By Device Type
      • By Propulsion
      • By Vehicle Type
      • By Sales Channel
  20. Competition Analysis
    • Competition Deep Dive
      • TomTom
        • Overview
        • Product Portfolio
        • Profitability by Market Segments (Product/Age /Sales Channel/Region)
        • Sales Footprint
        • Strategy Overview
          • Marketing Strategy
          • Product Strategy
          • Channel Strategy
      • Continental
        • Overview
        • Product Portfolio
        • Profitability by Market Segments (Product/Age /Sales Channel/Region)
        • Sales Footprint
        • Strategy Overview
          • Marketing Strategy
          • Product Strategy
          • Channel Strategy
      • Robert Bosch GmbH
        • Overview
        • Product Portfolio
        • Profitability by Market Segments (Product/Age /Sales Channel/Region)
        • Sales Footprint
        • Strategy Overview
          • Marketing Strategy
          • Product Strategy
          • Channel Strategy
      • Garmin Ltd.
        • Overview
        • Product Portfolio
        • Profitability by Market Segments (Product/Age /Sales Channel/Region)
        • Sales Footprint
        • Strategy Overview
          • Marketing Strategy
          • Product Strategy
          • Channel Strategy
      • Alpine
        • Overview
        • Product Portfolio
        • Profitability by Market Segments (Product/Age /Sales Channel/Region)
        • Sales Footprint
        • Strategy Overview
          • Marketing Strategy
          • Product Strategy
          • Channel Strategy
      • Denso
        • Overview
        • Product Portfolio
        • Profitability by Market Segments (Product/Age /Sales Channel/Region)
        • Sales Footprint
        • Strategy Overview
          • Marketing Strategy
          • Product Strategy
          • Channel Strategy
      • Harman
        • Overview
        • Product Portfolio
        • Profitability by Market Segments (Product/Age /Sales Channel/Region)
        • Sales Footprint
        • Strategy Overview
          • Marketing Strategy
          • Product Strategy
          • Channel Strategy
      • Aisin Seiki
        • Overview
        • Product Portfolio
        • Profitability by Market Segments (Product/Age /Sales Channel/Region)
        • Sales Footprint
        • Strategy Overview
          • Marketing Strategy
          • Product Strategy
          • Channel Strategy
      • NNG Software
        • Overview
        • Product Portfolio
        • Profitability by Market Segments (Product/Age /Sales Channel/Region)
        • Sales Footprint
        • Strategy Overview
          • Marketing Strategy
          • Product Strategy
          • Channel Strategy
      • Faurecia
        • Overview
        • Product Portfolio
        • Profitability by Market Segments (Product/Age /Sales Channel/Region)
        • Sales Footprint
        • Strategy Overview
          • Marketing Strategy
          • Product Strategy
          • Channel Strategy
      • Clarion
        • Overview
        • Product Portfolio
        • Profitability by Market Segments (Product/Age /Sales Channel/Region)
        • Sales Footprint
        • Strategy Overview
          • Marketing Strategy
          • Product Strategy
          • Channel Strategy
  21. Assumptions & Acronyms Used
  22. Research Methodology

List of Tables

  • Table 1: Global Market Value (USD Billion) Forecast by Region, 2020-2035
  • Table 2: Global Market Volume (Units) Forecast by Region, 2020-2035
  • Table 3: Global Market Value (USD Billion) Forecast by Device Type, 2020-2035
  • Table 4: Global Market Volume (Units) Forecast by Device Type, 2020-2035
  • Table 5: Global Market Value (USD Billion) Forecast by Propulsion, 2020-2035
  • Table 6: Global Market Volume (Units) Forecast by Propulsion, 2020-2035
  • Table 7: Global Market Value (USD Billion) Forecast by Vehicle Type, 2020-2035
  • Table 8: Global Market Volume (Units) Forecast by Vehicle Type, 2020-2035
  • Table 9: Global Market Value (USD Billion) Forecast by Sales Channel, 2020-2035
  • Table 10: Global Market Volume (Units) Forecast by Sales Channel, 2020-2035
  • Table 11: North America Market Value (USD Billion) Forecast by Country, 2020-2035
  • Table 12: North America Market Volume (Units) Forecast by Country, 2020-2035
  • Table 13: North America Market Value (USD Billion) Forecast by Device Type, 2020-2035
  • Table 14: North America Market Volume (Units) Forecast by Device Type, 2020-2035
  • Table 15: North America Market Value (USD Billion) Forecast by Propulsion, 2020-2035
  • Table 16: North America Market Volume (Units) Forecast by Propulsion, 2020-2035
  • Table 17: North America Market Value (USD Billion) Forecast by Vehicle Type, 2020-2035
  • Table 18: North America Market Volume (Units) Forecast by Vehicle Type, 2020-2035
  • Table 19: North America Market Value (USD Billion) Forecast by Sales Channel, 2020-2035
  • Table 20: North America Market Volume (Units) Forecast by Sales Channel, 2020-2035
  • Table 21: Latin America Market Value (USD Billion) Forecast by Country, 2020-2035
  • Table 22: Latin America Market Volume (Units) Forecast by Country, 2020-2035
  • Table 23: Latin America Market Value (USD Billion) Forecast by Device Type, 2020-2035
  • Table 24: Latin America Market Volume (Units) Forecast by Device Type, 2020-2035
  • Table 25: Latin America Market Value (USD Billion) Forecast by Propulsion, 2020-2035
  • Table 26: Latin America Market Volume (Units) Forecast by Propulsion, 2020-2035
  • Table 27: Latin America Market Value (USD Billion) Forecast by Vehicle Type, 2020-2035
  • Table 28: Latin America Market Volume (Units) Forecast by Vehicle Type, 2020-2035
  • Table 29: Latin America Market Value (USD Billion) Forecast by Sales Channel, 2020-2035
  • Table 30: Latin America Market Volume (Units) Forecast by Sales Channel, 2020-2035
  • Table 31: Western Europe Market Value (USD Billion) Forecast by Country, 2020-2035
  • Table 32: Western Europe Market Volume (Units) Forecast by Country, 2020-2035
  • Table 33: Western Europe Market Value (USD Billion) Forecast by Device Type, 2020-2035
  • Table 34: Western Europe Market Volume (Units) Forecast by Device Type, 2020-2035
  • Table 35: Western Europe Market Value (USD Billion) Forecast by Propulsion, 2020-2035
  • Table 36: Western Europe Market Volume (Units) Forecast by Propulsion, 2020-2035
  • Table 37: Western Europe Market Value (USD Billion) Forecast by Vehicle Type, 2020-2035
  • Table 38: Western Europe Market Volume (Units) Forecast by Vehicle Type, 2020-2035
  • Table 39: Western Europe Market Value (USD Billion) Forecast by Sales Channel, 2020-2035
  • Table 40: Western Europe Market Volume (Units) Forecast by Sales Channel, 2020-2035
  • Table 41: Eastern Europe Market Value (USD Billion) Forecast by Country, 2020-2035
  • Table 42: Eastern Europe Market Volume (Units) Forecast by Country, 2020-2035
  • Table 43: Eastern Europe Market Value (USD Billion) Forecast by Device Type, 2020-2035
  • Table 44: Eastern Europe Market Volume (Units) Forecast by Device Type, 2020-2035
  • Table 45: Eastern Europe Market Value (USD Billion) Forecast by Propulsion, 2020-2035
  • Table 46: Eastern Europe Market Volume (Units) Forecast by Propulsion, 2020-2035
  • Table 47: Eastern Europe Market Value (USD Billion) Forecast by Vehicle Type, 2020-2035
  • Table 48: Eastern Europe Market Volume (Units) Forecast by Vehicle Type, 2020-2035
  • Table 49: Eastern Europe Market Value (USD Billion) Forecast by Sales Channel, 2020-2035
  • Table 50: Eastern Europe Market Volume (Units) Forecast by Sales Channel, 2020-2035
  • Table 51: East Asia Market Value (USD Billion) Forecast by Country, 2020-2035
  • Table 52: East Asia Market Volume (Units) Forecast by Country, 2020-2035
  • Table 53: East Asia Market Value (USD Billion) Forecast by Device Type, 2020-2035
  • Table 54: East Asia Market Volume (Units) Forecast by Device Type, 2020-2035
  • Table 55: East Asia Market Value (USD Billion) Forecast by Propulsion, 2020-2035
  • Table 56: East Asia Market Volume (Units) Forecast by Propulsion, 2020-2035
  • Table 57: East Asia Market Value (USD Billion) Forecast by Vehicle Type, 2020-2035
  • Table 58: East Asia Market Volume (Units) Forecast by Vehicle Type, 2020-2035
  • Table 59: East Asia Market Value (USD Billion) Forecast by Sales Channel, 2020-2035
  • Table 60: East Asia Market Volume (Units) Forecast by Sales Channel, 2020-2035
  • Table 61: South Asia & Pacific Market Value (USD Billion) Forecast by Country, 2020-2035
  • Table 62: South Asia & Pacific Market Volume (Units) Forecast by Country, 2020-2035
  • Table 63: South Asia & Pacific Market Value (USD Billion) Forecast by Device Type, 2020-2035
  • Table 64: South Asia & Pacific Market Volume (Units) Forecast by Device Type, 2020-2035
  • Table 65: South Asia & Pacific Market Value (USD Billion) Forecast by Propulsion, 2020-2035
  • Table 66: South Asia & Pacific Market Volume (Units) Forecast by Propulsion, 2020-2035
  • Table 67: South Asia & Pacific Market Value (USD Billion) Forecast by Vehicle Type, 2020-2035
  • Table 68: South Asia & Pacific Market Volume (Units) Forecast by Vehicle Type, 2020-2035
  • Table 69: South Asia & Pacific Market Value (USD Billion) Forecast by Sales Channel, 2020-2035
  • Table 70: South Asia & Pacific Market Volume (Units) Forecast by Sales Channel, 2020-2035
  • Table 71: Middle East and Africa Market Value (USD Billion) Forecast by Country, 2020-2035
  • Table 72: Middle East and Africa Market Volume (Units) Forecast by Country, 2020-2035
  • Table 73: Middle East and Africa Market Value (USD Billion) Forecast by Device Type, 2020-2035
  • Table 74: Middle East and Africa Market Volume (Units) Forecast by Device Type, 2020-2035
  • Table 75: Middle East and Africa Market Value (USD Billion) Forecast by Propulsion, 2020-2035
  • Table 76: Middle East and Africa Market Volume (Units) Forecast by Propulsion, 2020-2035
  • Table 77: Middle East and Africa Market Value (USD Billion) Forecast by Vehicle Type, 2020-2035
  • Table 78: Middle East and Africa Market Volume (Units) Forecast by Vehicle Type, 2020-2035
  • Table 79: Middle East and Africa Market Value (USD Billion) Forecast by Sales Channel, 2020-2035
  • Table 80: Middle East and Africa Market Volume (Units) Forecast by Sales Channel, 2020-2035

List of Figures

  • Figure 1: Global Market Volume (Units) Forecast 2020-2035
  • Figure 2: Global Market Pricing Analysis
  • Figure 3: Global Market Value (USD Billion) Forecast 2020-2035
  • Figure 4: Global Market Value Share and BPS Analysis by Device Type, 2025 and 2035
  • Figure 5: Global Market Y-o-Y Growth Comparison by Device Type, 2025-2035
  • Figure 6: Global Market Attractiveness Analysis by Device Type
  • Figure 7: Global Market Value Share and BPS Analysis by Propulsion, 2025 and 2035
  • Figure 8: Global Market Y-o-Y Growth Comparison by Propulsion, 2025-2035
  • Figure 9: Global Market Attractiveness Analysis by Propulsion
  • Figure 10: Global Market Value Share and BPS Analysis by Vehicle Type, 2025 and 2035
  • Figure 11: Global Market Y-o-Y Growth Comparison by Vehicle Type, 2025-2035
  • Figure 12: Global Market Attractiveness Analysis by Vehicle Type
  • Figure 13: Global Market Value Share and BPS Analysis by Sales Channel, 2025 and 2035
  • Figure 14: Global Market Y-o-Y Growth Comparison by Sales Channel, 2025-2035
  • Figure 15: Global Market Attractiveness Analysis by Sales Channel
  • Figure 16: Global Market Value (USD Billion) Share and BPS Analysis by Region, 2025 and 2035
  • Figure 17: Global Market Y-o-Y Growth Comparison by Region, 2025-2035
  • Figure 18: Global Market Attractiveness Analysis by Region
  • Figure 19: North America Market Incremental $ Opportunity, 2025-2035
  • Figure 20: Latin America Market Incremental $ Opportunity, 2025-2035
  • Figure 21: Western Europe Market Incremental $ Opportunity, 2025-2035
  • Figure 22: Eastern Europe Market Incremental $ Opportunity, 2025-2035
  • Figure 23: East Asia Market Incremental $ Opportunity, 2025-2035
  • Figure 24: South Asia & Pacific Market Incremental $ Opportunity, 2025-2035
  • Figure 25: Middle East and Africa Market Incremental $ Opportunity, 2025-2035
  • Figure 26: North America Market Value Share and BPS Analysis by Country, 2025 and 2035
  • Figure 27: North America Market Value Share and BPS Analysis by Device Type, 2025 and 2035
  • Figure 28: North America Market Y-o-Y Growth Comparison by Device Type, 2025-2035
  • Figure 29: North America Market Attractiveness Analysis by Device Type
  • Figure 30: North America Market Value Share and BPS Analysis by Propulsion, 2025 and 2035
  • Figure 31: North America Market Y-o-Y Growth Comparison by Propulsion, 2025-2035
  • Figure 32: North America Market Attractiveness Analysis by Propulsion
  • Figure 33: North America Market Value Share and BPS Analysis by Vehicle Type, 2025 and 2035
  • Figure 34: North America Market Y-o-Y Growth Comparison by Vehicle Type, 2025-2035
  • Figure 35: North America Market Attractiveness Analysis by Vehicle Type
  • Figure 36: North America Market Value Share and BPS Analysis by Sales Channel, 2025 and 2035
  • Figure 37: North America Market Y-o-Y Growth Comparison by Sales Channel, 2025-2035
  • Figure 38: North America Market Attractiveness Analysis by Sales Channel
  • Figure 39: Latin America Market Value Share and BPS Analysis by Country, 2025 and 2035
  • Figure 40: Latin America Market Value Share and BPS Analysis by Device Type, 2025 and 2035
  • Figure 41: Latin America Market Y-o-Y Growth Comparison by Device Type, 2025-2035
  • Figure 42: Latin America Market Attractiveness Analysis by Device Type
  • Figure 43: Latin America Market Value Share and BPS Analysis by Propulsion, 2025 and 2035
  • Figure 44: Latin America Market Y-o-Y Growth Comparison by Propulsion, 2025-2035
  • Figure 45: Latin America Market Attractiveness Analysis by Propulsion
  • Figure 46: Latin America Market Value Share and BPS Analysis by Vehicle Type, 2025 and 2035
  • Figure 47: Latin America Market Y-o-Y Growth Comparison by Vehicle Type, 2025-2035
  • Figure 48: Latin America Market Attractiveness Analysis by Vehicle Type
  • Figure 49: Latin America Market Value Share and BPS Analysis by Sales Channel, 2025 and 2035
  • Figure 50: Latin America Market Y-o-Y Growth Comparison by Sales Channel, 2025-2035
  • Figure 51: Latin America Market Attractiveness Analysis by Sales Channel
  • Figure 52: Western Europe Market Value Share and BPS Analysis by Country, 2025 and 2035
  • Figure 53: Western Europe Market Value Share and BPS Analysis by Device Type, 2025 and 2035
  • Figure 54: Western Europe Market Y-o-Y Growth Comparison by Device Type, 2025-2035
  • Figure 55: Western Europe Market Attractiveness Analysis by Device Type
  • Figure 56: Western Europe Market Value Share and BPS Analysis by Propulsion, 2025 and 2035
  • Figure 57: Western Europe Market Y-o-Y Growth Comparison by Propulsion, 2025-2035
  • Figure 58: Western Europe Market Attractiveness Analysis by Propulsion
  • Figure 59: Western Europe Market Value Share and BPS Analysis by Vehicle Type, 2025 and 2035
  • Figure 60: Western Europe Market Y-o-Y Growth Comparison by Vehicle Type, 2025-2035
  • Figure 61: Western Europe Market Attractiveness Analysis by Vehicle Type
  • Figure 62: Western Europe Market Value Share and BPS Analysis by Sales Channel, 2025 and 2035
  • Figure 63: Western Europe Market Y-o-Y Growth Comparison by Sales Channel, 2025-2035
  • Figure 64: Western Europe Market Attractiveness Analysis by Sales Channel
  • Figure 65: Eastern Europe Market Value Share and BPS Analysis by Country, 2025 and 2035
  • Figure 66: Eastern Europe Market Value Share and BPS Analysis by Device Type, 2025 and 2035
  • Figure 67: Eastern Europe Market Y-o-Y Growth Comparison by Device Type, 2025-2035
  • Figure 68: Eastern Europe Market Attractiveness Analysis by Device Type
  • Figure 69: Eastern Europe Market Value Share and BPS Analysis by Propulsion, 2025 and 2035
  • Figure 70: Eastern Europe Market Y-o-Y Growth Comparison by Propulsion, 2025-2035
  • Figure 71: Eastern Europe Market Attractiveness Analysis by Propulsion
  • Figure 72: Eastern Europe Market Value Share and BPS Analysis by Vehicle Type, 2025 and 2035
  • Figure 73: Eastern Europe Market Y-o-Y Growth Comparison by Vehicle Type, 2025-2035
  • Figure 74: Eastern Europe Market Attractiveness Analysis by Vehicle Type
  • Figure 75: Eastern Europe Market Value Share and BPS Analysis by Sales Channel, 2025 and 2035
  • Figure 76: Eastern Europe Market Y-o-Y Growth Comparison by Sales Channel, 2025-2035
  • Figure 77: Eastern Europe Market Attractiveness Analysis by Sales Channel
  • Figure 78: East Asia Market Value Share and BPS Analysis by Country, 2025 and 2035
  • Figure 79: East Asia Market Value Share and BPS Analysis by Device Type, 2025 and 2035
  • Figure 80: East Asia Market Y-o-Y Growth Comparison by Device Type, 2025-2035
  • Figure 81: East Asia Market Attractiveness Analysis by Device Type
  • Figure 82: East Asia Market Value Share and BPS Analysis by Propulsion, 2025 and 2035
  • Figure 83: East Asia Market Y-o-Y Growth Comparison by Propulsion, 2025-2035
  • Figure 84: East Asia Market Attractiveness Analysis by Propulsion
  • Figure 85: East Asia Market Value Share and BPS Analysis by Vehicle Type, 2025 and 2035
  • Figure 86: East Asia Market Y-o-Y Growth Comparison by Vehicle Type, 2025-2035
  • Figure 87: East Asia Market Attractiveness Analysis by Vehicle Type
  • Figure 88: East Asia Market Value Share and BPS Analysis by Sales Channel, 2025 and 2035
  • Figure 89: East Asia Market Y-o-Y Growth Comparison by Sales Channel, 2025-2035
  • Figure 90: East Asia Market Attractiveness Analysis by Sales Channel
  • Figure 91: South Asia & Pacific Market Value Share and BPS Analysis by Country, 2025 and 2035
  • Figure 92: South Asia & Pacific Market Value Share and BPS Analysis by Device Type, 2025 and 2035
  • Figure 93: South Asia & Pacific Market Y-o-Y Growth Comparison by Device Type, 2025-2035
  • Figure 94: South Asia & Pacific Market Attractiveness Analysis by Device Type
  • Figure 95: South Asia & Pacific Market Value Share and BPS Analysis by Propulsion, 2025 and 2035
  • Figure 96: South Asia & Pacific Market Y-o-Y Growth Comparison by Propulsion, 2025-2035
  • Figure 97: South Asia & Pacific Market Attractiveness Analysis by Propulsion
  • Figure 98: South Asia & Pacific Market Value Share and BPS Analysis by Vehicle Type, 2025 and 2035
  • Figure 99: South Asia & Pacific Market Y-o-Y Growth Comparison by Vehicle Type, 2025-2035
  • Figure 100: South Asia & Pacific Market Attractiveness Analysis by Vehicle Type
  • Figure 101: South Asia & Pacific Market Value Share and BPS Analysis by Sales Channel, 2025 and 2035
  • Figure 102: South Asia & Pacific Market Y-o-Y Growth Comparison by Sales Channel, 2025-2035
  • Figure 103: South Asia & Pacific Market Attractiveness Analysis by Sales Channel
  • Figure 104: Middle East and Africa Market Value Share and BPS Analysis by Country, 2025 and 2035
  • Figure 105: Middle East and Africa Market Value Share and BPS Analysis by Device Type, 2025 and 2035
  • Figure 106: Middle East and Africa Market Y-o-Y Growth Comparison by Device Type, 2025-2035
  • Figure 107: Middle East and Africa Market Attractiveness Analysis by Device Type
  • Figure 108: Middle East and Africa Market Value Share and BPS Analysis by Propulsion, 2025 and 2035
  • Figure 109: Middle East and Africa Market Y-o-Y Growth Comparison by Propulsion, 2025-2035
  • Figure 110: Middle East and Africa Market Attractiveness Analysis by Propulsion
  • Figure 111: Middle East and Africa Market Value Share and BPS Analysis by Vehicle Type, 2025 and 2035
  • Figure 112: Middle East and Africa Market Y-o-Y Growth Comparison by Vehicle Type, 2025-2035
  • Figure 113: Middle East and Africa Market Attractiveness Analysis by Vehicle Type
  • Figure 114: Middle East and Africa Market Value Share and BPS Analysis by Sales Channel, 2025 and 2035
  • Figure 115: Middle East and Africa Market Y-o-Y Growth Comparison by Sales Channel, 2025-2035
  • Figure 116: Middle East and Africa Market Attractiveness Analysis by Sales Channel
  • Figure 117: Global Market - Tier Structure Analysis
  • Figure 118: Global Market - Company Share Analysis

Frequently Asked Questions

What is the projected global automotive navigation system market size by 2035?

The market is expected to reach USD 60.2 billion by 2035, growing from USD 35.6 billion in 2025.

Which segment holds the largest share in automotive navigation systems?

In-dash navigation units dominate with around 65% of the market due to integration in new vehicles.

How much can AI-powered telemedicine reduce patient waiting time?

AI solutions can reduce waiting time by up to 40%, enhancing consultation efficiency.

What percentage of smart home security devices are connected to mobile apps?

Approximately 75% of devices are app-connected, allowing real-time monitoring and alerts.

Who is a leading player in the automotive navigation system market?

TomTom is a top player holding 18 % industry share, supplying in-dash and portable navigation solutions worldwide.

Explore Similar Insights

Future Market Insights

Automotive Navigation System Market