Neuronavigation Systems Market
Neuronavigation Systems Market by Disease Type, Application, End User, Region - Forecast 2022 - 2032
Market Insights on Neuronavigation Systems covering sales outlook, demand forecast and up-to-date key trends
Neuronavigation Systems Market Outlook (2022-2032)
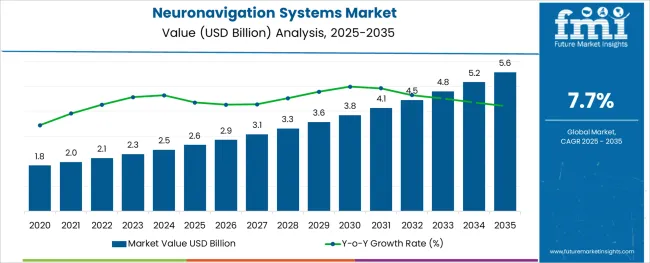
[306 Pages Report] The global neuronavigation systems market is forecasted to be appraised at US$ 4794.5 million by 2032, up from US$ 2120.0 million in 2022, advancing at a CAGR of 7.7% during the forecast period.
Report Attribute |
Details |
Neuronavigation Systems Market Value (2022) |
US$ 2120.0 Million |
Neuronavigation Systems Market Anticipated Value (2032) |
US$ 4794.5 Million |
Neuronavigation Systems Projected Growth Rate (2022-2032) |
7.7% |
Neuronavigation refers to the set of computer-assisted technologies that are used by neurosurgeons for guiding or navigation within the confines of the skull or vertebral column during transactional magnetic stimulation or surgery.
The sales of neuronavigation systems are increasing as they have become a standard procedure for neurosurgery and associated specialties due to improved accuracy, efficiency and safety.
Moreover, neuronavigation systems are extensively being used in the operative management of brain tumors and are offering numerous clinical advantages to the surgeon.
In addition to that, neuronavigation systems increase the safety and accuracy of neurosurgery, helping the surgeons to visualize and navigate the confines of the vertebral column and skull of the patient during the surgery, which is likely to fuel the demand for neuronavigation systems.
Therefore, it is expected that the neuronavigation systems market is likely to have significant growth during the forecast period.
Don't pay for what you don't need
Customize your report by selecting specific countries or regions and save 30%!
What are the Demand Drivers for the Neuronavigation Systems Market?
The demand for neuronavigation systems market is likely to witness growth due to high demand and increasing need for systems that are accurate.
One of the key neuronavigation systems market growth drivers of the global neuronavigation systems is the growing incidences of neurological disorders such as cancer, brain tumors, and stroke.
Moreover, other functionalities like planning of incision and craniotomy and determination of small subcortical lesions by neuronavigation systems are also driving the demand for neuronavigation systems in the global market.
In addition to that, there is an introduction to new and innovative neuronavigation systems by market players, which is fueling the demand and the adoption of these systems in the global market.
Furthermore, it is estimated that with the use of neuronavigation systems, there will be improved outcomes and shortened hospital stays that will motivate the neuronavigation systems market to increase.
Neuronavigation systems are also used for brain biopsy. Deep tumors inside the brains are dangerous and difficult to approach by open surgery, which can be diagnosed by passing the biopsy probe through a small hole in the skull. This method is used to place electrodes in the brain to treat disorders such as Parkinson’s disease. Neuronavigation system localization can limit the size of the opening of the skill, and it is estimated that these factors are likely to drive the neuronavigation systems market size in the upcoming years.
What are the Driving Challenges in the Neuronavigation Systems Market?
It is anticipated that clinical complications related to neuronavigation systems, combined with the high cost of acquisition and maintenance of these systems, are some of the major factors that would restrain the growth of the global neuronavigation systems market.
In addition to that, brain shift is a type of deformation of the brain during surgery due to gravity, the volume of a resected tumor, the intraoperative position of the patient, and loss of cerebrospinal fluid, which gives no accuracy in the preoperative images for the real-time anatomy which hinder the growth of the neuronavigation system market globally.
Regional Analysis
How is the Performance of the North America Neuronavigation Systems Market?
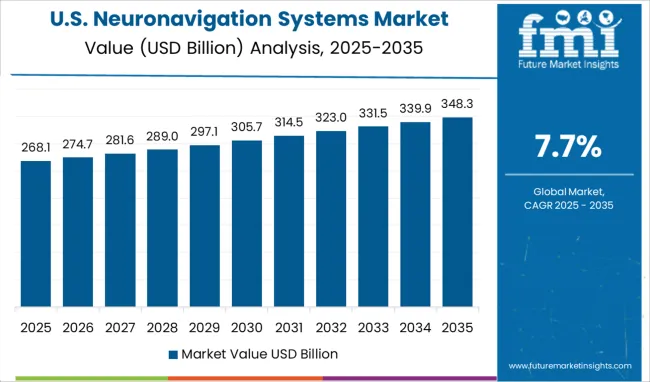
At present, North America holds the highest share of the neuronavigation systems market. This region is accountable for 44.9% of the total market share of neuronavigation systems.
Due to the high prevalence of neurological disorders and demand for technologically advanced neurological systems, this region has a bolstering growth in its neuronavigation market size.
In addition to that, government funding in this region for the development of surgical navigation systems and the rising adoption of minimally invasive surgery is fueling the growth of the neuronavigation systems market in the North American regions.
What is the Growth Outlook for the Europe Neuronavigation Systems Market?
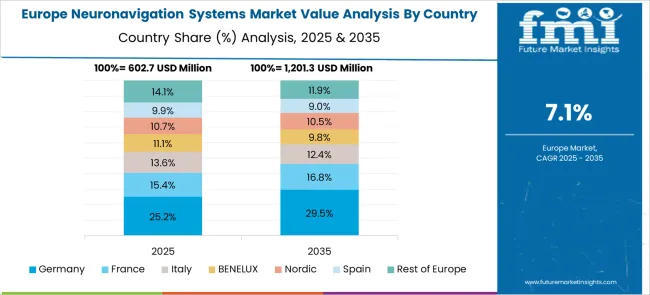
Europe is currently accountable for 26.1% of the total market share of neuronavigation systems. It is anticipated that Europe is emerging in the neuronavigation systems market due to the adoption of advanced technologies and the rising incidence rate of disorders.
Furthermore, there is a development of the healthcare infrastructure in the European regions, which is driving the market size for neuronavigation systems.
Start-up Ecosystem
How are New Entrants Revolutionizing the Neuronavigation Systems Market?
The start-up ecosystem in the neuronavigation systems market is intense with frequent innovations being made. Start-ups in the neuronavigation systems market are focusing on improvising the tools for better implementation of surgical procedures.
Some of the new entrants in the market are – Happy Reliable Surgeries (HRS), which has emerged as the premier solution provider for neuro and ENT surgeries. HRS Navigation has many innovative tools which help surgeons to plan and execute surgery as per their plans. They are known to be a healthcare startup focused on providing innovative computer-assisted surgery solutions, HRS Navigation manufactures and markets high-tech surgical navigation systems.
The NeuroCare Group is a provider of neuromodulation and neurofeedback therapies for brain conditions. The company offers DC-EEG devices such as NEURO PRAX EEG, NEURO PRAX MR, and NEURO PRAX TMS/TES which are biofeedback systems. Also, offers transcranial electrical stimulation systems, transcranial magnetic stimulation, TMS neuronavigation, near-infrared spectroscopy, and others.
Get the data you need at a Fraction of the cost
Personalize your report by choosing insights you need
and save 40%!
Competitive Landscape
Who are some of the Key Market Players in the Neuronavigation Systems Market?
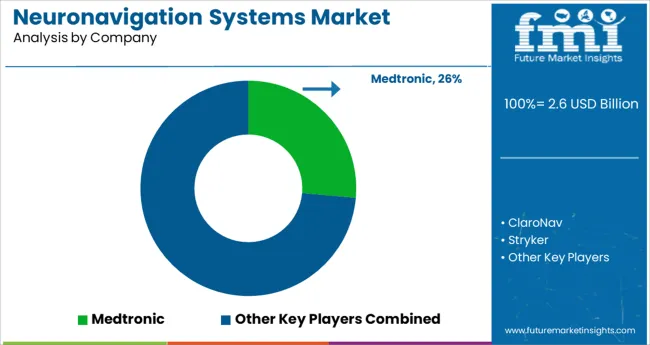
Some of the key players in the global neuronavigation system market are ClaroNav, Stryker, Brainlab AG, Parsis, Northern Digital Inc., Heal Force, Medtronic, Synaptive Medical, Bramsys Indústria e Comércio Ltd.
The key market payers are continuously making efforts to collaborate and create innovative technologies for the benefit of the patient, with standard and minimally invasive procedures for neurosurgeries and associated specialties.
Key Developments in the Neuronavigation Systems Market
Some of the key developments in the neuronavigation systems market are:
- In 2018, the Brightwater Guide system was recalled due to a potential risk where the malfunctioning software could damage the brain and cause life-threatening injuries.
- In April 2015, Synaptic Medical won FDA clearance for its ground-breaking neuronavigation called Brightwater Guide system for the US.
- In October 2013, Brainlan and DePuy Synthes Spine launched navigation-ready instrumentation, in order to improve patient outcomes and greater decision-making during the surgery itself.
Report Scope
Report Attribute |
Details |
Growth Rate |
CAGR of 7.7% from 2022 to 2032 |
Base Year for Estimation |
2021 |
Historical Data |
2016-2021 |
Forecast Period |
2022-2032 |
Quantitative Units |
Revenue in USD million and CAGR from 2022-2032 |
Report Coverage |
Revenue Forecast, Volume Forecast, Company Ranking, Competitive Landscape, Growth Factors, Trends and Pricing Analysis |
Segments Covered |
|
Regions Covered |
|
Key Countries Profiled |
|
Key Companies Profiled |
|
Customization |
Available Upon Request |
Key Segments in the Neuronavigation Systems Market
By Type:
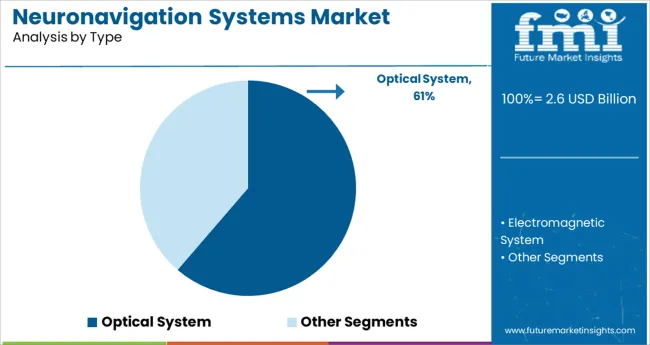
- Optical System
- Electromagnetic System
By application:
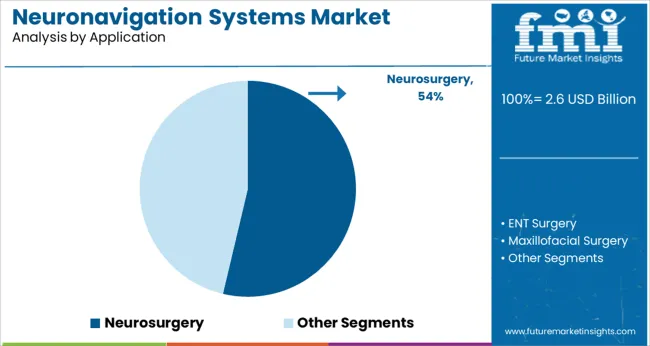
- Neurosurgery
- ENT Surgery
- Maxillofacial Surgery
- Spinal Surgery
By End-Users:
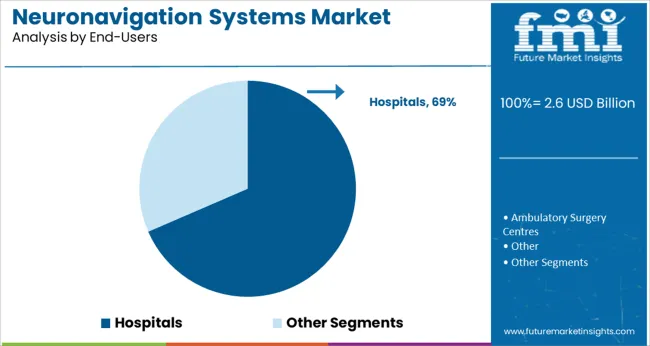
- Hospitals
- Ambulatory Surgery Centres
- Other
Frequently Asked Questions
What is the Growth Outlook for the Neuronavigation Systems Market?
The growth outlook for the neuronavigation systems market is predicted to advance at a CAGR of 7.7% from 2022 to 2032.
Which Region Leads the Neuronavigation Systems Market?
The North American region is anticipated to lead the neuronavigation systems market during the forecast period.
How much Growth Potential does the Neuronavigation Systems Market hold?
The neuronavigation systems market is likely to hold a valuation of US$ 4794.5 million by 2032.
Which sector is the key driver in the Neuronavigation Systems Market?
The healthcare industry sector is the key driver in the neuronavigation systems market.
Table of Content
1. Executive Summary 1.1. Global Market Outlook 1.2. Demand-side Trends 1.3. Supply-side Trends 1.4. Technology Roadmap Analysis 1.5. Analysis and Recommendations 2. Market Overview 2.1. Market Coverage / Taxonomy 2.2. Market Definition / Scope / Limitations 3. Market Background 3.1. Market Dynamics 3.1.1. Drivers 3.1.2. Restraints 3.1.3. Opportunity 3.1.4. Trends 3.2. Scenario Forecast 3.2.1. Demand in Optimistic Scenario 3.2.2. Demand in Likely Scenario 3.2.3. Demand in Conservative Scenario 3.3. Opportunity Map Analysis 3.4. Investment Feasibility Matrix 3.5. PESTLE and Porter’s Analysis 3.6. Regulatory Landscape 3.6.1. By Key Regions 3.6.2. By Key Countries 3.7. Regional Parent Market Outlook 4. Global Neuronavigation Systems Market Analysis 2017-2021 and Forecast, 2022-2032 4.1. Historical Market Size Value (US$ Mn) Analysis, 2017-2021 4.2. Current and Future Market Size Value (US$ Mn) Projections, 2022-2032 4.2.1. Y-o-Y Growth Trend Analysis 4.2.2. Absolute $ Opportunity Analysis 5. Global Neuronavigation Systems Market Analysis 2017-2021 and Forecast 2022-2032, By Product Type 5.1. Introduction / Key Findings 5.2. Historical Market Size Value (US$ Mn) Analysis By Product Type, 2017-2021 5.3. Current and Future Market Size Value (US$ Mn) Analysis and Forecast By Product Type, 2022-2032 5.3.1. Optical System 5.3.2. Electromagnetic System 5.4. Y-o-Y Growth Trend Analysis By Product Type, 2017-2021 5.5. Absolute $ Opportunity Analysis By Product Type, 2022-2032 6. Global Neuronavigation Systems Market Analysis 2017-2021 and Forecast 2022-2032, By Application 6.1. Introduction / Key Findings 6.2. Historical Market Size Value (US$ Mn) Analysis By Application, 2017-2021 6.3. Current and Future Market Size Value (US$ Mn) Analysis and Forecast By Application, 2022-2032 6.3.1. Neurosurgery 6.3.2. ENT Surgery 6.3.3. Maxillofacial Surgery 6.3.4. Spinal Surgery 6.4. Y-o-Y Growth Trend Analysis By Application, 2017-2021 6.5. Absolute $ Opportunity Analysis By Application, 2022-2032 7. Global Neuronavigation Systems Market Analysis 2017-2021 and Forecast 2022-2032, By Region 7.1. Introduction 7.2. Historical Market Size Value (US$ Mn) Analysis By Region, 2017-2021 7.3. Current Market Size Value (US$ Mn) Analysis and Forecast By Region, 2022-2032 7.3.1. North America 7.3.2. Latin America 7.3.3. Europe 7.3.4. Asia Pacific 7.3.5. MEA 7.4. Market Attractiveness Analysis By Region 8. North America Neuronavigation Systems Market Analysis 2017-2021 and Forecast 2022-2032, By Country 8.1. Historical Market Size Value (US$ Mn) Trend Analysis By Market Taxonomy, 2017-2021 8.2. Market Size Value (US$ Mn) Forecast By Market Taxonomy, 2022-2032 8.2.1. By Country 8.2.1.1. U.S. 8.2.1.2. Canada 8.2.2. By Product Type 8.2.3. By Application 8.3. Market Attractiveness Analysis 8.3.1. By Country 8.3.2. By Product Type 8.3.3. By Application 8.4. Key Takeaways 9. Latin America Neuronavigation Systems Market Analysis 2017-2021 and Forecast 2022-2032, By Country 9.1. Historical Market Size Value (US$ Mn) Trend Analysis By Market Taxonomy, 2017-2021 9.2. Market Size Value (US$ Mn) Forecast By Market Taxonomy, 2022-2032 9.2.1. By Country 9.2.1.1. Brazil 9.2.1.2. Mexico 9.2.1.3. Rest of Latin America 9.2.2. By Product Type 9.2.3. By Application 9.3. Market Attractiveness Analysis 9.3.1. By Country 9.3.2. By Product Type 9.3.3. By Application 9.4. Key Takeaways 10. Europe Neuronavigation Systems Market Analysis 2017-2021 and Forecast 2022-2032, By Country 10.1. Historical Market Size Value (US$ Mn) Trend Analysis By Market Taxonomy, 2017-2021 10.2. Market Size Value (US$ Mn) Forecast By Market Taxonomy, 2022-2032 10.2.1. By Country 10.2.1.1. Germany 10.2.1.2. U.K. 10.2.1.3. France 10.2.1.4. Spain 10.2.1.5. Italy 10.2.1.6. Rest of Europe 10.2.2. By Product Type 10.2.3. By Application 10.3. Market Attractiveness Analysis 10.3.1. By Country 10.3.2. By Product Type 10.3.3. By Application 10.4. Key Takeaways 11. Asia Pacific Neuronavigation Systems Market Analysis 2017-2021 and Forecast 2022-2032, By Country 11.1. Historical Market Size Value (US$ Mn) Trend Analysis By Market Taxonomy, 2017-2021 11.2. Market Size Value (US$ Mn) Forecast By Market Taxonomy, 2022-2032 11.2.1. By Country 11.2.1.1. China 11.2.1.2. Japan 11.2.1.3. South Korea 11.2.1.4. Malaysia 11.2.1.5. Singapore 11.2.1.6. Australia 11.2.1.7. New Zealand 11.2.1.8. Rest of APAC 11.2.2. By Product Type 11.2.3. By Application 11.3. Market Attractiveness Analysis 11.3.1. By Country 11.3.2. By Product Type 11.3.3. By Application 11.4. Key Takeaways 12. MEA Neuronavigation Systems Market Analysis 2017-2021 and Forecast 2022-2032, By Country 12.1. Historical Market Size Value (US$ Mn) Trend Analysis By Market Taxonomy, 2017-2021 12.2. Market Size Value (US$ Mn) Forecast By Market Taxonomy, 2022-2032 12.2.1. By Country 12.2.1.1. GCC Countries 12.2.1.2. South Africa 12.2.1.3. Israel 12.2.1.4. Rest of MEA 12.2.2. By Product Type 12.2.3. By Application 12.3. Market Attractiveness Analysis 12.3.1. By Country 12.3.2. By Product Type 12.3.3. By Application 12.4. Key Takeaways 13. Key Countries Neuronavigation Systems Market Analysis 13.1. U.S. 13.1.1. Pricing Analysis 13.1.2. Market Share Analysis, 2021 13.1.2.1. By Product Type 13.1.2.2. By Application 13.2. Canada 13.2.1. Pricing Analysis 13.2.2. Market Share Analysis, 2021 13.2.2.1. By Product Type 13.2.2.2. By Application 13.3. Brazil 13.3.1. Pricing Analysis 13.3.2. Market Share Analysis, 2021 13.3.2.1. By Product Type 13.3.2.2. By Application 13.4. Mexico 13.4.1. Pricing Analysis 13.4.2. Market Share Analysis, 2021 13.4.2.1. By Product Type 13.4.2.2. By Application 13.5. Germany 13.5.1. Pricing Analysis 13.5.2. Market Share Analysis, 2021 13.5.2.1. By Product Type 13.5.2.2. By Application 13.6. U.K. 13.6.1. Pricing Analysis 13.6.2. Market Share Analysis, 2021 13.6.2.1. By Product Type 13.6.2.2. By Application 13.7. France 13.7.1. Pricing Analysis 13.7.2. Market Share Analysis, 2021 13.7.2.1. By Product Type 13.7.2.2. By Application 13.8. Spain 13.8.1. Pricing Analysis 13.8.2. Market Share Analysis, 2021 13.8.2.1. By Product Type 13.8.2.2. By Application 13.9. Italy 13.9.1. Pricing Analysis 13.9.2. Market Share Analysis, 2021 13.9.2.1. By Product Type 13.9.2.2. By Application 13.10. China 13.10.1. Pricing Analysis 13.10.2. Market Share Analysis, 2021 13.10.2.1. By Product Type 13.10.2.2. By Application 13.11. Japan 13.11.1. Pricing Analysis 13.11.2. Market Share Analysis, 2021 13.11.2.1. By Product Type 13.11.2.2. By Application 13.12. South Korea 13.12.1. Pricing Analysis 13.12.2. Market Share Analysis, 2021 13.12.2.1. By Product Type 13.12.2.2. By Application 13.13. Malaysia 13.13.1. Pricing Analysis 13.13.2. Market Share Analysis, 2021 13.13.2.1. By Product Type 13.13.2.2. By Application 13.14. Singapore 13.14.1. Pricing Analysis 13.14.2. Market Share Analysis, 2021 13.14.2.1. By Product Type 13.14.2.2. By Application 13.15. Australia 13.15.1. Pricing Analysis 13.15.2. Market Share Analysis, 2021 13.15.2.1. By Product Type 13.15.2.2. By Application 13.16. New Zealand 13.16.1. Pricing Analysis 13.16.2. Market Share Analysis, 2021 13.16.2.1. By Product Type 13.16.2.2. By Application 13.17. GCC Countries 13.17.1. Pricing Analysis 13.17.2. Market Share Analysis, 2021 13.17.2.1. By Product Type 13.17.2.2. By Application 13.18. South Africa 13.18.1. Pricing Analysis 13.18.2. Market Share Analysis, 2021 13.18.2.1. By Product Type 13.18.2.2. By Application 13.19. Israel 13.19.1. Pricing Analysis 13.19.2. Market Share Analysis, 2021 13.19.2.1. By Product Type 13.19.2.2. By Application 14. Market Structure Analysis 14.1. Competition Dashboard 14.2. Competition Benchmarking 14.3. Market Share Analysis of Top Players 14.3.1. By Regional 14.3.2. By Product Type 14.3.3. By Application 15. Competition Analysis 15.1. Competition Deep Dive 15.1.1. ClaroNav 15.1.1.1. Overview 15.1.1.2. Product Portfolio 15.1.1.3. Profitability by Market Segments 15.1.1.4. Sales Footprint 15.1.1.5. Strategy Overview 15.1.1.5.1. Marketing Strategy 15.1.2. Stryker 15.1.2.1. Overview 15.1.2.2. Product Portfolio 15.1.2.3. Profitability by Market Segments 15.1.2.4. Sales Footprint 15.1.2.5. Strategy Overview 15.1.2.5.1. Marketing Strategy 15.1.3. Brainlab AG 15.1.3.1. Overview 15.1.3.2. Product Portfolio 15.1.3.3. Profitability by Market Segments 15.1.3.4. Sales Footprint 15.1.3.5. Strategy Overview 15.1.3.5.1. Marketing Strategy 15.1.4. Parsiss 15.1.4.1. Overview 15.1.4.2. Product Portfolio 15.1.4.3. Profitability by Market Segments 15.1.4.4. Sales Footprint 15.1.4.5. Strategy Overview 15.1.4.5.1. Marketing Strategy 15.1.5. Northern Digital Inc. 15.1.5.1. Overview 15.1.5.2. Product Portfolio 15.1.5.3. Profitability by Market Segments 15.1.5.4. Sales Footprint 15.1.5.5. Strategy Overview 15.1.5.5.1. Marketing Strategy 15.1.6. Heal Force 15.1.6.1. Overview 15.1.6.2. Product Portfolio 15.1.6.3. Profitability by Market Segments 15.1.6.4. Sales Footprint 15.1.6.5. Strategy Overview 15.1.6.5.1. Marketing Strategy 15.1.7. Medtronic 15.1.7.1. Overview 15.1.7.2. Product Portfolio 15.1.7.3. Profitability by Market Segments 15.1.7.4. Sales Footprint 15.1.7.5. Strategy Overview 15.1.7.5.1. Marketing Strategy 15.1.8. Synaptive Medical 15.1.8.1. Overview 15.1.8.2. Product Portfolio 15.1.8.3. Profitability by Market Segments 15.1.8.4. Sales Footprint 15.1.8.5. Strategy Overview 15.1.8.5.1. Marketing Strategy 15.1.9. Bramsys Indústria e Comércio Ltd 15.1.9.1. Overview 15.1.9.2. Product Portfolio 15.1.9.3. Profitability by Market Segments 15.1.9.4. Sales Footprint 15.1.9.5. Strategy Overview 15.1.9.5.1. Marketing Strategy 16. Assumptions & Acronyms Used 17. Research Methodology
Don't pay for what you don't need
Customize your report by selecting specific countries or regions and save 30%!
List of Tables
Table 1: Global Neuronavigation Systems Market Value (US$ Mn) Forecast by Region, 2017-2032 Table 2: Global Neuronavigation Systems Market Value (US$ Mn) Forecast by Product Type, 2017-2032 Table 3: Global Neuronavigation Systems Market Value (US$ Mn) Forecast by Application, 2017-2032 Table 4: North America Neuronavigation Systems Market Value (US$ Mn) Forecast by Country, 2017-2032 Table 5: North America Neuronavigation Systems Market Value (US$ Mn) Forecast by Product Type, 2017-2032 Table 6: North America Neuronavigation Systems Market Value (US$ Mn) Forecast by Application, 2017-2032 Table 7: Latin America Neuronavigation Systems Market Value (US$ Mn) Forecast by Country, 2017-2032 Table 8: Latin America Neuronavigation Systems Market Value (US$ Mn) Forecast by Product Type, 2017-2032 Table 9: Latin America Neuronavigation Systems Market Value (US$ Mn) Forecast by Application, 2017-2032 Table 10: Europe Neuronavigation Systems Market Value (US$ Mn) Forecast by Country, 2017-2032 Table 11: Europe Neuronavigation Systems Market Value (US$ Mn) Forecast by Product Type, 2017-2032 Table 12: Europe Neuronavigation Systems Market Value (US$ Mn) Forecast by Application, 2017-2032 Table 13: Asia Pacific Neuronavigation Systems Market Value (US$ Mn) Forecast by Country, 2017-2032 Table 14: Asia Pacific Neuronavigation Systems Market Value (US$ Mn) Forecast by Product Type, 2017-2032 Table 15: Asia Pacific Neuronavigation Systems Market Value (US$ Mn) Forecast by Application, 2017-2032 Table 16: MEA Neuronavigation Systems Market Value (US$ Mn) Forecast by Country, 2017-2032 Table 17: MEA Neuronavigation Systems Market Value (US$ Mn) Forecast by Product Type, 2017-2032 Table 18: MEA Neuronavigation Systems Market Value (US$ Mn) Forecast by Application, 2017-2032
List of Charts
Figure 1: Global Neuronavigation Systems Market Value (US$ Mn) by Product Type, 2022-2032 Figure 2: Global Neuronavigation Systems Market Value (US$ Mn) by Application, 2022-2032 Figure 3: Global Neuronavigation Systems Market Value (US$ Mn) by Region, 2022-2032 Figure 4: Global Neuronavigation Systems Market Value (US$ Mn) Analysis by Region, 2017-2032 Figure 5: Global Neuronavigation Systems Market Value Share (%) and BPS Analysis by Region, 2022-2032 Figure 6: Global Neuronavigation Systems Market Y-o-Y Growth (%) Projections by Region, 2022-2032 Figure 7: Global Neuronavigation Systems Market Value (US$ Mn) Analysis by Product Type, 2017-2032 Figure 8: Global Neuronavigation Systems Market Value Share (%) and BPS Analysis by Product Type, 2022-2032 Figure 9: Global Neuronavigation Systems Market Y-o-Y Growth (%) Projections by Product Type, 2022-2032 Figure 10: Global Neuronavigation Systems Market Value (US$ Mn) Analysis by Application, 2017-2032 Figure 11: Global Neuronavigation Systems Market Value Share (%) and BPS Analysis by Application, 2022-2032 Figure 12: Global Neuronavigation Systems Market Y-o-Y Growth (%) Projections by Application, 2022-2032 Figure 13: Global Neuronavigation Systems Market Attractiveness by Product Type, 2022-2032 Figure 14: Global Neuronavigation Systems Market Attractiveness by Application, 2022-2032 Figure 15: Global Neuronavigation Systems Market Attractiveness by Region, 2022-2032 Figure 16: North America Neuronavigation Systems Market Value (US$ Mn) by Product Type, 2022-2032 Figure 17: North America Neuronavigation Systems Market Value (US$ Mn) by Application, 2022-2032 Figure 18: North America Neuronavigation Systems Market Value (US$ Mn) by Country, 2022-2032 Figure 19: North America Neuronavigation Systems Market Value (US$ Mn) Analysis by Country, 2017-2032 Figure 20: North America Neuronavigation Systems Market Value Share (%) and BPS Analysis by Country, 2022-2032 Figure 21: North America Neuronavigation Systems Market Y-o-Y Growth (%) Projections by Country, 2022-2032 Figure 22: North America Neuronavigation Systems Market Value (US$ Mn) Analysis by Product Type, 2017-2032 Figure 23: North America Neuronavigation Systems Market Value Share (%) and BPS Analysis by Product Type, 2022-2032 Figure 24: North America Neuronavigation Systems Market Y-o-Y Growth (%) Projections by Product Type, 2022-2032 Figure 25: North America Neuronavigation Systems Market Value (US$ Mn) Analysis by Application, 2017-2032 Figure 26: North America Neuronavigation Systems Market Value Share (%) and BPS Analysis by Application, 2022-2032 Figure 27: North America Neuronavigation Systems Market Y-o-Y Growth (%) Projections by Application, 2022-2032 Figure 28: North America Neuronavigation Systems Market Attractiveness by Product Type, 2022-2032 Figure 29: North America Neuronavigation Systems Market Attractiveness by Application, 2022-2032 Figure 30: North America Neuronavigation Systems Market Attractiveness by Country, 2022-2032 Figure 31: Latin America Neuronavigation Systems Market Value (US$ Mn) by Product Type, 2022-2032 Figure 32: Latin America Neuronavigation Systems Market Value (US$ Mn) by Application, 2022-2032 Figure 33: Latin America Neuronavigation Systems Market Value (US$ Mn) by Country, 2022-2032 Figure 34: Latin America Neuronavigation Systems Market Value (US$ Mn) Analysis by Country, 2017-2032 Figure 35: Latin America Neuronavigation Systems Market Value Share (%) and BPS Analysis by Country, 2022-2032 Figure 36: Latin America Neuronavigation Systems Market Y-o-Y Growth (%) Projections by Country, 2022-2032 Figure 37: Latin America Neuronavigation Systems Market Value (US$ Mn) Analysis by Product Type, 2017-2032 Figure 38: Latin America Neuronavigation Systems Market Value Share (%) and BPS Analysis by Product Type, 2022-2032 Figure 39: Latin America Neuronavigation Systems Market Y-o-Y Growth (%) Projections by Product Type, 2022-2032 Figure 40: Latin America Neuronavigation Systems Market Value (US$ Mn) Analysis by Application, 2017-2032 Figure 41: Latin America Neuronavigation Systems Market Value Share (%) and BPS Analysis by Application, 2022-2032 Figure 42: Latin America Neuronavigation Systems Market Y-o-Y Growth (%) Projections by Application, 2022-2032 Figure 43: Latin America Neuronavigation Systems Market Attractiveness by Product Type, 2022-2032 Figure 44: Latin America Neuronavigation Systems Market Attractiveness by Application, 2022-2032 Figure 45: Latin America Neuronavigation Systems Market Attractiveness by Country, 2022-2032 Figure 46: Europe Neuronavigation Systems Market Value (US$ Mn) by Product Type, 2022-2032 Figure 47: Europe Neuronavigation Systems Market Value (US$ Mn) by Application, 2022-2032 Figure 48: Europe Neuronavigation Systems Market Value (US$ Mn) by Country, 2022-2032 Figure 49: Europe Neuronavigation Systems Market Value (US$ Mn) Analysis by Country, 2017-2032 Figure 50: Europe Neuronavigation Systems Market Value Share (%) and BPS Analysis by Country, 2022-2032 Figure 51: Europe Neuronavigation Systems Market Y-o-Y Growth (%) Projections by Country, 2022-2032 Figure 52: Europe Neuronavigation Systems Market Value (US$ Mn) Analysis by Product Type, 2017-2032 Figure 53: Europe Neuronavigation Systems Market Value Share (%) and BPS Analysis by Product Type, 2022-2032 Figure 54: Europe Neuronavigation Systems Market Y-o-Y Growth (%) Projections by Product Type, 2022-2032 Figure 55: Europe Neuronavigation Systems Market Value (US$ Mn) Analysis by Application, 2017-2032 Figure 56: Europe Neuronavigation Systems Market Value Share (%) and BPS Analysis by Application, 2022-2032 Figure 57: Europe Neuronavigation Systems Market Y-o-Y Growth (%) Projections by Application, 2022-2032 Figure 58: Europe Neuronavigation Systems Market Attractiveness by Product Type, 2022-2032 Figure 59: Europe Neuronavigation Systems Market Attractiveness by Application, 2022-2032 Figure 60: Europe Neuronavigation Systems Market Attractiveness by Country, 2022-2032 Figure 61: Asia Pacific Neuronavigation Systems Market Value (US$ Mn) by Product Type, 2022-2032 Figure 62: Asia Pacific Neuronavigation Systems Market Value (US$ Mn) by Application, 2022-2032 Figure 63: Asia Pacific Neuronavigation Systems Market Value (US$ Mn) by Country, 2022-2032 Figure 64: Asia Pacific Neuronavigation Systems Market Value (US$ Mn) Analysis by Country, 2017-2032 Figure 65: Asia Pacific Neuronavigation Systems Market Value Share (%) and BPS Analysis by Country, 2022-2032 Figure 66: Asia Pacific Neuronavigation Systems Market Y-o-Y Growth (%) Projections by Country, 2022-2032 Figure 67: Asia Pacific Neuronavigation Systems Market Value (US$ Mn) Analysis by Product Type, 2017-2032 Figure 68: Asia Pacific Neuronavigation Systems Market Value Share (%) and BPS Analysis by Product Type, 2022-2032 Figure 69: Asia Pacific Neuronavigation Systems Market Y-o-Y Growth (%) Projections by Product Type, 2022-2032 Figure 70: Asia Pacific Neuronavigation Systems Market Value (US$ Mn) Analysis by Application, 2017-2032 Figure 71: Asia Pacific Neuronavigation Systems Market Value Share (%) and BPS Analysis by Application, 2022-2032 Figure 72: Asia Pacific Neuronavigation Systems Market Y-o-Y Growth (%) Projections by Application, 2022-2032 Figure 73: Asia Pacific Neuronavigation Systems Market Attractiveness by Product Type, 2022-2032 Figure 74: Asia Pacific Neuronavigation Systems Market Attractiveness by Application, 2022-2032 Figure 75: Asia Pacific Neuronavigation Systems Market Attractiveness by Country, 2022-2032 Figure 76: MEA Neuronavigation Systems Market Value (US$ Mn) by Product Type, 2022-2032 Figure 77: MEA Neuronavigation Systems Market Value (US$ Mn) by Application, 2022-2032 Figure 78: MEA Neuronavigation Systems Market Value (US$ Mn) by Country, 2022-2032 Figure 79: MEA Neuronavigation Systems Market Value (US$ Mn) Analysis by Country, 2017-2032 Figure 80: MEA Neuronavigation Systems Market Value Share (%) and BPS Analysis by Country, 2022-2032 Figure 81: MEA Neuronavigation Systems Market Y-o-Y Growth (%) Projections by Country, 2022-2032 Figure 82: MEA Neuronavigation Systems Market Value (US$ Mn) Analysis by Product Type, 2017-2032 Figure 83: MEA Neuronavigation Systems Market Value Share (%) and BPS Analysis by Product Type, 2022-2032 Figure 84: MEA Neuronavigation Systems Market Y-o-Y Growth (%) Projections by Product Type, 2022-2032 Figure 85: MEA Neuronavigation Systems Market Value (US$ Mn) Analysis by Application, 2017-2032 Figure 86: MEA Neuronavigation Systems Market Value Share (%) and BPS Analysis by Application, 2022-2032 Figure 87: MEA Neuronavigation Systems Market Y-o-Y Growth (%) Projections by Application, 2022-2032 Figure 88: MEA Neuronavigation Systems Market Attractiveness by Product Type, 2022-2032 Figure 89: MEA Neuronavigation Systems Market Attractiveness by Application, 2022-2032 Figure 90: MEA Neuronavigation Systems Market Attractiveness by Country, 2022-2032
Recommendations
Explore Healthcare Insights
View Reports