Unmanned Systems Market Size and Share Forecast Outlook 2025 to 2035

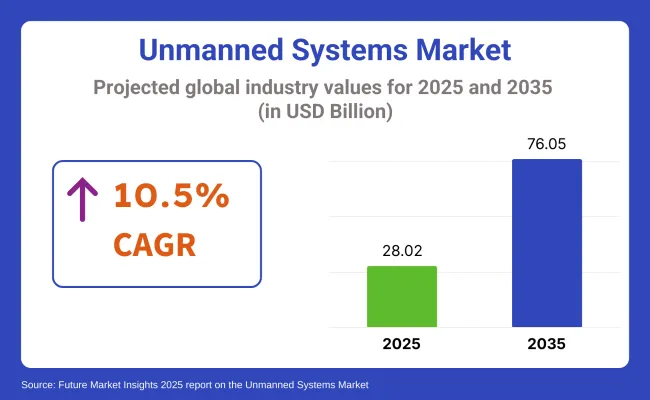
The global unmanned systems market is projected to grow from USD 28.02 billion in 2025 to USD 76.05 billion by 2035, reflecting a CAGR of 10.5% during the forecast period. The increasing demand for autonomous and semi-autonomous platforms in defense, surveillance, logistics, and industrial sectors drives this growth.
Quick Stats of the Unmanned Systems Market

  • Market Value (2025): USD 28.02 billion
  • Forecast Value (2035): USD 76.05 billion
  • Forecast CAGR: 10.5%
  • Key Growth Region: Asia Pacific (India)
  • Leading Segment in 2025: Unmanned Aerial Vehicles (UAVs) (~25% share)
  • Top Key Players: Northrop Grumman, Lockheed Martin Corporation, Teledyne Technologies Inc., BAE Systems, DJI.

Unmanned Systems Market

Geopolitical uncertainties and the intensification of defense modernization programs are pushing military and law enforcement agencies to deploy unmanned aerial, ground, and maritime vehicles for critical operations, including reconnaissance, surveillance, and tactical missions.

In an official PR published on the company website, ZenaTech announced that ZenaDrone 1000 will accelerate the deployment of its Counter-UAS technology following a USA Executive Order aimed at enhancing airspace control. The drone, originally developed in 2024, will now feature real-time threat detection and neutralization for defense, surveillance, and infrastructure protection. ZenaTech plans to file a patent and expand its engineering teams to support this initiative, capitalizing on the growing demand for USA-made counter-UAS technologies.

The market holds varying shares within its parent markets. In the aerospace & defense market, unmanned technologies, particularly UAVs and UGVs, represent around 15-20%, driven by their increasing use in military and surveillance operations. Within the robotics industry, unmanned technologies account for about 10-12%, as they are a significant subset of autonomous robotic applications. In the artificial intelligence (AI) industry, unmanned technologies contribute approximately 8-10%, as AI plays a crucial role in enhancing the autonomy and decision-making of these systems.

Within the IoTindustry, unmanned technologies represent about 5-7%, given their reliance on IoT for connectivity and data transfer. In the automation & control systems industry, unmanned technologies contribute roughly 12-15%, reflecting their growing importance in industrial automation

Analysis Unmanned Systems Market by Top Investment Segments

These sectors are being propelled by defense modernization programs, the integration of artificial intelligence (AI), and enhanced operational flexibility across various global industries.

Unmanned Aerial Vehicles (UAVs) to Lead by Type Segment.

Unmanned aerial vehicles (UAVs) are expected to dominate the industry, holding a 25% share in 2025.

  • Small UAVs are gaining traction due to their versatility, cost-effectiveness, and ease of deployment across various industries. These UAVs are increasingly utilized in defense, border surveillance, disaster management, and agriculture for monitoring and mapping purposes.
  • Companies such as DJI, Parrot, and AeroVironment are leading the development of small UAVs, creating systems capable of flying at various altitudes while maintaining high levels of stability and camera capabilities. The growing demand for commercial applications, including aerial inspections and surveillance, will drive UAV adoption, particularly in urban areas.

Semi-Autonomous Technology Segment Dominates with Adaptive Control and Operational Flexibility

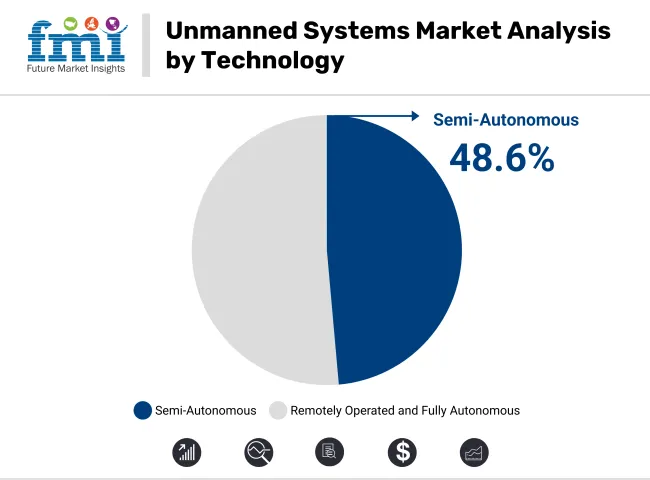
The semi-autonomous segment is forecasted to hold a commanding 48.6% share by 2025, owing to its ability to blend human oversight with automated decision-making. This equilibrium enhances mission reliability while maintaining adaptability in uncertain operational settings.
  • Deployments such as the USA Navy’s Sea Hunter exemplify long-endurance performance with minimal human intervention.
  • Commercial initiatives like Amazon’s Prime Air trials further reflect growing adoption in logistics. Technological features including obstacle detection, sensor fusion, and autonomous navigation optimize performance across military, industrial, and commercial domains.
  • These systems mitigate human risk and execute complex tasks such as surveillance, reconnaissance, and delivery, ensuring leadership in diverse global industry.

Unmanned Systems Market Analysis By Technology

Military and Law Enforcement Applications Lead with Expansive Deployment

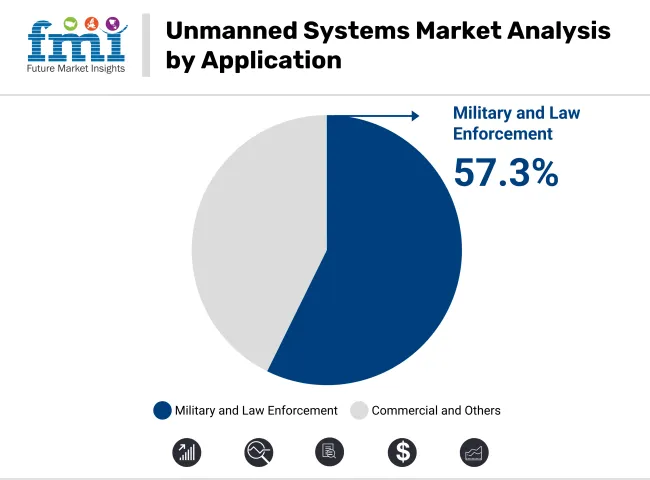
Military and law enforcement applications are projected to dominate the industry, capturing a 57.3% share in 2025. This dominance stems from sustained defense spending increases and the pressing need for advanced security solutions.
  • Countries like Israel, Russia, and the USA actively employ platforms such as the Harop Loitering Munition and Uran-9 UGV, showcasing battlefield effectiveness. These systems enable remote surveillance, target neutralization, and troop safety enhancement-key elements of modern defense strategy.
  • NATO’s inclusion of UAVs and UGVs for reconnaissance and combat roles highlights ongoing demand. Additionally, homeland security bodies leverage unmanned solutions for border patrol, bomb disposal, and crowd control, solidifying this segment’s top investment status worldwide.

Unmanned Systems Market Analysis By Application

Top Unmanned Systems Market Dynamics

Key trends observed in the market include increase in focus on automation, AI integration, and regional manufacturing to meet stringent performance and regulatory needs.

Demand Driven by Defense Amid Industry Overcrowding

Defense interest in small UAVs has surged, with low-cost FPV drones being prioritized by the USA Department of Defense, inspired by lessons from Ukraine. Contracts are being pursued by startups, but large procurement deals are expected to be won by only a few firms due to scalability and capability demands. Acquisitions are now centered around platforms resilient to electronic warfare and affordability.

  • Low-cost, attritable FPV drones are prioritized by the USA Department of Defense.
  • Intense competition for Pentagon contracts is faced by startups, with few deals expected to be won.
  • Acquisitions are focused on drones that are resilient to electronic warfare and affordable.

Commercial and Industrial Adoption Promoting Technological Integration

The enterprise usage of unmanned technologies in sectors like logistics and agriculture is growing, driven by technologies such as AI-powered navigation and sensor fusion. North America leads in adopting semi-autonomous UAVs, UGVs, and UMVs. Investments are being made to supply high-reliability systems to OEMs for various industrial applications.
  • North America leads in adopting semi-autonomous systems.
  • Unmanned technologies are used for infrastructure inspection, search and rescue, and crop monitoring.
  • Technologies like AI navigation and autonomous workflows are being integrated into product systems.

Top Countries Leading, Adopting, and Transforming the Unmanned Systems Landscape

Country Wise Analysis Unmanned Systems Market

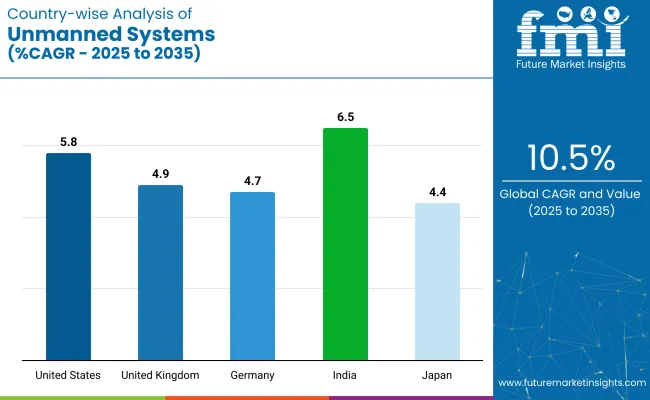
Country CAGR (2025 to 2035)
United States 5.8%
United Kingdom 4.9%
Germany 4.7%
India 6.5%
Japan 4.4%

The Unmanned Systems market, with a global CAGR of 10.5%, exhibits significant growth disparities across regions. India (BRICS) leads the growth with 6.5% CAGR, driven by rapid advancements in defense and commercial drone technologies, as well as increased investment in this systems for logistics and surveillance. The United States (OECD) follows with a 5.8% CAGR, supported by strong government and military demand for these systems in both defense and commercial sectors.

The United Kingdom (OECD), Germany (OECD), and Japan (OECD) show slower growth, with 4.9%, 4.7%, and 4.4% CAGR, respectively, reflecting a more mature market with slower integration. While OECD countries display steady but moderate growth, India offers the highest potential due to its expanding defense capabilities and growing industry for commercial unmanned technologies.

The report covers detailed analysis of 40+ countries and the top five countries have been shared as a reference.

In-depth Analysis of the United States Unmanned Systems Market

The demand for unmanned systems in the United States is forecast to grow at a CAGR of 5.8% from 2025 to 2035. Growth is being supported by large defense budgets, continuous R&D investments, and the strong industry presence of companies such as Lockheed Martin, Northrop Grumman, and General Atomics.

Military adoption for ISR (Intelligence, Surveillance, Reconnaissance), combat, and border patrol remains a core driver. Civil applications in agriculture, energy, and last-mile delivery are accelerating due to favorable FAA guidelines and innovation grants. Technological advances in AI, data processing, and propulsion systems are reinforcing the USA’s leadership.

  • Military adoption of these systems is driving growth in defense and security applications.
  • Civil applications are accelerating, particularly in agriculture, energy, and logistics.
  • Technological advancements in AI and propulsion systems are enhancing product capabilities.

Demand Forecast for United Kingdom Unmanned Systems Market

The UK unmanned systems market is anticipated to grow at a CAGR of 4.9% from 2025 to 2035. Growth is stemming from defense modernization efforts and the deployment of unmanned solutions for civil security. Leading companies like BAE Systems and QinetiQ are developing dual-purpose platforms for both military and commercial operations.

The government’s clear UAV regulations and early adoption of unmanned maritime technologies are contributing to industry strength. Collaboration with European defense entities and a focus on surveillance and search-and-rescue operations are enhancing competitiveness.

  • Dual-purpose platforms for both military and commercial use are expanding.
  • Clear UAV regulations are supporting the industry growth.
  • Collaborative efforts with European defense entities are boosting competitiveness.

Opportunity Analysis in Germany Unmanned Systems Market

The demand for unmanned systems in Germany is projected to grow at a CAGR of 4.7% between 2025 and 2035. The country’s push for Industry 4.0 and automation is stimulating demand for UAVs and UGVs in industrial inspection, logistics, and urban planning. Defense modernization includes upgrading surveillance UAV fleets for reconnaissance missions.

Local companies like Rheinmetall and Airbus Defence and Space are at the forefront of technological innovation. The German government is supporting autonomous mobility research with EU-aligned regulatory policies and public funding, providing a stable environment for unmanned system advancement.

  • Industry 4.0 and automation are increasing demand for UAVs and UGVs.
  • The government’s support for autonomous mobility research is fostering growth.
  • Local innovation is being driven by companies like Rheinmetall and Airbus.

Unmanned Systems Market in India and Growth Outlook

The Indian unmanned systems market is forecast to grow at the highest global CAGR of 6.5% from 2025 to 2035. Growth is being driven by the Make in India initiative and efforts to enhance domestic production of UAVs and UGVs for defense and surveillance.

Organizations like DRDO and private startups are developing cost-effective, versatile unmanned platforms for border security, disaster response, and agriculture. Government reforms, relaxed FDI norms, and rising demand for smart surveillance solutions are encouraging innovation. India is emerging as a center for manufacturing, development, and export in Asia.

  • Domestic manufacturing of UAVs and UGVs is being promoted under the Make in India initiative.
  • Government reforms and relaxed FDI norms are supporting industry growth.
  • Demand for smart surveillance solutions is driving innovation in systems.

Japan Unmanned Systems Market Opportunities Analysis

Sales of unmanned systems in Japan is expected to grow at a 4.4% CAGR from 2025 to 2035. The country is leveraging its expertise in robotics to integrate UAVs and UGVs into industrial automation, urban air mobility, and disaster response operations. Companies like Yamaha and Mitsubishi Electric are driving innovation in precision agriculture, infrastructure monitoring, and emergency relief solutions.

Government initiatives to promote autonomous technology adoption, combined with labor shortages due to an aging population, are boosting demand across multiple sectors. Japan’s focus on merging robotics with unmanned technologies positions it as a technological leader in next-generation autonomous solutions.

  • Robotics integration in UAVs and UGVs is enhancing industrial and civil applications.
  • Labor shortages due to aging populations are increasing demand for autonomous systems.
  • Innovation in precision agriculture and infrastructure monitoring is accelerating.

Leading Unmanned Systems Manufacturers

Leading players such as Northrop Grumman, Lockheed Martin, Boeing, General Dynamics, and L3Harris Technologies dominate through large defense contracts, integrated capabilities, and extensive R&D. Emerging companies, including Teledyne Technologies, Textron Inc., Thales, and Israel Aerospace Industries, address specialized defense and commercial segments with flexible, mission-specific platforms.

Key players like DJI and Elbit Systems focus on cost-effective, commercially scalable solutions. While industry fragmentation persists, increasing mergers, collaborations, and cross-sector innovation are steadily fostering consolidation among top industry participants.

Recent Unmanned Systems Industry News

  • In May 2025, key collaborations redefined advancements in the unmanned system industry. Cyberlux Corporation announced its partnership with Optical Knowledge Systems, Inc. (OKSI) to enhance unmanned aerial systems (UAS) for operations in GPS- and RF-denied environments.
  • In May 2025, Cyberlux Corporation’s press release announced an alliance that integrates OKSI’s OMNISCIENCE autonomy suite into Cyberlux platforms, enabling independent navigation and target detection without relying on traditional signals.
  • In April 2025, HD Hyundai Heavy Industries disclosed a strategic agreement with Anduril Industries to co-develop AI-enabled unmanned surface vessels, combining autonomous navigation with mission autonomy technologies for complex naval operations.

Key Unmanned Systems Market Players

  • Northrop Grumman
  • Lockheed Martin Corporation
  • Teledyne Technologies Inc.
  • BAE Systems
  • DJI
  • Thales
  • Israel Aerospace Industries
  • Boeing
  • General Dynamics Corporation
  • Textron Inc.
  • L3Harris Technologies Inc.
  • Elbit Systems Ltd.

Research Coverage and Scope Summary

Report Attributes Details
Industry Size (2025E) USD 28.02 billion
Projected Industry Size (2035F) USD 76.05 billion
CAGR (2025 to 20 35) 10.5%
Base Year for Estimation 2024
Historical Period 2020 to 2024
Projection Period 2025 to 2035
Quantitative Units USD billion for value & Thousand U nits for Volume
By Type (Segment 1) Unmanned Aerial Vehicles (Small UAVs, Medium UAVs, Large UAVs), Unmanned Ground Vehicles (Wheeled, Tracked, Legged, Hybrid), Unmanned Sea Vehicles (UUVs, USVs)
By Technology (Segment 2) Semi-Autonomous, Remotely Operated, Fully Autonomous
By Application (Segment 3) Military and Law Enforcement, Commercial, Others
Regions Covered North America, Europe, Asia Pacific, Latin America, Middle East & Africa (MEA)
Countries Covered USA , Canada, Mexico, UK, Germany, France, China, Japan, India, South Korea, Australia, Brazil, Saudi Arabia, UAE, South Africa
Key Players Northrop Grumman, Lockheed Martin Corporation, Teledyne Technologies Inc., BAE Systems, DJI, Thales, Israel Aerospace Industries, Boeing, General Dynamics Corporation, Textron Inc., L3Harris Technologies Inc., Elbit Systems Ltd.
Additional Attributes Dollar sales, share, military modernization programs, commercial drone applications, UGV development trends, AI-powered autonomy, cross-domain unmanned integrations

Key Segment Studied in the Unmanned Systems Market

By Type:

The industry segmented into unmanned aerial vehicles (UAVs) (small UAVs, medium UAVs, and large UAVs), unmanned ground vehicles (UGVs) (wheeled, tracked, legged, and hybrid systems), and unmanned sea vehicles (unmanned underwater vehicles (UUVs) and unmanned surface vehicles (USVs)).

By Technology:

The industry covers semi-autonomous, remotely operated, and fully autonomous systems.

By Application:

The industry encompasses military and law enforcement, commercial, and others.

By Region:

The industry is categorized into North America, Europe, Asia Pacific, Latin America, and Middle East & Africa.

Table of Content

  1. Executive Summary
    • Global Market Outlook
    • Demand-side Trends
    • Supply-side Trends
    • Technology Roadmap Analysis
    • Analysis and Recommendations
  2. Market Overview
    • Market Coverage / Taxonomy
    • Market Definition / Scope / Limitations
  3. Market Background
    • Market Dynamics
      • Drivers
      • Restraints
      • Opportunity
      • Trends
    • Scenario Forecast
      • Demand in Optimistic Scenario
      • Demand in Likely Scenario
      • Demand in Conservative Scenario
    • Opportunity Map Analysis
    • Product Life Cycle Analysis
    • Supply Chain Analysis
      • Supply Side Participants and their Roles
        • Producers
        • Mid-Level Participants (Traders/ Agents/ Brokers)
        • Wholesalers and Distributors
      • Value Added and Value Created at Node in the Supply Chain
      • List of Raw Material Suppliers
      • List of Existing and Potential Buyer’s
    • Investment Feasibility Matrix
    • Value Chain Analysis
      • Profit Margin Analysis
      • Wholesalers and Distributors
      • Retailers
    • PESTLE and Porter’s Analysis
    • Regulatory Landscape
      • By Key Regions
      • By Key Countries
    • Regional Parent Market Outlook
    • Production and Consumption Statistics
    • Import and Export Statistics
  4. Global Market Analysis 2020 to 2024 and Forecast, 2025 to 2035
    • Historical Market Size Value (USD Billion) & Volume (Thousand Unit) Analysis, 2020 to 2024
    • Current and Future Market Size Value (USD Billion) & Volume (Thousand Unit) Projections, 2025 to 2035
      • Y-o-Y Growth Trend Analysis
      • Absolute $ Opportunity Analysis
  5. Global Market Pricing Analysis 2020 to 2024 and Forecast 2025 to 2035
  6. Global Market Analysis 2020 to 2024 and Forecast 2025 to 2035, By Type
    • Introduction / Key Findings
    • Historical Market Size Value (USD Billion) & Volume (Thousand Unit) Analysis By Type, 2020 to 2024
    • Current and Future Market Size Value (USD Billion) & Volume (Thousand Unit) Analysis and Forecast By Type, 2025 to 2035
      • Unmanned Aerial Vehicles (UAVs)
        • Small UAVs
        • Medium UAVs
        • Large UAVs
      • Unmanned Ground Vehicles (UGVs)
        • Wheeled Systems
        • Tracked Systems
        • Legged Systems
        • Hybrid Systems
      • Unmanned Sea Vehicles
        • Unmanned Underwater Vehicles (UUVs)
        • Unmanned Surface Vehicles (USVs)
    • Y-o-Y Growth Trend Analysis By Type, 2020 to 2024
    • Absolute $ Opportunity Analysis By Type, 2025 to 2035
  7. Global Market Analysis 2020 to 2024 and Forecast 2025 to 2035, By Technology
    • Introduction / Key Findings
    • Historical Market Size Value (USD Billion) & Volume (Thousand Unit) Analysis By Technology, 2020 to 2024
    • Current and Future Market Size Value (USD Billion) & Volume (Thousand Unit) Analysis and Forecast By Technology, 2025 to 2035
      • Semi-autonomous Systems
      • Remotely Operated Systems
      • Fully Autonomous Systems
    • Y-o-Y Growth Trend Analysis By Technology, 2020 to 2024
    • Absolute $ Opportunity Analysis By Technology, 2025 to 2035
  8. Global Market Analysis 2020 to 2024 and Forecast 2025 to 2035, By Application
    • Introduction / Key Findings
    • Historical Market Size Value (USD Billion) & Volume (Thousand Unit) Analysis By Application, 2020 to 2024
    • Current and Future Market Size Value (USD Billion) & Volume (Thousand Unit) Analysis and Forecast By Application, 2025 to 2035
      • Military and Law Enforcement
      • Commercial
      • Others
    • Y-o-Y Growth Trend Analysis By Application, 2020 to 2024
    • Absolute $ Opportunity Analysis By Application, 2025 to 2035
  9. Global Market Analysis 2020 to 2024 and Forecast 2025 to 2035, By Region
    • Introduction
    • Historical Market Size Value (USD Billion) & Volume (Thousand Unit) Analysis By Region, 2020 to 2024
    • Current Market Size Value (USD Billion) & Volume (Thousand Unit) Analysis and Forecast By Region, 2025 to 2035
      • North America
      • Latin America
      • Western Europe
      • Eastern Europe
      • East Asia
      • South Asia & Pacific
      • Middle East and Africa
    • Market Attractiveness Analysis By Region
  10. North America Market Analysis 2020 to 2024 and Forecast 2025 to 2035, By Country
    • Historical Market Size Value (USD Billion) & Volume (Thousand Unit) Trend Analysis By Market Taxonomy, 2020 to 2024
    • Market Size Value (USD Billion) & Volume (Thousand Unit) Forecast By Market Taxonomy, 2025 to 2035
      • By Country
        • USA
        • Canada
        • Mexico
      • By Type
      • By Technology
      • By Application
    • Market Attractiveness Analysis
      • By Country
      • By Type
      • By Technology
      • By Application
    • Key Takeaways
  11. Latin America Market Analysis 2020 to 2024 and Forecast 2025 to 2035, By Country
    • Historical Market Size Value (USD Billion) & Volume (Thousand Unit) Trend Analysis By Market Taxonomy, 2020 to 2024
    • Market Size Value (USD Billion) & Volume (Thousand Unit) Forecast By Market Taxonomy, 2025 to 2035
      • By Country
        • Brazil
        • Argentina
        • Rest of LATAM
      • By Type
      • By Technology
      • By Application
    • Market Attractiveness Analysis
      • By Country
      • By Type
      • By Technology
      • By Application
    • Key Takeaways
  12. Western Europe Market Analysis 2020 to 2024 and Forecast 2025 to 2035, By Country
    • Historical Market Size Value (USD Billion) & Volume (Thousand Unit) Trend Analysis By Market Taxonomy, 2020 to 2024
    • Market Size Value (USD Billion) & Volume (Thousand Unit) Forecast By Market Taxonomy, 2025 to 2035
      • By Country
        • Germany
        • Italy
        • France
        • UK
        • Spain
        • BENELUX
        • Nordic
        • Rest of W.Europe
      • By Type
      • By Technology
      • By Application
    • Market Attractiveness Analysis
      • By Country
      • By Type
      • By Technology
      • By Application
    • Key Takeaways
  13. Eastern Europe Market Analysis 2020 to 2024 and Forecast 2025 to 2035, By Country
    • Historical Market Size Value (USD Billion) & Volume (Thousand Unit) Trend Analysis By Market Taxonomy, 2020 to 2024
    • Market Size Value (USD Billion) & Volume (Thousand Unit) Forecast By Market Taxonomy, 2025 to 2035
      • By Country
        • Russia
        • Hungary
        • Poland
        • Balkan & Baltics
        • Rest of E. Europe
      • By Type
      • By Technology
      • By Application
    • Market Attractiveness Analysis
      • By Country
      • By Type
      • By Technology
      • By Application
    • Key Takeaways
  14. East Asia Market Analysis 2020 to 2024 and Forecast 2025 to 2035, By Country
    • Historical Market Size Value (USD Billion) & Volume (Thousand Unit) Trend Analysis By Market Taxonomy, 2020 to 2024
    • Market Size Value (USD Billion) & Volume (Thousand Unit) Forecast By Market Taxonomy, 2025 to 2035
      • By Country
        • China
        • Japan
        • South Korea
      • By Type
      • By Technology
      • By Application
    • Market Attractiveness Analysis
      • By Country
      • By Type
      • By Technology
      • By Application
    • Key Takeaways
  15. South Asia & Pacific Market Analysis 2020 to 2024 and Forecast 2025 to 2035, By Country
    • Historical Market Size Value (USD Billion) & Volume (Thousand Unit) Trend Analysis By Market Taxonomy, 2020 to 2024
    • Market Size Value (USD Billion) & Volume (Thousand Unit) Forecast By Market Taxonomy, 2025 to 2035
      • By Country
        • India
        • Australia & New Zealand
        • ASEAN
        • Rest of SAP
      • By Type
      • By Technology
      • By Application
    • Market Attractiveness Analysis
      • By Country
      • By Type
      • By Technology
      • By Application
    • Key Takeaways
  16. Middle East and Africa Market Analysis 2020 to 2024 and Forecast 2025 to 2035, By Country
    • Historical Market Size Value (USD Billion) & Volume (Thousand Unit) Trend Analysis By Market Taxonomy, 2020 to 2024
    • Market Size Value (USD Billion) & Volume (Thousand Unit) Forecast By Market Taxonomy, 2025 to 2035
      • By Country
        • GCC Countries
        • Northern Africa
        • South Africa
        • Turkiye
        • Rest of MEA
      • By Type
      • By Technology
      • By Application
    • Market Attractiveness Analysis
      • By Country
      • By Type
      • By Technology
      • By Application
    • Key Takeaways
  17. Key Countries Market Analysis
    • USA
      • Pricing Analysis
      • Market Share Analysis, 2024
        • By Type
        • By Technology
        • By Application
    • Canada
      • Pricing Analysis
      • Market Share Analysis, 2024
        • By Type
        • By Technology
        • By Application
    • Brazil
      • Pricing Analysis
      • Market Share Analysis, 2024
        • By Type
        • By Technology
        • By Application
    • Mexico
      • Pricing Analysis
      • Market Share Analysis, 2024
        • By Type
        • By Technology
        • By Application
    • Argentina
      • Pricing Analysis
      • Market Share Analysis, 2024
        • By Type
        • By Technology
        • By Application
  18. Market Structure Analysis
    • Competition Dashboard
    • Competition Benchmarking
    • Market Share Analysis of Top Players
      • By Regional
      • By Type
      • By Technology
      • By Application
  19. Competition Analysis
    • Competition Deep Dive
      • Northrop Grumman
        • Overview
        • Product Portfolio
        • Profitability by Market Segments (Product/Age /Sales Channel/Region)
        • Sales Footprint
        • Strategy Overview
          • Marketing Strategy
          • Product Strategy
          • Channel Strategy
      • Lockheed Martin Corporation
        • Overview
        • Product Portfolio
        • Profitability by Market Segments (Product/Age /Sales Channel/Region)
        • Sales Footprint
        • Strategy Overview
          • Marketing Strategy
          • Product Strategy
          • Channel Strategy
      • Teledyne Technologies Inc.
        • Overview
        • Product Portfolio
        • Profitability by Market Segments (Product/Age /Sales Channel/Region)
        • Sales Footprint
        • Strategy Overview
          • Marketing Strategy
          • Product Strategy
          • Channel Strategy
      • BAE Systems
        • Overview
        • Product Portfolio
        • Profitability by Market Segments (Product/Age /Sales Channel/Region)
        • Sales Footprint
        • Strategy Overview
          • Marketing Strategy
          • Product Strategy
          • Channel Strategy
      • DJI
        • Overview
        • Product Portfolio
        • Profitability by Market Segments (Product/Age /Sales Channel/Region)
        • Sales Footprint
        • Strategy Overview
          • Marketing Strategy
          • Product Strategy
          • Channel Strategy
      • Thales
        • Overview
        • Product Portfolio
        • Profitability by Market Segments (Product/Age /Sales Channel/Region)
        • Sales Footprint
        • Strategy Overview
          • Marketing Strategy
          • Product Strategy
          • Channel Strategy
      • Israel Aerospace Industries
        • Overview
        • Product Portfolio
        • Profitability by Market Segments (Product/Age /Sales Channel/Region)
        • Sales Footprint
        • Strategy Overview
          • Marketing Strategy
          • Product Strategy
          • Channel Strategy
      • Boeing
        • Overview
        • Product Portfolio
        • Profitability by Market Segments (Product/Age /Sales Channel/Region)
        • Sales Footprint
        • Strategy Overview
          • Marketing Strategy
          • Product Strategy
          • Channel Strategy
      • General Dynamics Corporation
        • Overview
        • Product Portfolio
        • Profitability by Market Segments (Product/Age /Sales Channel/Region)
        • Sales Footprint
        • Strategy Overview
          • Marketing Strategy
          • Product Strategy
          • Channel Strategy
      • Textron Inc.
        • Overview
        • Product Portfolio
        • Profitability by Market Segments (Product/Age /Sales Channel/Region)
        • Sales Footprint
        • Strategy Overview
          • Marketing Strategy
          • Product Strategy
          • Channel Strategy
      • L3Harris Technologies Inc.
        • Overview
        • Product Portfolio
        • Profitability by Market Segments (Product/Age /Sales Channel/Region)
        • Sales Footprint
        • Strategy Overview
          • Marketing Strategy
          • Product Strategy
          • Channel Strategy
      • Elbit Systems Ltd.
        • Overview
        • Product Portfolio
        • Profitability by Market Segments (Product/Age /Sales Channel/Region)
        • Sales Footprint
        • Strategy Overview
          • Marketing Strategy
          • Product Strategy
          • Channel Strategy
  20. Assumptions & Acronyms Used
  21. Research Methodology

List of Tables

  • Table 1: Global Market Value (USD Billion) Forecast by Region, 2020 to 2035
  • Table 2: Global Market Volume (Thousand Unit) Forecast by Region, 2020 to 2035
  • Table 3: Global Market Value (USD Billion) Forecast by Type, 2020 to 2035
  • Table 4: Global Market Volume (Thousand Unit) Forecast by Type, 2020 to 2035
  • Table 5: Global Market Value (USD Billion) Forecast by Technology, 2020 to 2035
  • Table 6: Global Market Volume (Thousand Unit) Forecast by Technology, 2020 to 2035
  • Table 7: Global Market Value (USD Billion) Forecast by Application, 2020 to 2035
  • Table 8: Global Market Volume (Thousand Unit) Forecast by Application, 2020 to 2035
  • Table 9: North America Market Value (USD Billion) Forecast by Country, 2020 to 2035
  • Table 10: North America Market Volume (Thousand Unit) Forecast by Country, 2020 to 2035
  • Table 11: North America Market Value (USD Billion) Forecast by Type, 2020 to 2035
  • Table 12: North America Market Volume (Thousand Unit) Forecast by Type, 2020 to 2035
  • Table 13: North America Market Value (USD Billion) Forecast by Technology, 2020 to 2035
  • Table 14: North America Market Volume (Thousand Unit) Forecast by Technology, 2020 to 2035
  • Table 15: North America Market Value (USD Billion) Forecast by Application, 2020 to 2035
  • Table 16: North America Market Volume (Thousand Unit) Forecast by Application, 2020 to 2035
  • Table 17: Latin America Market Value (USD Billion) Forecast by Country, 2020 to 2035
  • Table 18: Latin America Market Volume (Thousand Unit) Forecast by Country, 2020 to 2035
  • Table 19: Latin America Market Value (USD Billion) Forecast by Type, 2020 to 2035
  • Table 20: Latin America Market Volume (Thousand Unit) Forecast by Type, 2020 to 2035
  • Table 21: Latin America Market Value (USD Billion) Forecast by Technology, 2020 to 2035
  • Table 22: Latin America Market Volume (Thousand Unit) Forecast by Technology, 2020 to 2035
  • Table 23: Latin America Market Value (USD Billion) Forecast by Application, 2020 to 2035
  • Table 24: Latin America Market Volume (Thousand Unit) Forecast by Application, 2020 to 2035
  • Table 25: Western Europe Market Value (USD Billion) Forecast by Country, 2020 to 2035
  • Table 26: Western Europe Market Volume (Thousand Unit) Forecast by Country, 2020 to 2035
  • Table 27: Western Europe Market Value (USD Billion) Forecast by Type, 2020 to 2035
  • Table 28: Western Europe Market Volume (Thousand Unit) Forecast by Type, 2020 to 2035
  • Table 29: Western Europe Market Value (USD Billion) Forecast by Technology, 2020 to 2035
  • Table 30: Western Europe Market Volume (Thousand Unit) Forecast by Technology, 2020 to 2035
  • Table 31: Western Europe Market Value (USD Billion) Forecast by Application, 2020 to 2035
  • Table 32: Western Europe Market Volume (Thousand Unit) Forecast by Application, 2020 to 2035
  • Table 33: Eastern Europe Market Value (USD Billion) Forecast by Country, 2020 to 2035
  • Table 34: Eastern Europe Market Volume (Thousand Unit) Forecast by Country, 2020 to 2035
  • Table 35: Eastern Europe Market Value (USD Billion) Forecast by Type, 2020 to 2035
  • Table 36: Eastern Europe Market Volume (Thousand Unit) Forecast by Type, 2020 to 2035
  • Table 37: Eastern Europe Market Value (USD Billion) Forecast by Technology, 2020 to 2035
  • Table 38: Eastern Europe Market Volume (Thousand Unit) Forecast by Technology, 2020 to 2035
  • Table 39: Eastern Europe Market Value (USD Billion) Forecast by Application, 2020 to 2035
  • Table 40: Eastern Europe Market Volume (Thousand Unit) Forecast by Application, 2020 to 2035
  • Table 41: East Asia Market Value (USD Billion) Forecast by Country, 2020 to 2035
  • Table 42: East Asia Market Volume (Thousand Unit) Forecast by Country, 2020 to 2035
  • Table 43: East Asia Market Value (USD Billion) Forecast by Type, 2020 to 2035
  • Table 44: East Asia Market Volume (Thousand Unit) Forecast by Type, 2020 to 2035
  • Table 45: East Asia Market Value (USD Billion) Forecast by Technology, 2020 to 2035
  • Table 46: East Asia Market Volume (Thousand Unit) Forecast by Technology, 2020 to 2035
  • Table 47: East Asia Market Value (USD Billion) Forecast by Application, 2020 to 2035
  • Table 48: East Asia Market Volume (Thousand Unit) Forecast by Application, 2020 to 2035
  • Table 49: South Asia & Pacific Market Value (USD Billion) Forecast by Country, 2020 to 2035
  • Table 50: South Asia & Pacific Market Volume (Thousand Unit) Forecast by Country, 2020 to 2035
  • Table 51: South Asia & Pacific Market Value (USD Billion) Forecast by Type, 2020 to 2035
  • Table 52: South Asia & Pacific Market Volume (Thousand Unit) Forecast by Type, 2020 to 2035
  • Table 53: South Asia & Pacific Market Value (USD Billion) Forecast by Technology, 2020 to 2035
  • Table 54: South Asia & Pacific Market Volume (Thousand Unit) Forecast by Technology, 2020 to 2035
  • Table 55: South Asia & Pacific Market Value (USD Billion) Forecast by Application, 2020 to 2035
  • Table 56: South Asia & Pacific Market Volume (Thousand Unit) Forecast by Application, 2020 to 2035
  • Table 57: Middle East and Africa Market Value (USD Billion) Forecast by Country, 2020 to 2035
  • Table 58: Middle East and Africa Market Volume (Thousand Unit) Forecast by Country, 2020 to 2035
  • Table 59: Middle East and Africa Market Value (USD Billion) Forecast by Type, 2020 to 2035
  • Table 60: Middle East and Africa Market Volume (Thousand Unit) Forecast by Type, 2020 to 2035
  • Table 61: Middle East and Africa Market Value (USD Billion) Forecast by Technology, 2020 to 2035
  • Table 62: Middle East and Africa Market Volume (Thousand Unit) Forecast by Technology, 2020 to 2035
  • Table 63: Middle East and Africa Market Value (USD Billion) Forecast by Application, 2020 to 2035
  • Table 64: Middle East and Africa Market Volume (Thousand Unit) Forecast by Application, 2020 to 2035

List of Figures

  • Figure 1: Global Market Volume (Thousand Unit) Forecast 2020 to 2035
  • Figure 2: Global Market Pricing Analysis
  • Figure 3: Global Market Value (USD Billion) Forecast 2020 to 2035
  • Figure 4: Global Market Value Share and BPS Analysis by Type, 2025 and 2035
  • Figure 5: Global Market Y-o-Y Growth Comparison by Type, 2025 to 2035
  • Figure 6: Global Market Attractiveness Analysis by Type
  • Figure 7: Global Market Value Share and BPS Analysis by Technology, 2025 and 2035
  • Figure 8: Global Market Y-o-Y Growth Comparison by Technology, 2025 to 2035
  • Figure 9: Global Market Attractiveness Analysis by Technology
  • Figure 10: Global Market Value Share and BPS Analysis by Application, 2025 and 2035
  • Figure 11: Global Market Y-o-Y Growth Comparison by Application, 2025 to 2035
  • Figure 12: Global Market Attractiveness Analysis by Application
  • Figure 13: Global Market Value (USD Billion) Share and BPS Analysis by Region, 2025 and 2035
  • Figure 14: Global Market Y-o-Y Growth Comparison by Region, 2025 to 2035
  • Figure 15: Global Market Attractiveness Analysis by Region
  • Figure 16: North America Market Incremental $ Opportunity, 2025 to 2035
  • Figure 17: Latin America Market Incremental $ Opportunity, 2025 to 2035
  • Figure 18: Western Europe Market Incremental $ Opportunity, 2025 to 2035
  • Figure 19: Eastern Europe Market Incremental $ Opportunity, 2025 to 2035
  • Figure 20: East Asia Market Incremental $ Opportunity, 2025 to 2035
  • Figure 21: South Asia & Pacific Market Incremental $ Opportunity, 2025 to 2035
  • Figure 22: Middle East and Africa Market Incremental $ Opportunity, 2025 to 2035
  • Figure 23: North America Market Value Share and BPS Analysis by Country, 2025 and 2035
  • Figure 24: North America Market Value Share and BPS Analysis by Type, 2025 and 2035
  • Figure 25: North America Market Y-o-Y Growth Comparison by Type, 2025 to 2035
  • Figure 26: North America Market Attractiveness Analysis by Type
  • Figure 27: North America Market Value Share and BPS Analysis by Technology, 2025 and 2035
  • Figure 28: North America Market Y-o-Y Growth Comparison by Technology, 2025 to 2035
  • Figure 29: North America Market Attractiveness Analysis by Technology
  • Figure 30: North America Market Value Share and BPS Analysis by Application, 2025 and 2035
  • Figure 31: North America Market Y-o-Y Growth Comparison by Application, 2025 to 2035
  • Figure 32: North America Market Attractiveness Analysis by Application
  • Figure 33: Latin America Market Value Share and BPS Analysis by Country, 2025 and 2035
  • Figure 34: Latin America Market Value Share and BPS Analysis by Type, 2025 and 2035
  • Figure 35: Latin America Market Y-o-Y Growth Comparison by Type, 2025 to 2035
  • Figure 36: Latin America Market Attractiveness Analysis by Type
  • Figure 37: Latin America Market Value Share and BPS Analysis by Technology, 2025 and 2035
  • Figure 38: Latin America Market Y-o-Y Growth Comparison by Technology, 2025 to 2035
  • Figure 39: Latin America Market Attractiveness Analysis by Technology
  • Figure 40: Latin America Market Value Share and BPS Analysis by Application, 2025 and 2035
  • Figure 41: Latin America Market Y-o-Y Growth Comparison by Application, 2025 to 2035
  • Figure 42: Latin America Market Attractiveness Analysis by Application
  • Figure 43: Western Europe Market Value Share and BPS Analysis by Country, 2025 and 2035
  • Figure 44: Western Europe Market Value Share and BPS Analysis by Type, 2025 and 2035
  • Figure 45: Western Europe Market Y-o-Y Growth Comparison by Type, 2025 to 2035
  • Figure 46: Western Europe Market Attractiveness Analysis by Type
  • Figure 47: Western Europe Market Value Share and BPS Analysis by Technology, 2025 and 2035
  • Figure 48: Western Europe Market Y-o-Y Growth Comparison by Technology, 2025 to 2035
  • Figure 49: Western Europe Market Attractiveness Analysis by Technology
  • Figure 50: Western Europe Market Value Share and BPS Analysis by Application, 2025 and 2035
  • Figure 51: Western Europe Market Y-o-Y Growth Comparison by Application, 2025 to 2035
  • Figure 52: Western Europe Market Attractiveness Analysis by Application
  • Figure 53: Eastern Europe Market Value Share and BPS Analysis by Country, 2025 and 2035
  • Figure 54: Eastern Europe Market Value Share and BPS Analysis by Type, 2025 and 2035
  • Figure 55: Eastern Europe Market Y-o-Y Growth Comparison by Type, 2025 to 2035
  • Figure 56: Eastern Europe Market Attractiveness Analysis by Type
  • Figure 57: Eastern Europe Market Value Share and BPS Analysis by Technology, 2025 and 2035
  • Figure 58: Eastern Europe Market Y-o-Y Growth Comparison by Technology, 2025 to 2035
  • Figure 59: Eastern Europe Market Attractiveness Analysis by Technology
  • Figure 60: Eastern Europe Market Value Share and BPS Analysis by Application, 2025 and 2035
  • Figure 61: Eastern Europe Market Y-o-Y Growth Comparison by Application, 2025 to 2035
  • Figure 62: Eastern Europe Market Attractiveness Analysis by Application
  • Figure 63: East Asia Market Value Share and BPS Analysis by Country, 2025 and 2035
  • Figure 64: East Asia Market Value Share and BPS Analysis by Type, 2025 and 2035
  • Figure 65: East Asia Market Y-o-Y Growth Comparison by Type, 2025 to 2035
  • Figure 66: East Asia Market Attractiveness Analysis by Type
  • Figure 67: East Asia Market Value Share and BPS Analysis by Technology, 2025 and 2035
  • Figure 68: East Asia Market Y-o-Y Growth Comparison by Technology, 2025 to 2035
  • Figure 69: East Asia Market Attractiveness Analysis by Technology
  • Figure 70: East Asia Market Value Share and BPS Analysis by Application, 2025 and 2035
  • Figure 71: East Asia Market Y-o-Y Growth Comparison by Application, 2025 to 2035
  • Figure 72: East Asia Market Attractiveness Analysis by Application
  • Figure 73: South Asia & Pacific Market Value Share and BPS Analysis by Country, 2025 and 2035
  • Figure 74: South Asia & Pacific Market Value Share and BPS Analysis by Type, 2025 and 2035
  • Figure 75: South Asia & Pacific Market Y-o-Y Growth Comparison by Type, 2025 to 2035
  • Figure 76: South Asia & Pacific Market Attractiveness Analysis by Type
  • Figure 77: South Asia & Pacific Market Value Share and BPS Analysis by Technology, 2025 and 2035
  • Figure 78: South Asia & Pacific Market Y-o-Y Growth Comparison by Technology, 2025 to 2035
  • Figure 79: South Asia & Pacific Market Attractiveness Analysis by Technology
  • Figure 80: South Asia & Pacific Market Value Share and BPS Analysis by Application, 2025 and 2035
  • Figure 81: South Asia & Pacific Market Y-o-Y Growth Comparison by Application, 2025 to 2035
  • Figure 82: South Asia & Pacific Market Attractiveness Analysis by Application
  • Figure 83: Middle East and Africa Market Value Share and BPS Analysis by Country, 2025 and 2035
  • Figure 84: Middle East and Africa Market Value Share and BPS Analysis by Type, 2025 and 2035
  • Figure 85: Middle East and Africa Market Y-o-Y Growth Comparison by Type, 2025 to 2035
  • Figure 86: Middle East and Africa Market Attractiveness Analysis by Type
  • Figure 87: Middle East and Africa Market Value Share and BPS Analysis by Technology, 2025 and 2035
  • Figure 88: Middle East and Africa Market Y-o-Y Growth Comparison by Technology, 2025 to 2035
  • Figure 89: Middle East and Africa Market Attractiveness Analysis by Technology
  • Figure 90: Middle East and Africa Market Value Share and BPS Analysis by Application, 2025 and 2035
  • Figure 91: Middle East and Africa Market Y-o-Y Growth Comparison by Application, 2025 to 2035
  • Figure 92: Middle East and Africa Market Attractiveness Analysis by Application
  • Figure 93: Global Market - Tier Structure Analysis
  • Figure 94: Global Market - Company Share Analysis

Frequently Asked Questions

What is the projected industry size of the unmanned systems industry by 2035?

The industry is projected to reach USD 76.05 billion by 2035.

What is the estimated industry size of the unmanned systems industry in 2025?

The market size is expected to be USD 28.02 billion in 2025.

What is the CAGR of the unmanned systems industry from 2025 to 2035?

The industry is expected to grow at a CAGR of 10.5% from 2025 to 2035.

What is the market share of semi-autonomous technology in the unmanned systems in 2025?

The semi-autonomous segment is projected to hold a 48.6% share in 2025.

What percentage of the unmanned systems industry is attributed to military and law enforcement applications in 2025?

Military and law enforcement applications are expected to account for 57.3% of the industry share in 2025.

Explore Similar Insights

Future Market Insights

Unmanned Systems Market