Unmanned Aerial Vehicle Market Size and Share Forecast Outlook 2025 to 2035

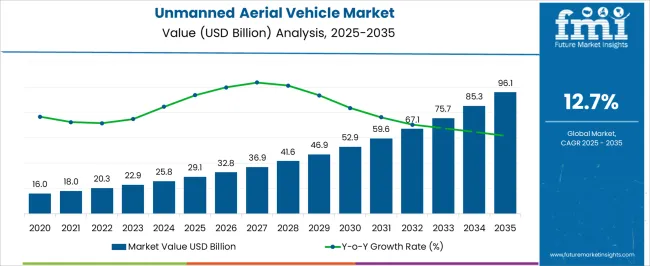
The Unmanned Aerial Vehicle Market is estimated to be valued at USD 29.1 billion in 2025 and is projected to reach USD 96.1 billion by 2035, registering a compound annual growth rate (CAGR) of 12.7% over the forecast period.
Quick Stats for Unmanned Aerial Vehicle Market

  • Unmanned Aerial Vehicle Market Value (2025): USD 29.1 billion
  • Unmanned Aerial Vehicle Market Forecast Value (2035): USD 96.1 billion
  • Unmanned Aerial Vehicle Market Forecast CAGR: 12.7%
  • Leading Segment in Unmanned Aerial Vehicle Market in 2025: Tactical (40.5%)
  • Key Growth Regions in Unmanned Aerial Vehicle Market: North America, Asia-Pacific, Europe
  • Top Key Players in Unmanned Aerial Vehicle Market: SZ DJI Technology Co. Ltd., Parrot SAS, Delair SAS, AeroVironment, Inc., Northrop Grumman Corporation, Elbit Systems Ltd., General Atomics, Israel Aerospace Industries Ltd., THALES, The Boeing Company, Microdrones GmbH (mdGroup Germany GmbH), BAYKAR TECH, Leonardo S.p.A, Textron Inc.

Unmanned Aerial Vehicle Market Market Value Analysis

Unmanned Aerial Vehicle Market Key Takeaways

Metric Value
Unmanned Aerial Vehicle Market Estimated Value in (2025 E) USD 29.1 billion
Unmanned Aerial Vehicle Market Forecast Value in (2035 F) USD 96.1 billion
Forecast CAGR (2025 to 2035) 12.7%

Why is the Unmanned Aerial Vehicle Market Growing?

The Unmanned Aerial Vehicle market is experiencing substantial growth, driven by increasing adoption across defense, commercial, and civil sectors. Rising demand for tactical and operational surveillance, reconnaissance missions, and industrial inspections is contributing to market expansion. Technological advancements in flight control systems, autonomous navigation, and sensor integration are enhancing UAV performance, reliability, and operational efficiency.

Battery-operated UAVs are gaining traction due to improved energy density, lightweight designs, and lower operational costs, supporting wider deployment. Growth is further supported by increasing investments in smart agriculture, infrastructure monitoring, logistics, and emergency response applications. Regulatory developments and airspace integration standards are shaping the market landscape, ensuring safe and compliant operations.

As organizations continue to prioritize real-time data collection, situational awareness, and cost-effective operational solutions, the UAV market is expected to experience sustained growth Innovations in endurance, payload capacity, and AI-enabled autonomous capabilities are anticipated to open new opportunities for both military and commercial applications over the coming decade, further solidifying the market’s long-term expansion potential.

Segmental Analysis

The unmanned aerial vehicle market is segmented by class, energy source, endurance, payload, wing type, applications, and geographic regions. By class, unmanned aerial vehicle market is divided into Tactical, Small, and Strategic. In terms of energy source, unmanned aerial vehicle market is classified into Battery Operated, Hydrogen, Solar, and Hybrid. Based on endurance, unmanned aerial vehicle market is segmented into Medium (5 Hrs - 24 Hrs), Short (< 5 Hrs), and High (> 24 Hrs). By payload, unmanned aerial vehicle market is segmented into Synthetic Aperture Radars (SARs), EW Systems, Electro-Optic Infrared Sensors (EO/IR), and C4I Systems. By wing type, unmanned aerial vehicle market is segmented into Fixed Wing, Tilt Wing, Unmanned Helicopter, and Multicopter. By applications, unmanned aerial vehicle market is segmented into Military, Commercial, and Homeland Security. Regionally, the unmanned aerial vehicle industry is classified into North America, Latin America, Western Europe, Eastern Europe, Balkan & Baltic Countries, Russia & Belarus, Central Asia, East Asia, South Asia & Pacific, and the Middle East & Africa.
Insights into the Tactical Class Segment

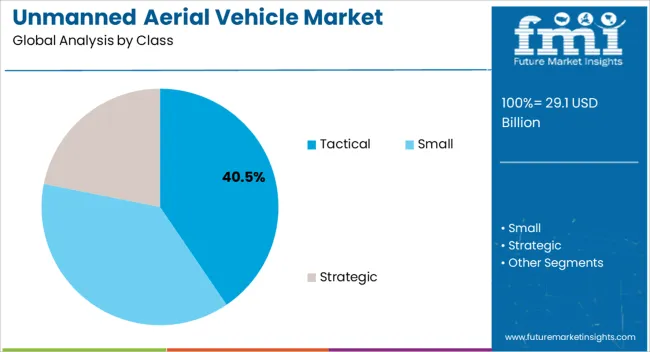
Unmanned Aerial Vehicle Market Analysis By Class

The tactical class segment is projected to hold 40.5% of the UAV market revenue in 2025, establishing it as the leading class. Growth in this segment is being driven by the increasing need for versatile UAVs capable of performing multiple mission types, including surveillance, reconnaissance, and intelligence gathering. Tactical UAVs offer flexibility, scalability, and rapid deployment capabilities, making them highly suitable for defense operations and critical infrastructure monitoring.

Their modular design and payload adaptability allow integration of advanced sensors, communication modules, and imaging systems to support diverse applications. The ability to operate in challenging environments while maintaining reliability and mission efficiency has reinforced their adoption among defense and security agencies.

As demand for cost-effective yet high-performance UAVs continues to rise, tactical UAVs are expected to maintain their leadership position, supported by advancements in autonomous navigation, real-time data processing, and operational control systems Enhanced survivability, operational endurance, and multi-role functionality continue to drive preference for this class.
Insights into the Battery Operated Energy Source Segment

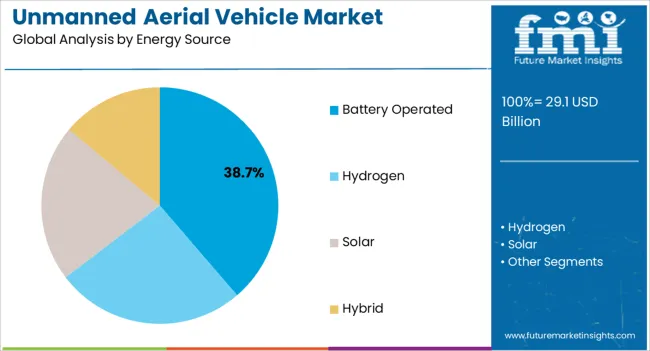
Unmanned Aerial Vehicle Market Analysis By Energy Source

The battery-operated segment is anticipated to account for 38.7% of the UAV market revenue in 2025, making it the leading energy source. Growth in this segment is driven by advancements in high-capacity lithium-ion and lithium-polymer battery technologies, which have improved flight time, reliability, and safety. Battery-operated UAVs provide lower operational costs, reduced maintenance requirements, and simplified logistics compared to conventional fuel-based alternatives.

These UAVs are increasingly adopted across defense, commercial, and research applications where portability, silent operation, and rapid deployment are critical. Energy-efficient designs, lightweight materials, and optimized propulsion systems further enhance battery performance. The integration of battery-operated UAVs with AI-enabled power management systems allows extended mission capabilities without frequent recharging.

As environmental sustainability and operational efficiency become priorities, battery-operated UAVs are expected to dominate market adoption Increasing demand for electric propulsion in both small and medium-sized UAVs is reinforcing their position as the preferred energy source, supported by continuous innovation in energy density and battery lifecycle management.
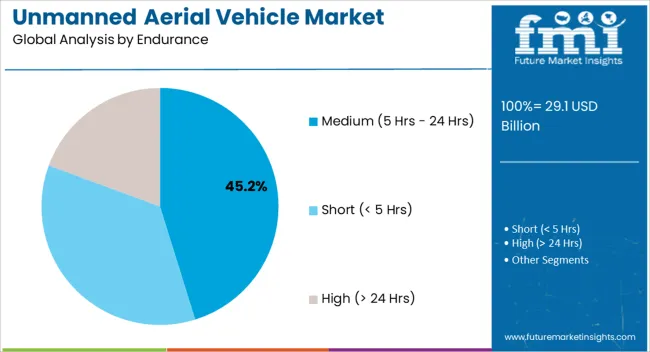
Insights into the Medium Endurance Segment (5 Hrs - 24 Hrs)

Unmanned Aerial Vehicle Market Analysis By Endurance

The medium endurance segment, defined by flight durations between 5 hours and 24 hours, is projected to hold 45.2% of the UAV market revenue in 2025, establishing it as the leading endurance category. Growth in this segment is driven by the need for UAVs capable of sustained missions without frequent refueling or battery replacement, making them suitable for both military and commercial applications. Medium endurance UAVs enable extended surveillance, reconnaissance, and data collection operations while maintaining operational efficiency and safety.

The ability to balance payload capacity, flight range, and operational flexibility makes this endurance range ideal for intelligence, environmental monitoring, and infrastructure inspections. Advancements in battery technology, energy management systems, and lightweight structural materials have enhanced mission duration and reliability.

Increasing adoption in sectors requiring long-duration flight capabilities, such as border security, disaster management, and precision agriculture, is further supporting growth As organizations prioritize operational continuity and cost-effective long-duration deployments, medium endurance UAVs are expected to remain the primary choice, sustaining their market dominance.

Market Overview

Unmanned Aerial Vehicle Market Outlook from 2025 to 2035

The unmanned aerial vehicle market is experiencing steady growth, with a projected market size of USD 25.8 billion in 2025. The positive trend is expected to continue, with the market reaching an estimated USD 83.6 billion by 2035. The market is likely to ascend at a CAGR of 12.7% over the next decade.

A key trend in the unmanned aerial vehicle market is the rapid advancement in drone autonomy. With significant strides in artificial intelligence and machine learning, modern unmanned aerial vehicles are increasingly capable of operating without human intervention.

Autonomous drones are now equipped with advanced sensors and real time data processing capabilities, enabling them to perform complex tasks such as surveillance, mapping, and even package delivery with high precision.

The above trend is driven by the demand for efficiency and safety in various industries, including agriculture, logistics, and defense. The integration of artificial intelligence allows unmanned aerial vehicles to navigate challenging environments, avoid obstacles, and make real time decisions, significantly reducing the need for human oversight.

Businesses are experiencing lower operational costs and enhanced productivity, fueling the growth of the unmanned aerial vehicle industry and paving the way for more innovative applications in the future.

Attributes Details
Unmanned Aerial Vehicle Market Size (2025E) USD 25.8 billion
Unmanned Aerial Vehicle Market Projected Size (2035F) USD 83.6 billion
Value CAGR (2025 to 2035) 12.7%

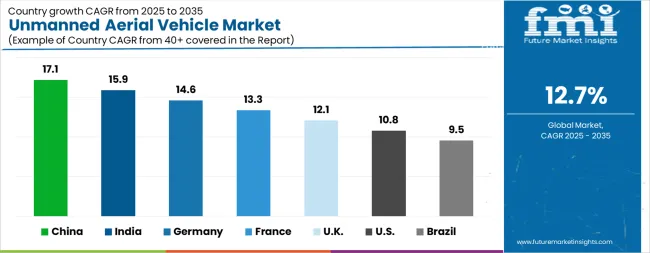
Analysis of Unmanned Aerial Vehicle Market By Key Countries

Unmanned Aerial Vehicle Market Cagr Analysis By Country

Country CAGR
China 17.1%
India 15.9%
Germany 14.6%
France 13.3%
UK 12.1%
USA 10.8%
Brazil 9.5%

Country-wise Analysis

The Unmanned Aerial Vehicle Market is expected to register a CAGR of 12.7% during the forecast period, exhibiting varied country level momentum. China leads with the highest CAGR of 17.1%, followed by India at 15.9%. Developed markets such as Germany, France, and the UK continue to expand steadily, while the USA is likely to grow at consistent rates. Brazil posts the lowest CAGR at 9.5%, yet still underscores a broadly positive trajectory for the global Unmanned Aerial Vehicle Market. In 2024, Germany held a dominant revenue in the Western Europe market and is expected to grow with a CAGR of 14.6%. The USA Unmanned Aerial Vehicle Market is estimated to be valued at USD 10.2 billion in 2025 and is anticipated to reach a valuation of USD 28.4 billion by 2035. Sales are projected to rise at a CAGR of 10.8% over the forecast period between 2025 and 2035. While Japan and South Korea markets are estimated to be valued at USD 1.4 billion and USD 797.3 million respectively in 2025.
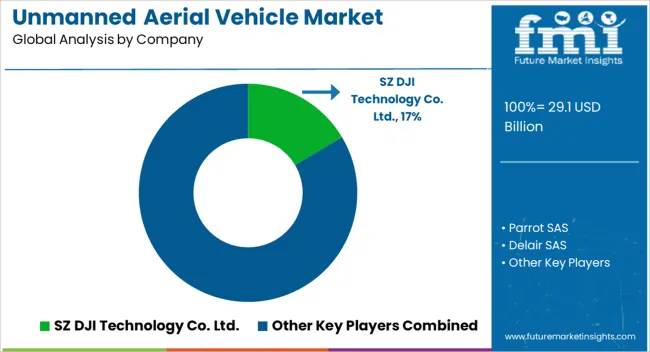
Key Players in the Unmanned Aerial Vehicle Market

Unmanned Aerial Vehicle Market Analysis By Company

  • SZ DJI Technology Co. Ltd.
  • Parrot SAS
  • Delair SAS
  • AeroVironment, Inc.
  • Northrop Grumman Corporation
  • Elbit Systems Ltd.
  • General Atomics
  • Israel Aerospace Industries Ltd.
  • THALES
  • The Boeing Company
  • Microdrones GmbH (mdGroup Germany GmbH)
  • BAYKAR TECH
  • Leonardo S.p.A
  • Textron Inc.

Scope of the Report

Item Value
Quantitative Units USD 29.1 Billion
Class Tactical, Small, and Strategic
Energy Source Battery Operated, Hydrogen, Solar, and Hybrid
Endurance Medium (5 Hrs - 24 Hrs), Short (< 5 Hrs), and High (> 24 Hrs)
Payload Synthetic Aperture Radars (SARs), EW Systems, Electro-Optic Infrared Sensors (EO/IR), and C4I Systems
Wing Type Fixed Wing, Tilt Wing, Unmanned Helicopter, and Multicopter
Applications Military, Commercial, and Homeland Security
Regions Covered North America, Europe, Asia-Pacific, Latin America, Middle East & Africa
Country Covered United States, Canada, Germany, France, United Kingdom, China, Japan, India, Brazil, South Africa
Key Companies Profiled SZ DJI Technology Co. Ltd., Parrot SAS, Delair SAS, AeroVironment, Inc., Northrop Grumman Corporation, Elbit Systems Ltd., General Atomics, Israel Aerospace Industries Ltd., THALES, The Boeing Company, Microdrones GmbH (mdGroup Germany GmbH), BAYKAR TECH, Leonardo S.p.A, and Textron Inc.

Unmanned Aerial Vehicle Market by Segments

Class:

  • Tactical
  • Small
  • Strategic

Energy Source:

  • Battery Operated
  • Hydrogen
  • Solar
  • Hybrid

Endurance:

  • Medium (5 Hrs - 24 Hrs)
  • Short (< 5 Hrs)
  • High (> 24 Hrs)

Payload:

  • Synthetic Aperture Radars (SARs)
  • EW Systems
  • Electro-Optic Infrared Sensors (EO/IR)
  • C4I Systems

Wing Type:

  • Fixed Wing
  • Tilt Wing
  • Unmanned Helicopter
  • Multicopter

Region:

  • North America
    • USA
    • Canada
    • Mexico
  • Latin America
    • Brazil
    • Chile
    • Rest of Latin America
  • Western Europe
    • Germany
    • UK
    • Italy
    • Spain
    • France
    • Nordic
    • BENELUX
    • Rest of Western Europe
  • Eastern Europe
    • Russia
    • Poland
    • Hungary
    • Balkan & Baltic
    • Rest of Eastern Europe
  • East Asia
    • China
    • Japan
    • South Korea
  • South Asia and Pacific
    • India
    • ASEAN
    • Australia & New Zealand
    • Rest of South Asia and Pacific
  • Middle East & Africa
    • Kingdom of Saudi Arabia
    • Other GCC Countries
    • Turkiye
    • South Africa
    • Other African Union
    • Rest of Middle East & Africa

Table of Content

  1. Executive Summary
    • Global Market Outlook
    • Demand-side Trends
    • Supply-side Trends
    • Technology Roadmap Analysis
    • Analysis and Recommendations
  2. Market Overview
    • Market Coverage / Taxonomy
    • Market Definition / Scope / Limitations
  3. Market Background
    • Market Dynamics
      • Drivers
      • Restraints
      • Opportunity
      • Trends
    • Scenario Forecast
      • Demand in Optimistic Scenario
      • Demand in Likely Scenario
      • Demand in Conservative Scenario
    • Opportunity Map Analysis
    • Product Life Cycle Analysis
    • Supply Chain Analysis
    • Investment Feasibility Matrix
    • Value Chain Analysis
    • PESTLE and Porter’s Analysis
    • Regulatory Landscape
    • Regional Parent Market Outlook
    • Production and Consumption Statistics
    • Import and Export Statistics
  4. Global Market Analysis 2020 to 2024 and Forecast, 2025 to 2035
    • Historical Market Size Value (USD Million) Analysis, 2020 to 2024
    • Current and Future Market Size Value (USD Million) Projections, 2025 to 2035
      • Y-o-Y Growth Trend Analysis
      • Absolute $ Opportunity Analysis
  5. Global Market Pricing Analysis 2020 to 2024 and Forecast 2025 to 2035
  6. Global Market Analysis 2020 to 2024 and Forecast 2025 to 2035, By Class
    • Introduction / Key Findings
    • Historical Market Size Value (USD Million) Analysis By Class , 2020 to 2024
    • Current and Future Market Size Value (USD Million) Analysis and Forecast By Class , 2025 to 2035
      • Tactical
      • Small
      • Strategic
    • Y-o-Y Growth Trend Analysis By Class , 2020 to 2024
    • Absolute $ Opportunity Analysis By Class , 2025 to 2035
  7. Global Market Analysis 2020 to 2024 and Forecast 2025 to 2035, By Energy Source
    • Introduction / Key Findings
    • Historical Market Size Value (USD Million) Analysis By Energy Source, 2020 to 2024
    • Current and Future Market Size Value (USD Million) Analysis and Forecast By Energy Source, 2025 to 2035
      • Battery Operated
      • Hydrogen
      • Solar
      • Hybrid
    • Y-o-Y Growth Trend Analysis By Energy Source, 2020 to 2024
    • Absolute $ Opportunity Analysis By Energy Source, 2025 to 2035
  8. Global Market Analysis 2020 to 2024 and Forecast 2025 to 2035, By Endurance
    • Introduction / Key Findings
    • Historical Market Size Value (USD Million) Analysis By Endurance, 2020 to 2024
    • Current and Future Market Size Value (USD Million) Analysis and Forecast By Endurance, 2025 to 2035
      • Medium (5 Hrs - 24 Hrs)
      • Short (< 5 Hrs)
      • High (> 24 Hrs)
    • Y-o-Y Growth Trend Analysis By Endurance, 2020 to 2024
    • Absolute $ Opportunity Analysis By Endurance, 2025 to 2035
  9. Global Market Analysis 2020 to 2024 and Forecast 2025 to 2035, By Payload
    • Introduction / Key Findings
    • Historical Market Size Value (USD Million) Analysis By Payload, 2020 to 2024
    • Current and Future Market Size Value (USD Million) Analysis and Forecast By Payload, 2025 to 2035
      • Synthetic Aperture Radars (SARs)
      • EW Systems
      • Electro-Optic Infrared Sensors (EO/IR)
      • C4I Systems
    • Y-o-Y Growth Trend Analysis By Payload, 2020 to 2024
    • Absolute $ Opportunity Analysis By Payload, 2025 to 2035
  10. Global Market Analysis 2020 to 2024 and Forecast 2025 to 2035, By Wing Type
    • Introduction / Key Findings
    • Historical Market Size Value (USD Million) Analysis By Wing Type, 2020 to 2024
    • Current and Future Market Size Value (USD Million) Analysis and Forecast By Wing Type, 2025 to 2035
      • Fixed Wing
      • Tilt Wing
      • Unmanned Helicopter
      • Multicopter
    • Y-o-Y Growth Trend Analysis By Wing Type, 2020 to 2024
    • Absolute $ Opportunity Analysis By Wing Type, 2025 to 2035
  11. Global Market Analysis 2020 to 2024 and Forecast 2025 to 2035, By Applications
    • Introduction / Key Findings
    • Historical Market Size Value (USD Million) Analysis By Applications, 2020 to 2024
    • Current and Future Market Size Value (USD Million) Analysis and Forecast By Applications, 2025 to 2035
      • Military
      • Commercial
      • Homeland Security
    • Y-o-Y Growth Trend Analysis By Applications, 2020 to 2024
    • Absolute $ Opportunity Analysis By Applications, 2025 to 2035
  12. Global Market Analysis 2020 to 2024 and Forecast 2025 to 2035, By Region
    • Introduction
    • Historical Market Size Value (USD Million) Analysis By Region, 2020 to 2024
    • Current Market Size Value (USD Million) Analysis and Forecast By Region, 2025 to 2035
      • North America
      • Latin America
      • Western Europe
      • Eastern Europe
      • East Asia
      • South Asia and Pacific
      • Middle East & Africa
    • Market Attractiveness Analysis By Region
  13. North America Market Analysis 2020 to 2024 and Forecast 2025 to 2035, By Country
    • Historical Market Size Value (USD Million) Trend Analysis By Market Taxonomy, 2020 to 2024
    • Market Size Value (USD Million) Forecast By Market Taxonomy, 2025 to 2035
      • By Country
        • USA
        • Canada
        • Mexico
      • By Class
      • By Energy Source
      • By Endurance
      • By Payload
      • By Wing Type
      • By Applications
    • Market Attractiveness Analysis
      • By Country
      • By Class
      • By Energy Source
      • By Endurance
      • By Payload
      • By Wing Type
      • By Applications
    • Key Takeaways
  14. Latin America Market Analysis 2020 to 2024 and Forecast 2025 to 2035, By Country
    • Historical Market Size Value (USD Million) Trend Analysis By Market Taxonomy, 2020 to 2024
    • Market Size Value (USD Million) Forecast By Market Taxonomy, 2025 to 2035
      • By Country
        • Brazil
        • Chile
        • Rest of Latin America
      • By Class
      • By Energy Source
      • By Endurance
      • By Payload
      • By Wing Type
      • By Applications
    • Market Attractiveness Analysis
      • By Country
      • By Class
      • By Energy Source
      • By Endurance
      • By Payload
      • By Wing Type
      • By Applications
    • Key Takeaways
  15. Western Europe Market Analysis 2020 to 2024 and Forecast 2025 to 2035, By Country
    • Historical Market Size Value (USD Million) Trend Analysis By Market Taxonomy, 2020 to 2024
    • Market Size Value (USD Million) Forecast By Market Taxonomy, 2025 to 2035
      • By Country
        • Germany
        • UK
        • Italy
        • Spain
        • France
        • Nordic
        • BENELUX
        • Rest of Western Europe
      • By Class
      • By Energy Source
      • By Endurance
      • By Payload
      • By Wing Type
      • By Applications
    • Market Attractiveness Analysis
      • By Country
      • By Class
      • By Energy Source
      • By Endurance
      • By Payload
      • By Wing Type
      • By Applications
    • Key Takeaways
  16. Eastern Europe Market Analysis 2020 to 2024 and Forecast 2025 to 2035, By Country
    • Historical Market Size Value (USD Million) Trend Analysis By Market Taxonomy, 2020 to 2024
    • Market Size Value (USD Million) Forecast By Market Taxonomy, 2025 to 2035
      • By Country
        • Russia
        • Poland
        • Hungary
        • Balkan & Baltic
        • Rest of Eastern Europe
      • By Class
      • By Energy Source
      • By Endurance
      • By Payload
      • By Wing Type
      • By Applications
    • Market Attractiveness Analysis
      • By Country
      • By Class
      • By Energy Source
      • By Endurance
      • By Payload
      • By Wing Type
      • By Applications
    • Key Takeaways
  17. East Asia Market Analysis 2020 to 2024 and Forecast 2025 to 2035, By Country
    • Historical Market Size Value (USD Million) Trend Analysis By Market Taxonomy, 2020 to 2024
    • Market Size Value (USD Million) Forecast By Market Taxonomy, 2025 to 2035
      • By Country
        • China
        • Japan
        • South Korea
      • By Class
      • By Energy Source
      • By Endurance
      • By Payload
      • By Wing Type
      • By Applications
    • Market Attractiveness Analysis
      • By Country
      • By Class
      • By Energy Source
      • By Endurance
      • By Payload
      • By Wing Type
      • By Applications
    • Key Takeaways
  18. South Asia and Pacific Market Analysis 2020 to 2024 and Forecast 2025 to 2035, By Country
    • Historical Market Size Value (USD Million) Trend Analysis By Market Taxonomy, 2020 to 2024
    • Market Size Value (USD Million) Forecast By Market Taxonomy, 2025 to 2035
      • By Country
        • India
        • ASEAN
        • Australia & New Zealand
        • Rest of South Asia and Pacific
      • By Class
      • By Energy Source
      • By Endurance
      • By Payload
      • By Wing Type
      • By Applications
    • Market Attractiveness Analysis
      • By Country
      • By Class
      • By Energy Source
      • By Endurance
      • By Payload
      • By Wing Type
      • By Applications
    • Key Takeaways
  19. Middle East & Africa Market Analysis 2020 to 2024 and Forecast 2025 to 2035, By Country
    • Historical Market Size Value (USD Million) Trend Analysis By Market Taxonomy, 2020 to 2024
    • Market Size Value (USD Million) Forecast By Market Taxonomy, 2025 to 2035
      • By Country
        • Kingdom of Saudi Arabia
        • Other GCC Countries
        • Turkiye
        • South Africa
        • Other African Union
        • Rest of Middle East & Africa
      • By Class
      • By Energy Source
      • By Endurance
      • By Payload
      • By Wing Type
      • By Applications
    • Market Attractiveness Analysis
      • By Country
      • By Class
      • By Energy Source
      • By Endurance
      • By Payload
      • By Wing Type
      • By Applications
    • Key Takeaways
  20. Key Countries Market Analysis
    • USA
      • Pricing Analysis
      • Market Share Analysis, 2024
        • By Class
        • By Energy Source
        • By Endurance
        • By Payload
        • By Wing Type
        • By Applications
    • Canada
      • Pricing Analysis
      • Market Share Analysis, 2024
        • By Class
        • By Energy Source
        • By Endurance
        • By Payload
        • By Wing Type
        • By Applications
    • Mexico
      • Pricing Analysis
      • Market Share Analysis, 2024
        • By Class
        • By Energy Source
        • By Endurance
        • By Payload
        • By Wing Type
        • By Applications
    • Brazil
      • Pricing Analysis
      • Market Share Analysis, 2024
        • By Class
        • By Energy Source
        • By Endurance
        • By Payload
        • By Wing Type
        • By Applications
    • Chile
      • Pricing Analysis
      • Market Share Analysis, 2024
        • By Class
        • By Energy Source
        • By Endurance
        • By Payload
        • By Wing Type
        • By Applications
    • Germany
      • Pricing Analysis
      • Market Share Analysis, 2024
        • By Class
        • By Energy Source
        • By Endurance
        • By Payload
        • By Wing Type
        • By Applications
    • UK
      • Pricing Analysis
      • Market Share Analysis, 2024
        • By Class
        • By Energy Source
        • By Endurance
        • By Payload
        • By Wing Type
        • By Applications
    • Italy
      • Pricing Analysis
      • Market Share Analysis, 2024
        • By Class
        • By Energy Source
        • By Endurance
        • By Payload
        • By Wing Type
        • By Applications
    • Spain
      • Pricing Analysis
      • Market Share Analysis, 2024
        • By Class
        • By Energy Source
        • By Endurance
        • By Payload
        • By Wing Type
        • By Applications
    • France
      • Pricing Analysis
      • Market Share Analysis, 2024
        • By Class
        • By Energy Source
        • By Endurance
        • By Payload
        • By Wing Type
        • By Applications
    • India
      • Pricing Analysis
      • Market Share Analysis, 2024
        • By Class
        • By Energy Source
        • By Endurance
        • By Payload
        • By Wing Type
        • By Applications
    • ASEAN
      • Pricing Analysis
      • Market Share Analysis, 2024
        • By Class
        • By Energy Source
        • By Endurance
        • By Payload
        • By Wing Type
        • By Applications
    • Australia & New Zealand
      • Pricing Analysis
      • Market Share Analysis, 2024
        • By Class
        • By Energy Source
        • By Endurance
        • By Payload
        • By Wing Type
        • By Applications
    • China
      • Pricing Analysis
      • Market Share Analysis, 2024
        • By Class
        • By Energy Source
        • By Endurance
        • By Payload
        • By Wing Type
        • By Applications
    • Japan
      • Pricing Analysis
      • Market Share Analysis, 2024
        • By Class
        • By Energy Source
        • By Endurance
        • By Payload
        • By Wing Type
        • By Applications
    • South Korea
      • Pricing Analysis
      • Market Share Analysis, 2024
        • By Class
        • By Energy Source
        • By Endurance
        • By Payload
        • By Wing Type
        • By Applications
    • Russia
      • Pricing Analysis
      • Market Share Analysis, 2024
        • By Class
        • By Energy Source
        • By Endurance
        • By Payload
        • By Wing Type
        • By Applications
    • Poland
      • Pricing Analysis
      • Market Share Analysis, 2024
        • By Class
        • By Energy Source
        • By Endurance
        • By Payload
        • By Wing Type
        • By Applications
    • Hungary
      • Pricing Analysis
      • Market Share Analysis, 2024
        • By Class
        • By Energy Source
        • By Endurance
        • By Payload
        • By Wing Type
        • By Applications
    • Kingdom of Saudi Arabia
      • Pricing Analysis
      • Market Share Analysis, 2024
        • By Class
        • By Energy Source
        • By Endurance
        • By Payload
        • By Wing Type
        • By Applications
    • Turkiye
      • Pricing Analysis
      • Market Share Analysis, 2024
        • By Class
        • By Energy Source
        • By Endurance
        • By Payload
        • By Wing Type
        • By Applications
    • South Africa
      • Pricing Analysis
      • Market Share Analysis, 2024
        • By Class
        • By Energy Source
        • By Endurance
        • By Payload
        • By Wing Type
        • By Applications
  21. Market Structure Analysis
    • Competition Dashboard
    • Competition Benchmarking
    • Market Share Analysis of Top Players
      • By Regional
      • By Class
      • By Energy Source
      • By Endurance
      • By Payload
      • By Wing Type
      • By Applications
  22. Competition Analysis
    • Competition Deep Dive
      • SZ DJI Technology Co. Ltd.
        • Overview
        • Product Portfolio
        • Profitability by Market Segments (Product/Age /Sales Channel/Region)
        • Sales Footprint
        • Strategy Overview
          • Marketing Strategy
          • Product Strategy
          • Channel Strategy
      • Parrot SAS
      • Delair SAS
      • AeroVironment, Inc.
      • Northrop Grumman Corporation
      • Elbit Systems Ltd.
      • General Atomics
      • Israel Aerospace Industries Ltd.
      • THALES
      • The Boeing Company
      • Microdrones GmbH (mdGroup Germany GmbH)
      • BAYKAR TECH
      • Leonardo S.p.A
      • Textron Inc.
  23. Assumptions & Acronyms Used
  24. Research Methodology

List of Tables

  • Table 1: Global Market Value (USD Million) Forecast by Region, 2020 to 2035
  • Table 2: Global Market Value (USD Million) Forecast by Class , 2020 to 2035
  • Table 3: Global Market Value (USD Million) Forecast by Energy Source, 2020 to 2035
  • Table 4: Global Market Value (USD Million) Forecast by Endurance, 2020 to 2035
  • Table 5: Global Market Value (USD Million) Forecast by Payload, 2020 to 2035
  • Table 6: Global Market Value (USD Million) Forecast by Wing Type, 2020 to 2035
  • Table 7: Global Market Value (USD Million) Forecast by Applications, 2020 to 2035
  • Table 8: North America Market Value (USD Million) Forecast by Country, 2020 to 2035
  • Table 9: North America Market Value (USD Million) Forecast by Class , 2020 to 2035
  • Table 10: North America Market Value (USD Million) Forecast by Energy Source, 2020 to 2035
  • Table 11: North America Market Value (USD Million) Forecast by Endurance, 2020 to 2035
  • Table 12: North America Market Value (USD Million) Forecast by Payload, 2020 to 2035
  • Table 13: North America Market Value (USD Million) Forecast by Wing Type, 2020 to 2035
  • Table 14: North America Market Value (USD Million) Forecast by Applications, 2020 to 2035
  • Table 15: Latin America Market Value (USD Million) Forecast by Country, 2020 to 2035
  • Table 16: Latin America Market Value (USD Million) Forecast by Class , 2020 to 2035
  • Table 17: Latin America Market Value (USD Million) Forecast by Energy Source, 2020 to 2035
  • Table 18: Latin America Market Value (USD Million) Forecast by Endurance, 2020 to 2035
  • Table 19: Latin America Market Value (USD Million) Forecast by Payload, 2020 to 2035
  • Table 20: Latin America Market Value (USD Million) Forecast by Wing Type, 2020 to 2035
  • Table 21: Latin America Market Value (USD Million) Forecast by Applications, 2020 to 2035
  • Table 22: Western Europe Market Value (USD Million) Forecast by Country, 2020 to 2035
  • Table 23: Western Europe Market Value (USD Million) Forecast by Class , 2020 to 2035
  • Table 24: Western Europe Market Value (USD Million) Forecast by Energy Source, 2020 to 2035
  • Table 25: Western Europe Market Value (USD Million) Forecast by Endurance, 2020 to 2035
  • Table 26: Western Europe Market Value (USD Million) Forecast by Payload, 2020 to 2035
  • Table 27: Western Europe Market Value (USD Million) Forecast by Wing Type, 2020 to 2035
  • Table 28: Western Europe Market Value (USD Million) Forecast by Applications, 2020 to 2035
  • Table 29: Eastern Europe Market Value (USD Million) Forecast by Country, 2020 to 2035
  • Table 30: Eastern Europe Market Value (USD Million) Forecast by Class , 2020 to 2035
  • Table 31: Eastern Europe Market Value (USD Million) Forecast by Energy Source, 2020 to 2035
  • Table 32: Eastern Europe Market Value (USD Million) Forecast by Endurance, 2020 to 2035
  • Table 33: Eastern Europe Market Value (USD Million) Forecast by Payload, 2020 to 2035
  • Table 34: Eastern Europe Market Value (USD Million) Forecast by Wing Type, 2020 to 2035
  • Table 35: Eastern Europe Market Value (USD Million) Forecast by Applications, 2020 to 2035
  • Table 36: East Asia Market Value (USD Million) Forecast by Country, 2020 to 2035
  • Table 37: East Asia Market Value (USD Million) Forecast by Class , 2020 to 2035
  • Table 38: East Asia Market Value (USD Million) Forecast by Energy Source, 2020 to 2035
  • Table 39: East Asia Market Value (USD Million) Forecast by Endurance, 2020 to 2035
  • Table 40: East Asia Market Value (USD Million) Forecast by Payload, 2020 to 2035
  • Table 41: East Asia Market Value (USD Million) Forecast by Wing Type, 2020 to 2035
  • Table 42: East Asia Market Value (USD Million) Forecast by Applications, 2020 to 2035
  • Table 43: South Asia and Pacific Market Value (USD Million) Forecast by Country, 2020 to 2035
  • Table 44: South Asia and Pacific Market Value (USD Million) Forecast by Class , 2020 to 2035
  • Table 45: South Asia and Pacific Market Value (USD Million) Forecast by Energy Source, 2020 to 2035
  • Table 46: South Asia and Pacific Market Value (USD Million) Forecast by Endurance, 2020 to 2035
  • Table 47: South Asia and Pacific Market Value (USD Million) Forecast by Payload, 2020 to 2035
  • Table 48: South Asia and Pacific Market Value (USD Million) Forecast by Wing Type, 2020 to 2035
  • Table 49: South Asia and Pacific Market Value (USD Million) Forecast by Applications, 2020 to 2035
  • Table 50: Middle East & Africa Market Value (USD Million) Forecast by Country, 2020 to 2035
  • Table 51: Middle East & Africa Market Value (USD Million) Forecast by Class , 2020 to 2035
  • Table 52: Middle East & Africa Market Value (USD Million) Forecast by Energy Source, 2020 to 2035
  • Table 53: Middle East & Africa Market Value (USD Million) Forecast by Endurance, 2020 to 2035
  • Table 54: Middle East & Africa Market Value (USD Million) Forecast by Payload, 2020 to 2035
  • Table 55: Middle East & Africa Market Value (USD Million) Forecast by Wing Type, 2020 to 2035
  • Table 56: Middle East & Africa Market Value (USD Million) Forecast by Applications, 2020 to 2035

List of Figures

  • Figure 1: Global Market Pricing Analysis
  • Figure 2: Global Market Value (USD Million) Forecast 2020-2035
  • Figure 3: Global Market Value Share and BPS Analysis by Class , 2025 and 2035
  • Figure 4: Global Market Y-o-Y Growth Comparison by Class , 2025-2035
  • Figure 5: Global Market Attractiveness Analysis by Class
  • Figure 6: Global Market Value Share and BPS Analysis by Energy Source, 2025 and 2035
  • Figure 7: Global Market Y-o-Y Growth Comparison by Energy Source, 2025-2035
  • Figure 8: Global Market Attractiveness Analysis by Energy Source
  • Figure 9: Global Market Value Share and BPS Analysis by Endurance, 2025 and 2035
  • Figure 10: Global Market Y-o-Y Growth Comparison by Endurance, 2025-2035
  • Figure 11: Global Market Attractiveness Analysis by Endurance
  • Figure 12: Global Market Value Share and BPS Analysis by Payload, 2025 and 2035
  • Figure 13: Global Market Y-o-Y Growth Comparison by Payload, 2025-2035
  • Figure 14: Global Market Attractiveness Analysis by Payload
  • Figure 15: Global Market Value Share and BPS Analysis by Wing Type, 2025 and 2035
  • Figure 16: Global Market Y-o-Y Growth Comparison by Wing Type, 2025-2035
  • Figure 17: Global Market Attractiveness Analysis by Wing Type
  • Figure 18: Global Market Value Share and BPS Analysis by Applications, 2025 and 2035
  • Figure 19: Global Market Y-o-Y Growth Comparison by Applications, 2025-2035
  • Figure 20: Global Market Attractiveness Analysis by Applications
  • Figure 21: Global Market Value (USD Million) Share and BPS Analysis by Region, 2025 and 2035
  • Figure 22: Global Market Y-o-Y Growth Comparison by Region, 2025-2035
  • Figure 23: Global Market Attractiveness Analysis by Region
  • Figure 24: North America Market Incremental Dollar Opportunity, 2025-2035
  • Figure 25: Latin America Market Incremental Dollar Opportunity, 2025-2035
  • Figure 26: Western Europe Market Incremental Dollar Opportunity, 2025-2035
  • Figure 27: Eastern Europe Market Incremental Dollar Opportunity, 2025-2035
  • Figure 28: East Asia Market Incremental Dollar Opportunity, 2025-2035
  • Figure 29: South Asia and Pacific Market Incremental Dollar Opportunity, 2025-2035
  • Figure 30: Middle East & Africa Market Incremental Dollar Opportunity, 2025-2035
  • Figure 31: North America Market Value Share and BPS Analysis by Country, 2025 and 2035
  • Figure 32: North America Market Value Share and BPS Analysis by Class , 2025 and 2035
  • Figure 33: North America Market Y-o-Y Growth Comparison by Class , 2025-2035
  • Figure 34: North America Market Attractiveness Analysis by Class
  • Figure 35: North America Market Value Share and BPS Analysis by Energy Source, 2025 and 2035
  • Figure 36: North America Market Y-o-Y Growth Comparison by Energy Source, 2025-2035
  • Figure 37: North America Market Attractiveness Analysis by Energy Source
  • Figure 38: North America Market Value Share and BPS Analysis by Endurance, 2025 and 2035
  • Figure 39: North America Market Y-o-Y Growth Comparison by Endurance, 2025-2035
  • Figure 40: North America Market Attractiveness Analysis by Endurance
  • Figure 41: North America Market Value Share and BPS Analysis by Payload, 2025 and 2035
  • Figure 42: North America Market Y-o-Y Growth Comparison by Payload, 2025-2035
  • Figure 43: North America Market Attractiveness Analysis by Payload
  • Figure 44: North America Market Value Share and BPS Analysis by Wing Type, 2025 and 2035
  • Figure 45: North America Market Y-o-Y Growth Comparison by Wing Type, 2025-2035
  • Figure 46: North America Market Attractiveness Analysis by Wing Type
  • Figure 47: North America Market Value Share and BPS Analysis by Applications, 2025 and 2035
  • Figure 48: North America Market Y-o-Y Growth Comparison by Applications, 2025-2035
  • Figure 49: North America Market Attractiveness Analysis by Applications
  • Figure 50: Latin America Market Value Share and BPS Analysis by Country, 2025 and 2035
  • Figure 51: Latin America Market Value Share and BPS Analysis by Class , 2025 and 2035
  • Figure 52: Latin America Market Y-o-Y Growth Comparison by Class , 2025-2035
  • Figure 53: Latin America Market Attractiveness Analysis by Class
  • Figure 54: Latin America Market Value Share and BPS Analysis by Energy Source, 2025 and 2035
  • Figure 55: Latin America Market Y-o-Y Growth Comparison by Energy Source, 2025-2035
  • Figure 56: Latin America Market Attractiveness Analysis by Energy Source
  • Figure 57: Latin America Market Value Share and BPS Analysis by Endurance, 2025 and 2035
  • Figure 58: Latin America Market Y-o-Y Growth Comparison by Endurance, 2025-2035
  • Figure 59: Latin America Market Attractiveness Analysis by Endurance
  • Figure 60: Latin America Market Value Share and BPS Analysis by Payload, 2025 and 2035
  • Figure 61: Latin America Market Y-o-Y Growth Comparison by Payload, 2025-2035
  • Figure 62: Latin America Market Attractiveness Analysis by Payload
  • Figure 63: Latin America Market Value Share and BPS Analysis by Wing Type, 2025 and 2035
  • Figure 64: Latin America Market Y-o-Y Growth Comparison by Wing Type, 2025-2035
  • Figure 65: Latin America Market Attractiveness Analysis by Wing Type
  • Figure 66: Latin America Market Value Share and BPS Analysis by Applications, 2025 and 2035
  • Figure 67: Latin America Market Y-o-Y Growth Comparison by Applications, 2025-2035
  • Figure 68: Latin America Market Attractiveness Analysis by Applications
  • Figure 69: Western Europe Market Value Share and BPS Analysis by Country, 2025 and 2035
  • Figure 70: Western Europe Market Value Share and BPS Analysis by Class , 2025 and 2035
  • Figure 71: Western Europe Market Y-o-Y Growth Comparison by Class , 2025-2035
  • Figure 72: Western Europe Market Attractiveness Analysis by Class
  • Figure 73: Western Europe Market Value Share and BPS Analysis by Energy Source, 2025 and 2035
  • Figure 74: Western Europe Market Y-o-Y Growth Comparison by Energy Source, 2025-2035
  • Figure 75: Western Europe Market Attractiveness Analysis by Energy Source
  • Figure 76: Western Europe Market Value Share and BPS Analysis by Endurance, 2025 and 2035
  • Figure 77: Western Europe Market Y-o-Y Growth Comparison by Endurance, 2025-2035
  • Figure 78: Western Europe Market Attractiveness Analysis by Endurance
  • Figure 79: Western Europe Market Value Share and BPS Analysis by Payload, 2025 and 2035
  • Figure 80: Western Europe Market Y-o-Y Growth Comparison by Payload, 2025-2035
  • Figure 81: Western Europe Market Attractiveness Analysis by Payload
  • Figure 82: Western Europe Market Value Share and BPS Analysis by Wing Type, 2025 and 2035
  • Figure 83: Western Europe Market Y-o-Y Growth Comparison by Wing Type, 2025-2035
  • Figure 84: Western Europe Market Attractiveness Analysis by Wing Type
  • Figure 85: Western Europe Market Value Share and BPS Analysis by Applications, 2025 and 2035
  • Figure 86: Western Europe Market Y-o-Y Growth Comparison by Applications, 2025-2035
  • Figure 87: Western Europe Market Attractiveness Analysis by Applications
  • Figure 88: Eastern Europe Market Value Share and BPS Analysis by Country, 2025 and 2035
  • Figure 89: Eastern Europe Market Value Share and BPS Analysis by Class , 2025 and 2035
  • Figure 90: Eastern Europe Market Y-o-Y Growth Comparison by Class , 2025-2035
  • Figure 91: Eastern Europe Market Attractiveness Analysis by Class
  • Figure 92: Eastern Europe Market Value Share and BPS Analysis by Energy Source, 2025 and 2035
  • Figure 93: Eastern Europe Market Y-o-Y Growth Comparison by Energy Source, 2025-2035
  • Figure 94: Eastern Europe Market Attractiveness Analysis by Energy Source
  • Figure 95: Eastern Europe Market Value Share and BPS Analysis by Endurance, 2025 and 2035
  • Figure 96: Eastern Europe Market Y-o-Y Growth Comparison by Endurance, 2025-2035
  • Figure 97: Eastern Europe Market Attractiveness Analysis by Endurance
  • Figure 98: Eastern Europe Market Value Share and BPS Analysis by Payload, 2025 and 2035
  • Figure 99: Eastern Europe Market Y-o-Y Growth Comparison by Payload, 2025-2035
  • Figure 100: Eastern Europe Market Attractiveness Analysis by Payload
  • Figure 101: Eastern Europe Market Value Share and BPS Analysis by Wing Type, 2025 and 2035
  • Figure 102: Eastern Europe Market Y-o-Y Growth Comparison by Wing Type, 2025-2035
  • Figure 103: Eastern Europe Market Attractiveness Analysis by Wing Type
  • Figure 104: Eastern Europe Market Value Share and BPS Analysis by Applications, 2025 and 2035
  • Figure 105: Eastern Europe Market Y-o-Y Growth Comparison by Applications, 2025-2035
  • Figure 106: Eastern Europe Market Attractiveness Analysis by Applications
  • Figure 107: East Asia Market Value Share and BPS Analysis by Country, 2025 and 2035
  • Figure 108: East Asia Market Value Share and BPS Analysis by Class , 2025 and 2035
  • Figure 109: East Asia Market Y-o-Y Growth Comparison by Class , 2025-2035
  • Figure 110: East Asia Market Attractiveness Analysis by Class
  • Figure 111: East Asia Market Value Share and BPS Analysis by Energy Source, 2025 and 2035
  • Figure 112: East Asia Market Y-o-Y Growth Comparison by Energy Source, 2025-2035
  • Figure 113: East Asia Market Attractiveness Analysis by Energy Source
  • Figure 114: East Asia Market Value Share and BPS Analysis by Endurance, 2025 and 2035
  • Figure 115: East Asia Market Y-o-Y Growth Comparison by Endurance, 2025-2035
  • Figure 116: East Asia Market Attractiveness Analysis by Endurance
  • Figure 117: East Asia Market Value Share and BPS Analysis by Payload, 2025 and 2035
  • Figure 118: East Asia Market Y-o-Y Growth Comparison by Payload, 2025-2035
  • Figure 119: East Asia Market Attractiveness Analysis by Payload
  • Figure 120: East Asia Market Value Share and BPS Analysis by Wing Type, 2025 and 2035
  • Figure 121: East Asia Market Y-o-Y Growth Comparison by Wing Type, 2025-2035
  • Figure 122: East Asia Market Attractiveness Analysis by Wing Type
  • Figure 123: East Asia Market Value Share and BPS Analysis by Applications, 2025 and 2035
  • Figure 124: East Asia Market Y-o-Y Growth Comparison by Applications, 2025-2035
  • Figure 125: East Asia Market Attractiveness Analysis by Applications
  • Figure 126: South Asia and Pacific Market Value Share and BPS Analysis by Country, 2025 and 2035
  • Figure 127: South Asia and Pacific Market Value Share and BPS Analysis by Class , 2025 and 2035
  • Figure 128: South Asia and Pacific Market Y-o-Y Growth Comparison by Class , 2025-2035
  • Figure 129: South Asia and Pacific Market Attractiveness Analysis by Class
  • Figure 130: South Asia and Pacific Market Value Share and BPS Analysis by Energy Source, 2025 and 2035
  • Figure 131: South Asia and Pacific Market Y-o-Y Growth Comparison by Energy Source, 2025-2035
  • Figure 132: South Asia and Pacific Market Attractiveness Analysis by Energy Source
  • Figure 133: South Asia and Pacific Market Value Share and BPS Analysis by Endurance, 2025 and 2035
  • Figure 134: South Asia and Pacific Market Y-o-Y Growth Comparison by Endurance, 2025-2035
  • Figure 135: South Asia and Pacific Market Attractiveness Analysis by Endurance
  • Figure 136: South Asia and Pacific Market Value Share and BPS Analysis by Payload, 2025 and 2035
  • Figure 137: South Asia and Pacific Market Y-o-Y Growth Comparison by Payload, 2025-2035
  • Figure 138: South Asia and Pacific Market Attractiveness Analysis by Payload
  • Figure 139: South Asia and Pacific Market Value Share and BPS Analysis by Wing Type, 2025 and 2035
  • Figure 140: South Asia and Pacific Market Y-o-Y Growth Comparison by Wing Type, 2025-2035
  • Figure 141: South Asia and Pacific Market Attractiveness Analysis by Wing Type
  • Figure 142: South Asia and Pacific Market Value Share and BPS Analysis by Applications, 2025 and 2035
  • Figure 143: South Asia and Pacific Market Y-o-Y Growth Comparison by Applications, 2025-2035
  • Figure 144: South Asia and Pacific Market Attractiveness Analysis by Applications
  • Figure 145: Middle East & Africa Market Value Share and BPS Analysis by Country, 2025 and 2035
  • Figure 146: Middle East & Africa Market Value Share and BPS Analysis by Class , 2025 and 2035
  • Figure 147: Middle East & Africa Market Y-o-Y Growth Comparison by Class , 2025-2035
  • Figure 148: Middle East & Africa Market Attractiveness Analysis by Class
  • Figure 149: Middle East & Africa Market Value Share and BPS Analysis by Energy Source, 2025 and 2035
  • Figure 150: Middle East & Africa Market Y-o-Y Growth Comparison by Energy Source, 2025-2035
  • Figure 151: Middle East & Africa Market Attractiveness Analysis by Energy Source
  • Figure 152: Middle East & Africa Market Value Share and BPS Analysis by Endurance, 2025 and 2035
  • Figure 153: Middle East & Africa Market Y-o-Y Growth Comparison by Endurance, 2025-2035
  • Figure 154: Middle East & Africa Market Attractiveness Analysis by Endurance
  • Figure 155: Middle East & Africa Market Value Share and BPS Analysis by Payload, 2025 and 2035
  • Figure 156: Middle East & Africa Market Y-o-Y Growth Comparison by Payload, 2025-2035
  • Figure 157: Middle East & Africa Market Attractiveness Analysis by Payload
  • Figure 158: Middle East & Africa Market Value Share and BPS Analysis by Wing Type, 2025 and 2035
  • Figure 159: Middle East & Africa Market Y-o-Y Growth Comparison by Wing Type, 2025-2035
  • Figure 160: Middle East & Africa Market Attractiveness Analysis by Wing Type
  • Figure 161: Middle East & Africa Market Value Share and BPS Analysis by Applications, 2025 and 2035
  • Figure 162: Middle East & Africa Market Y-o-Y Growth Comparison by Applications, 2025-2035
  • Figure 163: Middle East & Africa Market Attractiveness Analysis by Applications
  • Figure 164: Global Market - Tier Structure Analysis
  • Figure 165: Global Market - Company Share Analysis

Frequently Asked Questions

How big is the unmanned aerial vehicle market in 2025?

The global unmanned aerial vehicle market is estimated to be valued at USD 29.1 billion in 2025.

What will be the size of unmanned aerial vehicle market in 2035?

The market size for the unmanned aerial vehicle market is projected to reach USD 96.1 billion by 2035.

How much will be the unmanned aerial vehicle market growth between 2025 and 2035?

The unmanned aerial vehicle market is expected to grow at a 12.7% CAGR between 2025 and 2035.

What are the key product types in the unmanned aerial vehicle market?

The key product types in unmanned aerial vehicle market are tactical, small and strategic.

Which energy source segment to contribute significant share in the unmanned aerial vehicle market in 2025?

In terms of energy source, battery operated segment to command 38.7% share in the unmanned aerial vehicle market in 2025.

Explore Similar Insights

Future Market Insights

Unmanned Aerial Vehicle Market

Chat With

MaRIA

Hi There, I am MaRIA, Your Market Research Intelligence Assistant. How may I help you?