The aerial work platforms market is likely to grow from USD 12.1 billion in 2025 to USD 21.1 billion by 2035 represents substantial growth, demonstrating the accelerating adoption of advanced platform technology and height access optimization across construction facilities, industrial operations, and maintenance sectors.
The first half of the decade (2025-2030) will witness the market climbing from USD 12.1 billion to approximately USD 16.2 billion, adding USD 4.1 billion in value, which constitutes 52% of the total forecast growth period. This phase will be characterized by the rapid adoption of boom lift systems, driven by increasing construction volumes and the growing need for advanced height access solutions worldwide. Enhanced platform capabilities and automated safety systems will become standard expectations rather than premium options.
The latter half (2030-2035) will witness continued growth from USD 16.2 billion to USD 21.1 billion, representing an addition of USD 4.8 billion or 48% of the decade's expansion. This period will be defined by mass market penetration of electric platform technologies, integration with comprehensive safety management platforms, and seamless compatibility with existing construction infrastructure. The market trajectory signals fundamental shifts in how construction facilities approach height access optimization and safety management, with participants positioned to benefit from growing demand across multiple platform types and height segments.
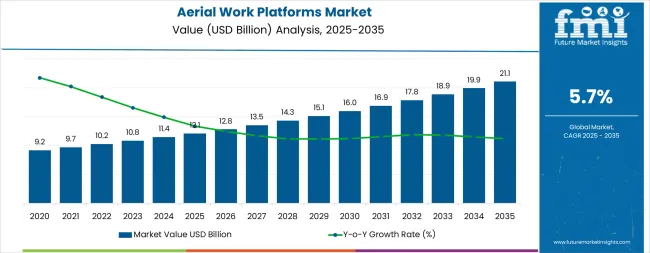
The aerial work platforms market demonstrates distinct growth phases with varying market characteristics and competitive dynamics. Between 2025 and 2030, the market progresses through its technology adoption phase, expanding from USD 12.1 billion to USD 16.2 billion with steady annual increments averaging 5.7% growth. This period showcases the transition from basic platform equipment to advanced boom lift systems with enhanced height capabilities and integrated safety systems becoming mainstream features.
The 2025-2030 phase adds USD 4.1 billion to market value, representing 52% of total decade expansion. Market maturation factors include standardization of safety protocols, declining component costs for specialized equipment, and increasing construction industry awareness of platform benefits reaching 94-97% operational effectiveness in height access applications. Competitive landscape evolution during this period features established machinery companies like Terex Corporation and Haulotte Group expanding their platform portfolios while specialty manufacturers focus on advanced technology development and enhanced safety capabilities.
From 2030 to 2035, market dynamics shift toward advanced automation integration and global construction expansion, with growth continuing from USD 16.2 billion to USD 21.1 billion, adding USD 4.8 billion or 48% of total expansion. This phase transition centers on electric platform systems, integration with automated construction networks, and deployment across diverse industrial and commercial scenarios, becoming standard rather than specialized applications. The competitive environment matures with focus shifting from basic height access capability to comprehensive safety optimization systems and integration with construction monitoring platforms.
At-a-Glance Metrics
| Metric | Value |
|---|---|
| Market Value (2025) | USD 12.1 billion |
| Market Forecast (2035) | USD 21.1 billion |
| Growth Rate | 5.7% CAGR |
| Leading Technology | Boom Lifts Type |
| Primary Application | Construction Segment |
The market demonstrates strong fundamentals with boom lift systems capturing a dominant share through advanced height access capabilities and construction optimization. Construction applications drive primary demand, supported by increasing infrastructure development and industrial safety requirements. Geographic expansion remains concentrated in developed markets with established construction infrastructure, while emerging economies show accelerating adoption rates driven by urbanization initiatives and rising safety standards.
Market expansion rests on three fundamental shifts driving adoption across the construction and industrial sectors. 1. Safety mandates create compelling operational advantages through aerial work platforms that provide immediate height access efficiency without safety delays, enabling construction facilities to meet regulatory standards while maintaining operational productivity and reducing workplace accidents. 2. Construction modernization accelerates as facilities worldwide seek advanced systems that complement traditional access methods, enabling precise height control and safety management that align with industrial regulations and operational efficiency standards. 3. Infrastructure enhancement drives adoption from construction facilities and industrial operations requiring effective height access solutions that minimize setup time while maintaining operational productivity during construction and maintenance operations.
However, growth faces headwinds from equipment cost challenges that vary across machinery suppliers regarding the pricing of specialized platform equipment and height access systems, which may limit adoption in budget-sensitive construction environments. Technical limitations also persist regarding platform capabilities and operational conditions that may reduce effectiveness in extreme weather or challenging site environments, which affect platform performance and safety consistency.
The aerial work platforms market represents a specialized yet critical opportunity driven by expanding infrastructure projects, construction safety modernization, and the adoption of electric and automated platforms. The market will expand from USD 12.1B in 2025 to USD 21B by 2035, adding USD 8.9B in new value. Growth opportunities are concentrated around advanced boom lifts, electrification, rental models, and smart safety integration.
Primary Classification: The market segments by product type into boom lifts, scissor lifts, vertical mast lifts, and push around and spider lifts, representing the evolution from basic access equipment to specialized height solutions for comprehensive construction optimization.
Secondary Classification: Fuel type segmentation divides the market into gas/diesel, electric, and hybrid sectors, reflecting distinct requirements for operational performance, environmental compliance, and facility efficiency standards.
Tertiary Classification: Height segmentation covers Below 10 Meters, 10 to 20 Meters, 20 to 30 Meters, and Above 30 Meters, while sales channels include OEM and rental service providers, and end-use applications span construction, mining, transportation and logistics, manufacturing, aerospace and defence, and others.
Regional Classification: Geographic distribution covers North America, Latin America, Western Europe, Eastern Europe, East Asia, South Asia Pacific, and Middle East & Africa, with developed markets leading adoption while emerging economies show accelerating growth patterns driven by infrastructure expansion programs.
The segmentation structure reveals technology progression from standard platform equipment toward specialized height systems with enhanced safety and automation capabilities, while application diversity spans from construction facilities to industrial maintenance operations requiring precise height access solutions.
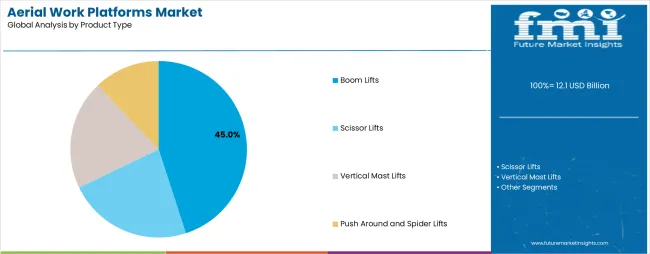
Market Position: Boom Lifts systems command the leading position in the aerial work platforms market with significant market share through advanced height features, including superior reach capability, operational flexibility, and construction optimization that enable construction facilities to achieve optimal height access across diverse industrial and commercial environments.
Value Drivers: The segment benefits from construction facility preference for reliable height systems that provide consistent reach performance, reduced setup time, and operational efficiency optimization without requiring significant infrastructure modifications. Advanced design features enable automated safety systems, height consistency, and integration with existing construction equipment, where operational performance and safety reliability represent critical facility requirements.
Competitive Advantages: Boom Lifts systems differentiate through proven operational stability, consistent height characteristics, and integration with automated construction systems that enhance facility effectiveness while maintaining optimal safety standards suitable for diverse construction and industrial applications.
Key market characteristics:
Scissor Lifts systems maintain a significant market position in the aerial work platforms market due to their specialized height properties and operational advantages. These systems appeal to facilities requiring specific platform characteristics with competitive pricing for indoor construction applications. Market growth is driven by construction expansion, emphasizing reliable height solutions and operational efficiency through optimized system designs.
Vertical Mast Lifts capture market share through specialized height requirements in narrow construction facilities, indoor maintenance operations, and confined space applications. These facilities demand compact height systems capable of operating in restricted environments while providing effective access capabilities and operational efficiency.
Push Around and Spider Lifts account for market share, including specialized maintenance applications, facility management, and confined access operations requiring height capabilities for operational optimization and access control.
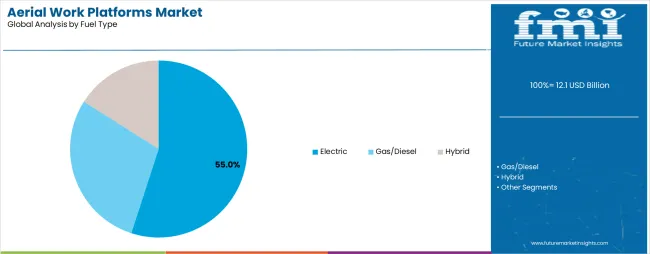
Market Context: Electric platforms demonstrate the highest growth rate in the aerial work platforms market with 6.6% CAGR due to widespread adoption of environmentally compliant systems and increasing focus on indoor construction optimization, operational cost reduction, and facility emission reduction applications that minimize environmental impact while maintaining construction standards.
Appeal Factors: Electric platform operators prioritize system reliability, emission reduction, and integration with existing construction infrastructure that enables coordinated height access across multiple construction operations. The segment benefits from substantial environmental investment and modernization programs that emphasize the acquisition of electric systems for emission control and construction efficiency applications.
Growth Drivers: Environmental compliance programs incorporate electric platforms as standard equipment for construction operations, while indoor facility growth increases demand for emission-free capabilities that comply with environmental standards and minimize operational complexity.
Market Challenges: Varying battery technology standards and charging infrastructure differences may limit system standardization across different facilities or operational scenarios.
Application dynamics include:
Gas/Diesel applications capture market share through traditional height requirements in outdoor construction facilities, heavy industrial operations, and remote site applications. These facilities demand robust power systems capable of operating in challenging environments while providing effective height access and operational reliability capabilities.
Hybrid applications account for market share, including versatile construction operations, mixed environment applications, and flexible facility operations requiring adaptable power capabilities for operational optimization and environmental balance.
Market Position: 10 to 20 Meters platforms command significant market position with 6.4% CAGR through optimal height range that balances accessibility and operational versatility for diverse construction applications.
Value Drivers: This height segment provides the ideal combination of reach capability and operational flexibility, meeting requirements for multi-story construction, facility maintenance, and industrial access applications without excessive complexity or regulatory burdens.
Growth Characteristics: The segment benefits from broad applicability across construction sectors, standardized equipment specifications, and established operator training programs that support widespread adoption and operational efficiency.
Market Context: Rental Service Providers dominate the market with 6.5% CAGR, reflecting the shift toward operational flexibility and capital efficiency in platform acquisition strategies.
Business Model Advantages: Rental models provide immediate access to advanced platforms without long-term capital commitments, enabling construction companies to scale operations based on project demands while maintaining cost control and equipment flexibility.
Operational Benefits: Rental services include maintenance support, equipment upgrades, and technical assistance that reduce operational complexity for construction companies while providing access to latest platform technologies.
Market Position: Construction applications lead the market with 6.6% CAGR, representing the largest end-use segment due to extensive infrastructure development and safety compliance requirements.
Growth Drivers: Construction sector expansion, urbanization projects, and safety regulation enforcement drive consistent demand for height access solutions across residential, commercial, and infrastructure development projects.
Application Scope: Construction applications span building construction, infrastructure development, facility maintenance, and renovation projects requiring diverse height access capabilities and safety compliance features.
Growth Accelerators: Infrastructure development drives primary adoption as aerial work platforms provide height access efficiency capabilities that enable construction facilities to meet safety standards without excessive setup delays, supporting construction operations and safety missions that require precise height access applications. Construction safety demand accelerates market expansion as facilities seek effective systems that minimize workplace accidents while maintaining operational effectiveness during height access and construction scenarios. Safety technology spending increases worldwide, creating continued demand for platform systems that complement traditional construction methods and provide operational flexibility in complex construction environments.
Growth Inhibitors: Equipment cost challenges vary across machinery suppliers regarding the pricing of specialized platform systems and height access equipment, which may limit operational flexibility and market penetration in regions with budget constraints or cost-sensitive construction operations. Technical performance limitations persist regarding platform capabilities and operational conditions that may reduce effectiveness in extreme weather, challenging terrain, or facility environment conditions, affecting platform performance and safety consistency. Market fragmentation across multiple construction specifications and safety standards creates compatibility concerns between different equipment suppliers and existing construction infrastructure.
Market Evolution Patterns: Adoption accelerates in construction and industrial sectors where safety requirements justify platform system costs, with geographic concentration in developed markets transitioning toward mainstream adoption in emerging economies driven by infrastructure initiatives and construction development. Technology development focuses on enhanced platform capabilities, improved safety efficiency, and integration with automated monitoring systems that optimize height access and construction effectiveness. The market could face disruption if alternative height access technologies or safety regulations significantly limit the deployment of traditional platform equipment in construction or industrial applications.
The aerial work platforms market demonstrates varied regional dynamics with Growth Leaders including India (7.8% growth rate) and China (6.9% growth rate) driving expansion through infrastructure initiatives and construction development. Steady Performers encompass United States (5.9% growth rate), Germany (5.1% growth rate), and developed regions, benefiting from established construction industries and advanced platform adoption. Emerging Markets feature Brazil (6% growth rate) and developing regions, where construction initiatives and safety modernization support consistent growth patterns.
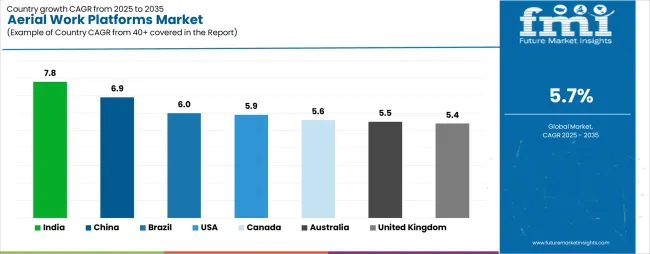
| Country | Growth Rate (2025-2035) |
|---|---|
| India | 7.8% |
| China | 6.9% |
| Brazil | 6% |
| United States | 5.9% |
| Canada | 5.6% |
| Australia | 5.5% |
| United Kingdom | 5.4% |
| France | 5.2% |
| Germany | 5.1% |
| Japan | 5% |
Regional synthesis reveals East Asian markets leading adoption through infrastructure expansion and construction development, while North American countries maintain steady expansion supported by construction technology advancement and safety standardization requirements. European markets show moderate growth driven by construction applications and safety integration trends.
India establishes fastest market growth through aggressive infrastructure programs and comprehensive construction development, integrating advanced aerial work platforms as standard components in urban construction and industrial development installations. The country's 7.8% growth rate reflects government initiatives promoting construction technology and domestic manufacturing capabilities that mandate the use of advanced platform systems in construction and industrial facilities. Growth concentrates in major metropolitan centers, including Mumbai, Delhi, and Bangalore, where construction technology development showcases integrated platform systems that appeal to construction operators seeking advanced facility optimization capabilities and safety management applications.
Indian manufacturers are developing cost-effective platform solutions that combine domestic production advantages with advanced operational features, including automated safety systems and enhanced height capabilities. Distribution channels through construction suppliers and industrial equipment distributors expand market access, while government support for infrastructure development supports adoption across diverse construction and industrial segments.
Strategic Market Indicators:
In Beijing, Shanghai, and Guangzhou, construction facilities and industrial plants are implementing advanced aerial work platforms as standard equipment for height access optimization and safety compliance applications, driven by increasing government infrastructure investment and construction modernization programs that emphasize the importance of safety capabilities. The market holds a 6.9% growth rate, supported by government construction initiatives and industrial infrastructure development programs that promote advanced platform systems for construction and industrial facilities. Chinese operators are adopting platform systems that provide consistent operational performance and safety compliance features, particularly appealing in urban regions where height access efficiency and safety standards represent critical operational requirements.
Market expansion benefits from growing construction technology manufacturing capabilities and international technology transfer agreements that enable domestic production of advanced platform systems for construction and industrial applications. Technology adoption follows patterns established in construction equipment, where reliability and performance drive procurement decisions and operational deployment.
Market Intelligence Brief:
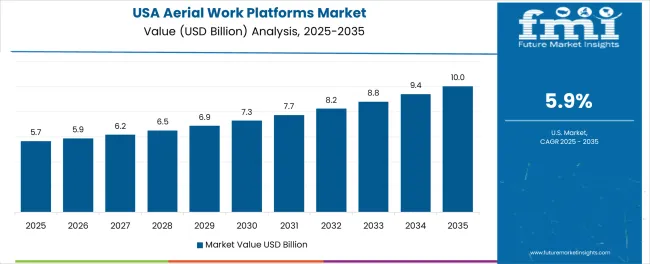
United States establishes market leadership through comprehensive construction programs and advanced construction infrastructure development, integrating aerial work platforms across construction and industrial applications. The country's 5.9% growth rate reflects established construction industry relationships and mature platform technology adoption that supports widespread use of height access systems in construction and maintenance facilities. Growth concentrates in major construction centers, including Texas, California, and Florida, where construction technology showcases mature platform deployment that appeals to construction operators seeking proven height access capabilities and operational efficiency applications.
American platform providers leverage established distribution networks and comprehensive service capabilities, including rental programs and maintenance support that create customer relationships and operational advantages. The market benefits from mature safety regulations and construction standards that mandate platform use while supporting technology advancement and operational optimization.
Market Intelligence Brief:
Germany's advanced construction technology market demonstrates sophisticated aerial work platform deployment with documented operational effectiveness in construction applications and industrial facilities through integration with existing safety systems and construction infrastructure. The country leverages engineering expertise in construction technology and safety systems integration to maintain a 5.1% growth rate. Industrial centers, including Baden-Württemberg, Bavaria, and North Rhine-Westphalia, showcase premium installations where platform systems integrate with comprehensive construction platforms and facility management systems to optimize height access operations and safety effectiveness.
German manufacturers prioritize system reliability and EU compliance in platform equipment development, creating demand for premium systems with advanced features, including facility monitoring integration and automated safety systems. The market benefits from established construction technology infrastructure and a willingness to invest in advanced safety technologies that provide long-term operational benefits and compliance with international construction standards.
Market Intelligence Brief:
Brazil's market expansion benefits from diverse construction demand, including infrastructure modernization in São Paulo and Rio de Janeiro, industrial facility upgrades, and government construction programs that increasingly incorporate platform solutions for safety optimization applications. The country maintains a 6% growth rate, driven by rising construction activity and increasing recognition of platform technology benefits, including precise height control and reduced workplace accidents.
Market dynamics focus on cost-effective platform solutions that balance advanced operational performance with affordability considerations important to Brazilian construction operators. Growing construction industrialization creates continued demand for modern platform systems in new facility infrastructure and construction modernization projects.
Strategic Market Considerations:
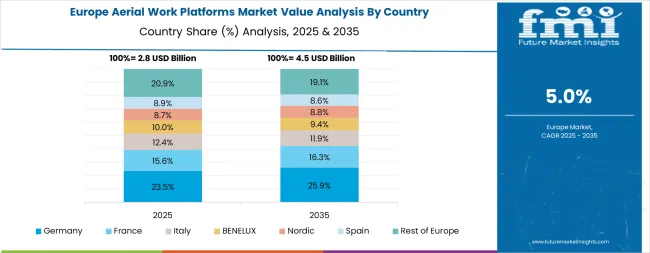
The Western European aerial work platforms market is projected to grow from USD 2.8 billion in 2025 to USD 4.7 billion by 2035, registering a CAGR of 5.3% over the forecast period. Germany is expected to maintain its leadership position with a 32.1% market share in 2025, supported by its advanced construction technology infrastructure and major industrial centers.
United Kingdom follows with a 24.3% share in 2025, driven by comprehensive construction programs and safety technology development initiatives. France holds a 19.6% share through specialized construction applications and safety compliance requirements. Italy commands a 13.8% share, while Spain accounts for 10.2% in 2025. The Rest of Western Europe region is anticipated to gain momentum, expanding its collective share from 7.2% to 7.8% by 2035, attributed to increasing construction adoption in Nordic countries and emerging construction facilities implementing safety modernization programs.
In Germany, the aerial work platforms market prioritizes boom lift systems, which capture the dominant share of construction and industrial installations due to their advanced features, including precision height access optimization and seamless integration with existing construction infrastructure. German facility operators emphasize reliability, precision, and long-term operational excellence, creating demand for boom lift systems that provide consistent height access capabilities and adaptive operational performance based on construction requirements and safety conditions. Other platform types maintain secondary positions primarily in specialized applications and indoor facilities where comprehensive height access functionality meets operational requirements without compromising construction efficiency.
Market Characteristics:
In United Kingdom, the market structure favors international construction companies, including Terex Corporation, Haulotte Group, and OSHKOSH CORPORATION, which maintain dominant positions through comprehensive product portfolios and established construction networks supporting both platform rental and sales installations. These providers offer integrated solutions combining advanced platform systems with professional installation services and ongoing technical support that appeal to British construction operators seeking reliable height access systems. Local construction contractors and service integrators capture a moderate market share by providing localized service capabilities and competitive pricing for standard construction installations, while domestic manufacturers focus on specialized applications and cost-effective solutions tailored to British construction characteristics.
Channel Insights:
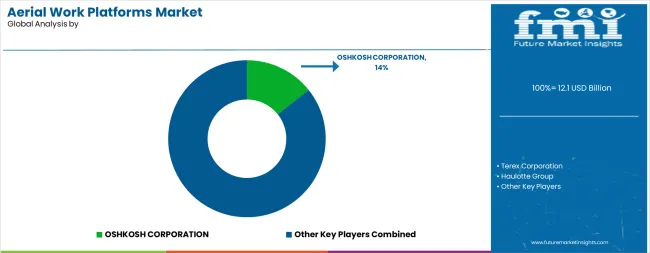
The aerial work platforms market operates with moderate concentration, featuring approximately 20-25 meaningful participants, where leading companies control roughly 55-60% of the global market share through established construction industry relationships and comprehensive platform portfolios. Competition emphasizes advanced height access capabilities, system reliability, and construction integration rather than price-based rivalry.
Market Leaders encompass Terex Corporation, Haulotte Group, and OSHKOSH CORPORATION, which maintain competitive advantages through extensive construction technology expertise, global construction contractor networks, and comprehensive system integration capabilities that create customer switching costs and support premium pricing. These companies leverage decades of platform technology experience and ongoing research investments to develop advanced height access systems with precision operational control and construction monitoring features.
Technology Innovators include Linamar Corporation, Tadano Limited, and Aichi Corporation, which compete through specialized platform technology focus and innovative operational interfaces that appeal to construction operators seeking advanced height access capabilities and operational flexibility. These companies differentiate through rapid technology development cycles and specialized construction application focus.
Regional Specialists feature companies like MEC AERIAL WORK PLATFORMS, PALFINGER AG, and Manitou Group, which focus on specific geographic markets and specialized applications, including electric systems and integrated construction solutions. Market dynamics favor participants that combine reliable platform capabilities with advanced operational software, including precision height access control and automatic performance optimization capabilities. Competitive pressure intensifies as traditional construction equipment contractors expand into platform systems, while specialized construction companies challenge established players through innovative platform solutions and cost-effective systems targeting specialized construction segments.
| Item | Value |
|---|---|
| Quantitative Units | USD 12.1 billion |
| Product Type | Boom Lifts, Scissor Lifts, Vertical Mast Lifts, Push Around and Spider Lifts |
| Fuel Type | Gas/Diesel, Electric, Hybrid |
| Platform Working Height | Below 10 Meters, 10 to 20 Meters, 20 to 30 Meters, Above 30 Meters |
| Sales Channel | OEM, Rental Service Providers |
| End Use | Construction, Mining, Transportation and Logistics, Manufacturing, Aerospace and Defence, Others |
| Regions Covered | North America, Latin America, Western Europe, Eastern Europe, East Asia, South Asia Pacific, Middle East & Africa |
| Countries Covered | United States, China, Germany, India, United Kingdom, Japan, Canada, Brazil, France, Australia, and 25+ additional countries |
| Key Companies Profiled | Terex Corporation, Haulotte Group, OSHKOSH CORPORATION, Linamar Corporation, Tadano Limited, Aichi Corporation, MEC AERIAL WORK PLATFORMS, PALFINGER AG, Manitou Group |
| Additional Attributes | Dollar sales by product type and fuel type categories, regional adoption trends across North America, East Asia, and Western Europe, competitive landscape with construction equipment manufacturers and rental service suppliers, construction operator preferences for precision height access control and system reliability, integration with construction platforms and safety monitoring systems, innovations in platform technology and safety enhancement, and development of automated height access solutions with enhanced performance and construction optimization capabilities. |
The global aerial work platforms market is estimated to be valued at USD 12.1 billion in 2025.
The market size for the aerial work platforms market is projected to reach USD 21.1 billion by 2035.
The aerial work platforms market is expected to grow at a 5.7% CAGR between 2025 and 2035.
The key product types in aerial work platforms market are boom lifts, scissor lifts, vertical mast lifts and push around and spider lifts.
In terms of fuel type, electric segment to command 55.0% share in the aerial work platforms market in 2025.


Full Research Suite comprises of:
Market outlook & trends analysis
Interviews & case studies
Strategic recommendations
Vendor profiles & capabilities analysis
5-year forecasts
8 regions and 60+ country-level data splits
Market segment data splits
12 months of continuous data updates
DELIVERED AS:
PDF EXCEL ONLINE
BRICS Aerial Work Platforms Market Size and Share Forecast Outlook 2025 to 2035
Electrically-Driven Heavy-Duty Aerial Work Platforms Market Size and Share Forecast Outlook 2025 to 2035
Aerial Firefighting Market Size and Share Forecast Outlook 2025 to 2035
Aerial Ladder Trucks Market Size and Share Forecast Outlook 2025 to 2035
Competitive Overview of Aerial Imaging Market Share
Aerial Imaging Market Growth - Trends & Forecast 2025 to 2035
UK Aerial Imaging Market Trends – Demand, Innovations & Forecast 2025-2035
UK Aerial Work Platform Market Analysis – Size & Growth Forecast 2025-2035
USA Aerial Imaging Market Analysis – Size & Industry Trends 2025-2035
USA Aerial Work Platform Market Insights – Demand, Size & Industry Trends 2025-2035
Japan Aerial Imaging Market Report – Trends & Innovations 2025-2035
Korea Aerial Work Platform MarketGrowth - Trends & Forecast 2025 to 2035
Japan Aerial Work Platform Market Growth – Innovations & Therapies 2025 to 2035
ASEAN Aerial Work Platform Market Insights – Size, Trends & Forecast 2025-2035
Germany Aerial Imaging Market Analysis – Growth, Applications & Outlook 2025-2035
Germany Aerial Work Platform Market Trends – Demand & Outlook 2025-2035
Unmanned Aerial Vehicle Market Size and Share Forecast Outlook 2025 to 2035
Unmanned Aerial Vehicles (UAV) Commercial Drone Market Size and Share Forecast Outlook 2025 to 2035
GCC Countries Aerial Imaging Market Growth – Trends, Demand & Innovations 2025-2035
Western Europe aerial work platform market Analysis & Forecast by Product Type, End-use, Fuel Type, Platform Height, Sales Channel, and Region Through 2025 to 2035

Thank you!
You will receive an email from our Business Development Manager. Please be sure to check your SPAM/JUNK folder too.
Chat With
MaRIA