The scissor lift market is experiencing stable growth, influenced by increasing demand for safe and efficient aerial work platforms across various industries. Industry news and equipment rental reports have indicated growing adoption of scissor lifts for indoor and outdoor operations, particularly in urban infrastructure and commercial development projects.
Safety regulations related to working at height, along with productivity needs in industrial settings, have LED to increased reliance on scissor lifts over traditional ladders and scaffolding. Additionally, labor shortages and the push toward mechanized maintenance in logistics, warehousing, and facility management have contributed to higher deployment of compact, mobile lifting solutions.
Technological advancements such as smart diagnostics, real-time telematics, and enhanced load-handling capacities have improved operational safety and efficiency, attracting both contractors and rental fleet operators. The market outlook remains positive as sustainable practices continue to drive demand for electric-powered models, and construction activities in emerging economies strengthen demand across medium platform heights. Segmental leadership is observed in the 30' to 50' platform height category, construction end-use, and electric scissor lift type due to operational versatility, energy efficiency, and alignment with jobsite requirements.
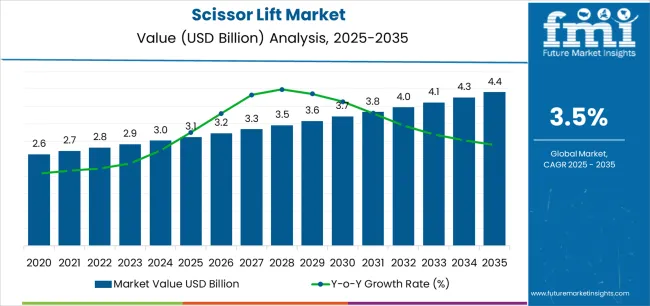
| Metric | Value |
|---|---|
| Scissor Lift Market Estimated Value in (2025 E) | USD 3.1 billion |
| Scissor Lift Market Forecast Value in (2035 F) | USD 4.4 billion |
| Forecast CAGR (2025 to 2035) | 3.5% |
The market is segmented by Platform Height, End-Use Industries, and Type and region. By Platform Height, the market is divided into 30' To 50', Up To 30', and More Than 50'. In terms of End-Use Industries, the market is classified into Construction, Entertainment, Commercial, Manufacturing, and Others. Based on Type, the market is segmented into Electric Scissor Lifts and Engine-Powered Scissor Lifts. Regionally, the market is classified into North America, Latin America, Western Europe, Eastern Europe, Balkan & Baltic Countries, Russia & Belarus, Central Asia, East Asia, South Asia & Pacific, and the Middle East & Africa.
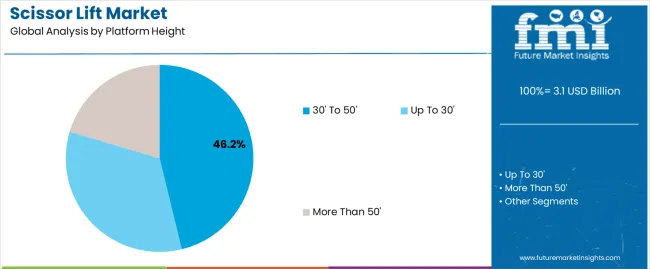
The 30' to 50' platform height segment is projected to hold 46.2% of the scissor lift market revenue in 2025, establishing itself as the most widely used height range. This segment’s growth has been supported by its versatility across construction, commercial, and maintenance applications, where moderate working heights are frequently required.
Equipment rental companies and jobsite managers have favored this category for its balance of reach, mobility, and safety in both indoor and outdoor environments. Reports from lift equipment manufacturers have highlighted strong rental fleet demand for 30' to 50' scissor lifts due to their ability to handle ceiling installations, façade work, and infrastructure maintenance without the complexity of larger boom lifts.
Additionally, the compact footprint of these lifts enables efficient navigation in confined jobsite spaces, while offering adequate vertical access for multi-story building operations. As urban development and fit-out projects continue to rise, the 30' to 50' segment is expected to maintain its leadership through its practical alignment with everyday worksite requirements.
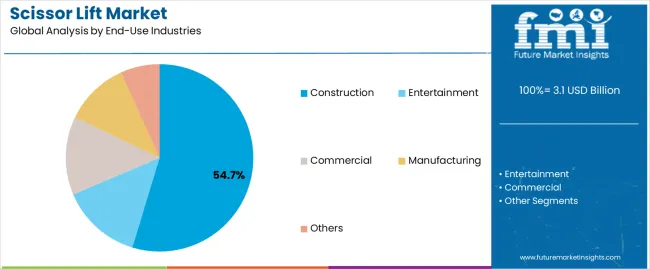
The construction segment is anticipated to account for 54.7% of the scissor lift market revenue in 2025, positioning it as the dominant end-use industry. Growth in this segment has been driven by rising demand for aerial work platforms in residential, commercial, and infrastructure construction projects.
Industry updates and contractor briefings have emphasized the need for reliable height-access solutions that comply with modern safety standards, particularly during structural framing, HVAC installation, and finishing works. Scissor lifts have been adopted on job sites for their ease of deployment, load-bearing capacity, and minimal training requirements compared to complex lifting machinery.
The increasing emphasis on efficiency and site safety in construction workflows has elevated the role of scissor lifts as essential tools for height-based tasks. Furthermore, investments in smart cities, transportation infrastructure, and large-scale housing developments, especially across Asia-Pacific and the Middle East, are expected to sustain demand. With continued government and private sector investment in built environments, the construction segment is likely to remain the top consumer of scissor lift equipment.
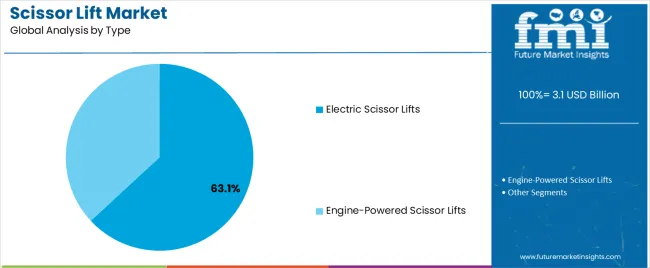
The Electric Scissor Lifts segment is projected to capture 63.1% of the scissor lift market revenue in 2025, securing its position as the leading type. This growth has been influenced by the increasing adoption of environmentally responsible equipment, particularly in indoor and urban applications where noise and emissions regulations are stringent.
Electric models have been favored by facility managers and contractors for their low maintenance requirements, silent operation, and zero-emission functionality. Advancements in battery technology, such as lithium-ion integration and extended charge cycles, have further enhanced the practicality of electric lifts in day-to-day operations.
Equipment catalogs and OEM reports have highlighted increasing product availability in compact and mid-height formats, allowing for wider deployment in malls, warehouses, airports, and data centers. Additionally, regulations promoting electrification in construction equipment have strengthened the segment’s long-term outlook. As industries continue to prioritize sustainability and cost efficiency, electric scissor lifts are expected to remain the preferred choice for a broad range of material handling and elevated access tasks.
Impact of Remote Operations and Automation on the Market
Remote operations allow employees to control the aerial work platforms from safe distances. This is specifically beneficial in hazardous environments or for tasks that require precise positioning.
Automation is likely to streamline scissor operations in the future. Autonomous lifts are anticipated to improve overall project efficiency and decrease completion time for repetitive tasks or those that require high accuracy.
Automation is also estimated to potentially reduce labor costs as the requirement for on-site operators becomes less. It is set to pave the way for the use of mobile elevating work platforms in confined spaces or for tasks that require continuous operations.
Integration of sensors and data collections will likely assist in providing esteemed insights on operator behaviors and maintenance requirements. This data can be used to optimize operations and improve safety protocols.
Increasing Demand for Compact and Lightweight Designs
There is a growing demand for compact and lightweight aerial work platforms as these are easily maneuverable in confined spaces and can be transported through elevators. Lightweight lifts are beneficial for use in areas with weight limitations. Lightweight and compact designs expand the applications in tasks such as building maintenance, delicate restoration projects, and electrical works.
Developers are increasingly focusing on creating advanced designs with lightweight materials without jeopardizing performance or safety. Lightweight aerial work platforms have low ground pressure requirements, making these suitable for use on uneven surfaces. This contributes to improved safety across worksites.
Electrification of Scissor Lifts is Gaining Traction in the Industry
Electric scissor lifts offer several advantages over traditional diesel-powered models. The foremost benefit is environmental friendliness. These produce zero emissions during operations, thereby becoming suitable for use in factories, warehouses, and buildings where gas or diesel pose health risks and increase concerns regarding air quality.
Compared to combustion engines, electric motors operate quietly. This is particularly crucial for noise-sensitive environments. In general, electric scissor lifts have lower operating costs compared to gas or diesel substitutes.
Electric motors also require less maintenance compared to combustion engines. The lack of fumes and noise makes these lifts ideal for indoor tasks.
The global scissor lift market size was registered at USD 2.6 million in 2020. The sector continued to grow steadily at a CAGR of 1.5% from 2020 to 2025. The industry was valued at USD 3.1 million in 2025.
Increasing requirements for commercial buildings expanded construction activities in various regions. This growth resulted in a high demand for scissor lifts to carry out construction tasks at elevated heights. Aerial work platforms are a safer alternative to ladders and scaffolding, thereby aligning with the growing awareness about worker safety.
Specific sectors experienced significant expansion in the pre-pandemic period, translating to increased demand for mobile elevating work platforms to carry out various tasks. Manufacturers were constantly focusing on innovations in scissor lift equipment to improve maneuverability and make these suitable to lift heavy loads.
The growth was, however, not uniform across all regions. Emerging economies that were focusing on infrastructure development or developed countries carrying out renovation tasks experienced a fast adoption and surging demand.
The global scissor lift market report suggests the industry is poised for significant expansion in the coming years. The future of mobile elevating work platforms looks foolproof amid the stringent safety standards across end-use industries.
Rental services are gaining traction among manufacturers. This growth is attributed to the flexibility these offer to companies with short-term requirements of aerial work platforms. The anticipated expansion of the prominent end-use industries will also likely have a significant influence on the scissor lift industry.
Stability and brand awareness are the main characteristics that define Tier 1 enterprises. These companies dominate the sector and use modern technologies to streamline production procedures.
These organizations also offer an extensive variety of products and have extensive manufacturing facilities distributed across multiple areas. Tier 1 companies include JLG Industries, Inc., Terex Corporation (Genie), Haulotte Group, Skyjack Inc. (Linamar Corporation), and Snorkel.
Businesses that operate in specific regions and have a significant impact on the regional economy belong to the Tier 2 category. These firms have an abundance of industry experience and are renowned in global sectors.
Notable businesses in Tier 2 are Dingli, Aichi Corporation, Mantall Heavy Industry Co., Ltd., MEC Aerial Work Platforms, and XCMG (Xuzhou Construction Machinery Group Co., Ltd.).
Regionally based, medium-to-small-sized businesses comprise Tier 3. These firms are limited to a small geographic area and cater to a particular industry. In contrast to businesses in Tier 1 and 2, enterprises in Tier 3 are less structured and formalized.
Prominent enterprises in Tier 3 include Tadano Ltd., AIRO (Airo Tiger S.p.A.), ATN Platforms, Bravi Platforms, and GMG (Global Machinery Group).
The section below covers the dynamics shaping the scissor lift market in various geographic locations. It offers details regarding the key trends and challenges in particular countries, thereby assisting stakeholders to effectively navigate the complexities of the global industry.
India is poised to emerge as the dominating region for the sector during the forecast period with a CAGR of 5.2%. China, Spain, France, and Italy are expected to follow closely behind with the respective CAGRs of 3.9%, 2.6%, 2.4%, and 2.3%.
An in-depth understanding of the regional landscape would allow businesses to tailor strategies accordingly and efficiently meet the preferences and requirements of local consumers.
| Countries | CAGR 2025 to 2035 |
|---|---|
| India | 5.2% |
| China | 3.9% |
| Spain | 2.6% |
| France | 2.4% |
| Italy | 2.3% |
The expanding construction sector is a prominent driver for the growth of the scissor lift market in India. Large-scale government projects such as the “Smart Cities Mission,” coupled with investments in transportation infrastructure are driving demand in the sector.
Residential and commercial real estate development necessitates these mobile elevating work platforms for various construction stages. The country’s emphasis on renewable energy sources is expected to further augment demand for scissor lifts to facilitate the installation and maintenance of these projects.
India, similar to other countries, is poised to implement stringent worker safety regulations. This trend will likely promote the use of aerial work platforms among companies.
The country’s booming manufacturing and warehousing sector is set to increase the demand for aerial work platforms for maintenance tasks, inventory management, and stocking shelves in the ever-expanding storage facilities.
China’s construction industry has one of the most significant number of ongoing projects in various sectors. The government's Belt and Road Initiative (BRI) along with continuous investments in high-speed rail networks, bridges, and urban infrastructure requires multiple aerial work platforms for construction and maintenance.
The rental scissor lift sector is anticipated to expand significantly during the forecast period. One of the prominent attraction elements is the cost-effectiveness these services provide to businesses, particularly small to medium-sized enterprises.
These allow companies to select a suitable mobile elevating work platform for the task at hand without having to buy several models for rare uses.
The country also boasts a growing domestic scissor lift manufacturing sector. This reduces the cost of these products compared to imported ones, thereby making these affordable. This will also likely assist in modifying features to satisfy specific requirements of the domestic industry.
France’s construction sector is likely to experience moderate growth owing to several public infrastructure initiatives, urban development, and renovation and maintenance of the existing infrastructure. These projects are anticipated to create a steady demand for the product.
The rising sustainability trend is projected to increase the adoption of electric scissor lifts for indoor and outdoor use on even surfaces. France-based rental companies are anticipated to integrate sensors and data collection systems in advanced aerial work platforms.
Organizations can then use the data to optimize rental pricing models, develop preventive maintenance schedules, and improve safety protocols by analyzing operator behavior.
The section below provides companies with useful insights and analysis of two leading sectors of the target industry. With this data, investors will be able to better grasp the dynamics of the sector and therefore invest in the most beneficial sectors.
By analyzing the trends, growth drivers, and restraints, businesses will get a thorough grasp of the industry. This analytical data will assist companies in navigating the business environment and making informed decisions.
In 2025, scissor lifts of up to 30’ platform height will likely dominate the industry with a value share of 48.1%. Construction is poised to emerge as the leading end-use industry with a value share of 28.6% in 2025.
| Segment | Up to 30’ (Platform Height) |
|---|---|
| Value Share (2025) | 48.1% |
Scissor lifts, with platform heights of up to thirty feet, are versatile tools suitable for various industries and applications. These enable employees to reach elevated areas, increasing productivity across construction sites.
The lifts also eliminate the need for scaffolding or other access equipment, reducing time spent on tasks. Aerial work platforms of up to 30’ in height offer secure work platforms, thereby reducing falls and accidents.
The construction and maintenance sectors are driving demand for scissor lifts with platforms of up to 30 feet, as these are essential for jobs like painting, electrical work, HVAC installation, and building maintenance. Large-scale aerial work platforms may not fit urban settings, which are set to boost demand.
| Segment | Construction (End-use) |
|---|---|
| Value Share (2025) | 28.6% |
Mobile elevating work platforms are versatile tools used by construction workers to access elevated areas, increasing productivity and safety. These are suitable for constrained locations, rugged terrain, and indoor and outdoor work sites.
These are also ideal for crossing difficult terrain or small spaces. Safety features of mobile elevating platforms reduce the risk of falls and accidents on construction sites.
Aerial work platforms comply with industry norms and laws, allowing construction workers to access elevated areas more efficiently. These help reduce setup times and provide more mobility than manual methods.
These further minimize accidents, increase worker productivity, and save labor costs, despite initial investment, thereby proving to be increasingly beneficial in the construction industry.

Leading companies in the scissor lift market, including, Terex Corporation, JLG Industries, Linamar Corporation, Snorkel International, and Haulotte Group are working toward accommodating a broad range of applications.
Manufacturers are developing aerial work platforms with features such as enhanced maneuverability, variable platform heights and extensions, and increased lifting capacity.
To prioritize safety and reduce workplace accidents, features including overload protection, automated tilt sensors, and better operator training programs are being included. Research and development of electric scissor lifts with long battery lives, quick charging periods, and even hybrid models for long operation are being prioritized.
Developers are working toward installing sensors on mobile elevating work platforms and connecting these to telematics systems to gather data on operator behavior, maintenance requirements, and usage trends. Predictive maintenance, rental price model optimization, and general fleet management can all benefit from this data.
Manufacturers are targeting developing nations with a growing construction sector. Companies are also identifying and developing aerial work platform uses in various sectors and collaborating with those firms to understand and cater to specific requirements.
A few players are forming strong and reliable partnerships with distributors and rental companies to ensure wide accessibility of mobile elevating work platforms.
Manufacturers are focusing on providing seamless consumer service experience to clients by offering readily available technical support and efficient repair services. A handful of firms are progressively capitalizing on digital marketing trends to reach a wide audience.
Companies are further emphasizing the use of sustainable practices throughout manufacturing processes to cater to the environmentally friendly consumer base. These players are readily investing in reach and development to create long-lasting and efficient battery technologies for electric scissor lifts, thereby addressing range anxiety.
At the same time, the companies are reducing the environmental impact of products by developing responsible recycling programs for aerial work platforms at the end of operating lifespans.
Industry Updates
The sector has 3 platform heights, namely, up to 30’, 30’ to 50’, and more than 50’.
Based on type, the sector is divided into electric and engine-powered scissor lifts.
The sector has applications in construction, entertainment, commercial, manufacturing, and others.
The industry is spread across North America, Latin America, Western Europe, South Asia, East Asia, Eastern Europe, and the Middle East and Africa.
The global scissor lift market is estimated to be valued at USD 3.1 billion in 2025.
The market size for the scissor lift market is projected to reach USD 4.4 billion by 2035.
The scissor lift market is expected to grow at a 3.5% CAGR between 2025 and 2035.
The key product types in scissor lift market are 30' to 50', up to 30' and more than 50'.
In terms of end-use industries, construction segment to command 54.7% share in the scissor lift market in 2025.


Our Research Products

The "Full Research Suite" delivers actionable market intel, deep dives on markets or technologies, so clients act faster, cut risk, and unlock growth.

The Leaderboard benchmarks and ranks top vendors, classifying them as Established Leaders, Leading Challengers, or Disruptors & Challengers.

Locates where complements amplify value and substitutes erode it, forecasting net impact by horizon

We deliver granular, decision-grade intel: market sizing, 5-year forecasts, pricing, adoption, usage, revenue, and operational KPIs—plus competitor tracking, regulation, and value chains—across 60 countries broadly.

Spot the shifts before they hit your P&L. We track inflection points, adoption curves, pricing moves, and ecosystem plays to show where demand is heading, why it is changing, and what to do next across high-growth markets and disruptive tech

Real-time reads of user behavior. We track shifting priorities, perceptions of today’s and next-gen services, and provider experience, then pace how fast tech moves from trial to adoption, blending buyer, consumer, and channel inputs with social signals (#WhySwitch, #UX).

Partner with our analyst team to build a custom report designed around your business priorities. From analysing market trends to assessing competitors or crafting bespoke datasets, we tailor insights to your needs.
Supplier Intelligence
Discovery & Profiling
Capacity & Footprint
Performance & Risk
Compliance & Governance
Commercial Readiness
Who Supplies Whom
Scorecards & Shortlists
Playbooks & Docs
Category Intelligence
Definition & Scope
Demand & Use Cases
Cost Drivers
Market Structure
Supply Chain Map
Trade & Policy
Operating Norms
Deliverables
Buyer Intelligence
Account Basics
Spend & Scope
Procurement Model
Vendor Requirements
Terms & Policies
Entry Strategy
Pain Points & Triggers
Outputs
Pricing Analysis
Benchmarks
Trends
Should-Cost
Indexation
Landed Cost
Commercial Terms
Deliverables
Brand Analysis
Positioning & Value Prop
Share & Presence
Customer Evidence
Go-to-Market
Digital & Reputation
Compliance & Trust
KPIs & Gaps
Outputs
Full Research Suite comprises of:
Market outlook & trends analysis
Interviews & case studies
Strategic recommendations
Vendor profiles & capabilities analysis
5-year forecasts
8 regions and 60+ country-level data splits
Market segment data splits
12 months of continuous data updates
DELIVERED AS:
PDF EXCEL ONLINE
Lifting Columns Market Size and Share Forecast Outlook 2025 to 2035
Lift-off Lid Box Market
Hi Lift Jack Market Size and Share Forecast Outlook 2025 to 2035
Airlift Pump Market Report - Demand, Growth & Industry Outlook 2025 to 2035
Airlift Bioreactors Market - Growth & Forecast 2025 to 2035
Mid-Lift Axle Market Size and Share Forecast Outlook 2025 to 2035
Hooklift Trailer Market Size and Share Forecast Outlook 2025 to 2035
Forklift Battery Market Size and Share Forecast Outlook 2025 to 2035
Forklift Attachments Market Growth - Trends & Forecast 2025 to 2035
Cow Lifting Harness Market – Industry Insights & Growth 2025-2035
Forklift-Mounted Computers Market
Hook Lifts and Skip Loaders Market Size and Share Forecast Outlook 2025 to 2035
Heavy Lifting Equipment Market Size and Share Forecast Outlook 2025 to 2035
Pizza Scissors Market Size and Share Forecast Outlook 2025 to 2035
Power Liftgate Market Growth - Trends & Forecast 2025 to 2035
Stair Lifts and Climbing Devices Market Analysis - Size, Share & Forecast 2025 to 2035
Stair Lift Motors Market Growth - Trends & Forecast 2025 to 2035
Manual Lifting Mobile Light Tower Market Size and Share Forecast Outlook 2025 to 2035
Manual Lifting Light Tower Market Size and Share Forecast Outlook 2025 to 2035
Spider Lift Market Size and Share Forecast Outlook 2025 to 2035

Thank you!
You will receive an email from our Business Development Manager. Please be sure to check your SPAM/JUNK folder too.
Chat With
MaRIA