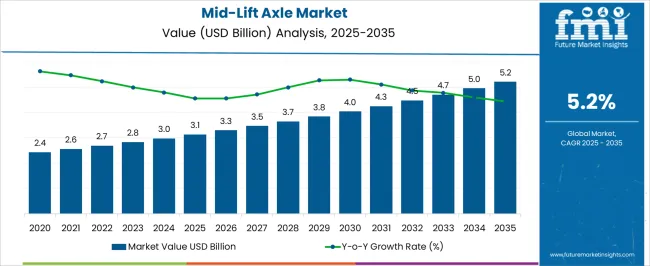
The Mid-Lift Axle market size estimated to be worth USD 2,818.0 million in 2023. The market is likely to surpass USD 4,813.6 million by 2033 at a CAGR of 5.5% during the forecast period.
The market growth mainly propelled by increasing industrialization in emerging and established nations and an increase in transportation industry and recreational sport activities.
Mid-Lift Axles have emerged as the best solution for many end-use industries to prove ease in transportation of heavy weights, agriculture and off road vehicles.
Other Drivers Propelling the Demand for Mid-Lift Axles include:
Challenges for Companies /Manufacturers in the Mid-Lift Axle Market:
Opportunities in the Mid-Lift Axle Industry:
Latest Trends in the Mid-Lift Axle Market:
Attributes | Details |
---|---|
Mid-Lift Axle Market Size (2023) | USD 2,818.0 million |
Mid-Lift Axle Market Projected Size (2033) | USD 4,813.6 million |
Value CAGR (2023 to 2033) | 5.5% |
From 2018 to 2022, the global Mid-Lift Axle market experienced a CAGR of 5%, reaching a market size of USD 2,818.0 million in 2023.
From 2018 to 2022, the global Mid-Lift Axle industry witnessed steady growth due to the rising demand in construction and recreational sports. Mid-Lift Axles also find applications in machinery like tractors, which are integral part of modern agricultural procedures.
The vehicles used in logistics and transportation industry such as truck, trolleys, towing vehicles etc. extensively employ mid-lift Axle system.
The global Mid-Lift Axle industry expected to rise at a CAGR of 5.5% from 2023 to 2033. During the forecast period, the market size expect to reach USD 4,813.6 million.
The Mid-Lift Axle industry expected to continue its growth trajectory from 2023 to 2033, driven by increasing demands from numerous industries for a variety of applications.
The growth of the transportation, construction, agriculture, recreational and off road automobile sector and the rising adoption of battery-powered vehicles expected to drive the demand for Mid-Lift Axles during the forecast period.
The market is also likely to witness significant growth in the North America region due to the presence of huge transportation and heavy commercial vehicle industry.
Country | The United States |
---|---|
Market Size (USD billion) by End of Forecast Period (2033) | USD 2,327.5 million |
CAGR % 2023 to End of Forecast (2033) | 6.0% |
The Mid-Lift Axle industry in the United States expected to reach a market share of USD 2,327.5 million by 2033, expanding at a CAGR of 6.0%. The Mid-Lift Axle industry in the United States expected to witness growth due to high dependency of road transportation and growing mining and construction businesses. Additionally, there are a few other factors expected to drive the demand for Mid-Lift Axles in the country are:
Country | Japan |
---|---|
Market Size (USD billion) by End of Forecast Period (2033) | USD 1,221.7 million |
CAGR % 2023 to End of Forecast (2033) | 5.4% |
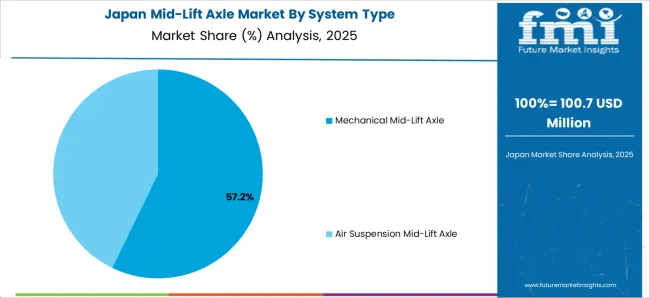
The Mid-Lift Axle industry in Japan expected to reach a market share of USD 1,221.7 million, expanding at a CAGR of 5.4% during the forecast period. The Mid-Lift Axle market in Japan estimated to experience growth owing to the rising demand for construction industry.
Country | Germany |
---|---|
Market Size (USD billion) by End of Forecast Period (2033) | USD 747.0 million |
CAGR % 2023 to End of Forecast (2033) | 5.6% |
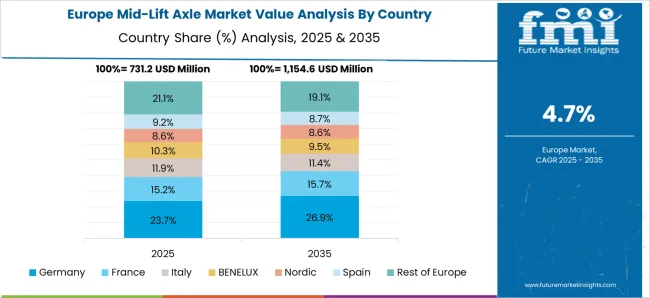
Germany’s Mid-Lift Axle manufacturing industry anticipated to reach a market share of USD 747.0 million, moving at a CAGR of 5.6 % during the forecast period. The Mid-Lift Axle industry in Germany expected to grow prominently due to the increasing demand from automotive and manufacturing sectors. Additionally, the government's focus on renewable energy generation is creating new opportunities for winch systems powered by un conventional energy sources.
Country | South Korea |
---|---|
Market Size (USD billion) by End of Forecast Period (2033) | USD 559.4 million |
CAGR % 2023 to End of Forecast (2033) | 5.2% |
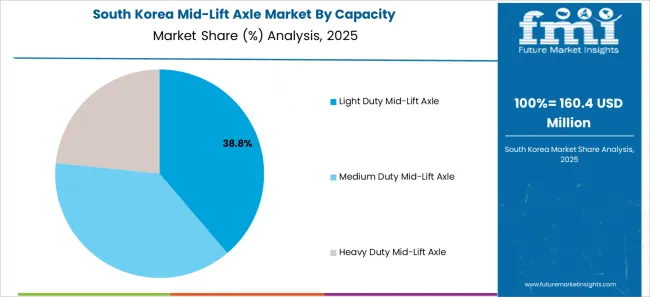
The Mid-Lift Axle industry in South Korea estimated to reach a market share of USD 559.4 million by 2033, thriving at a CAGR of 5.2%. The market in South Korea predicted to grow because of the increasing employment of Mid-Lift Axles in transportation and logistics.
Country | China |
---|---|
Market Size (USD billion) by End of Forecast Period (2033) | USD 423.0 million |
CAGR % 2023 to End of Forecast (2033) | 5.8% |
The Mid-Lift Axle industry in China estimated to reach a market share of USD 423.0 million, expanding at a CAGR of 5.8% during the forecast period. China is the biggest market of electric vehicles, which deployed heavily even for commercial purposes. Rapidly increasing EV fleet of commercial vehicles is increasing demand for mid-lift Axle market.
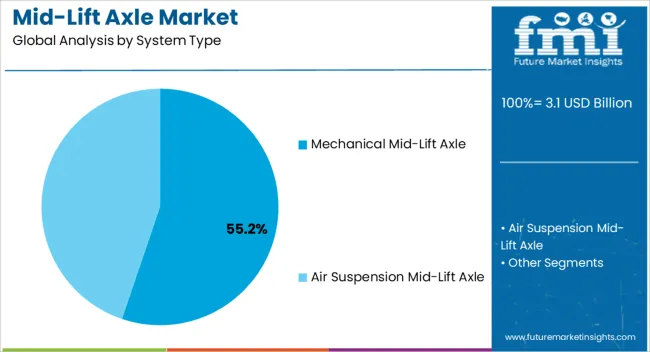
The mechanical mid-lift Axle segment expected to dominate the Mid-Lift Axle industry with a CAGR of 5.9% from 2023 to 2033. This segment captures a significant market share in 2023 due to its robustness, high performance, and low maintenance requirements.
Mechanical mid-lift Axle systems are highly effective and popular in most of light and medium duty industrial applications and are most commonly employed type of system for lifting and transportation of heavy weights.
The Transportation and Logistics industry expected to dominate the Mid-Lift Axle industry with a CAGR of 5.6% from 2023 to 2033. This segment captures a significant market share in 2023 due to the high demand for increasing transportation and logistics Industry.
Mid-Lift Axles are deployed in most of transportation vehicles to join the equipment with the vehicle. Mid-Lift Axle systems finds applications in off-road vehicles, camping gears, kayak, canoes, recreational fishing, and boating attachments.
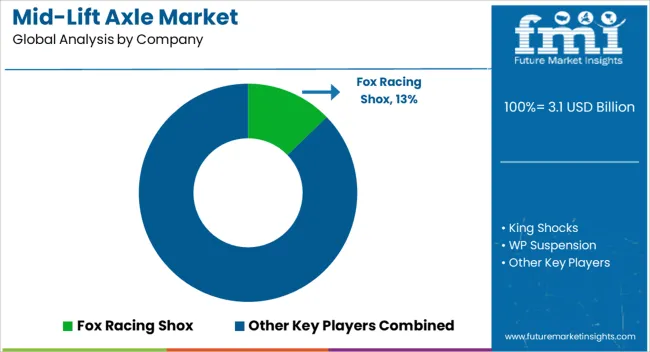
The Mid-Lift Axle industry is highly competitive, with numerous players vying for market share. In such a scenario, key players must adopt effective strategies to stay ahead of the competition.
Key Strategies Adopted by the Players
Product Innovation
Manufacturing companies are putting focus on development of robust products, which are able to withstand higher amounts of weights and simultaneously provide good suspension. Development in material sciences is driving the innovation and increasing the application spectrum of the product.
Strategic Partnerships and Collaborations
Many key manufacturers employs collaborations and strategic partnerships for product development because of the improved pace of research achieved through shared intellectual resources. Another popular trend of partnerships is to establish product-testing facilities along or establish project contracts with educational institutes such as universities and colleges.
Expansion into Emerging Markets
The Mid-Lift Axle industry is witnessing significant growth in emerging markets such as China. Key players are expanding their presence in these markets by establishing local manufacturing facilities and strengthening their distribution networks.
Mergers and Acquisitions
A merger between companies will eliminate competition among them, thus reducing the advertising price of the products. Also, acquisition of local players by key manufacturers help the key manufacturers in increasing their global presence and simultaneously offers a local player an international recognition.
Key Players in the Mid-Lift Axle Industry
Key Developments in the Mid-Lift Axle Market:
Table 1: Global Market Value (US$ Million) Forecast by Region, 2018 & 2033
Table 2: Global Market Volume (Tons) Forecast by Region, 2018 & 2033
Table 3: Global Market Value (US$ Million) Forecast by By System Type, 2018 & 2033
Table 4: Global Market Volume (Tons) Forecast by By System Type, 2018 & 2033
Table 5: Global Market Value (US$ Million) Forecast by By Capacity, 2018 & 2033
Table 6: Global Market Volume (Tons) Forecast by By Capacity, 2018 & 2033
Table 7: Global Market Value (US$ Million) Forecast by By Vehicle type, 2018 & 2033
Table 8: Global Market Volume (Tons) Forecast by By Vehicle type, 2018 & 2033
Table 9: Global Market Value (US$ Million) Forecast by By Industry Application, 2018 & 2033
Table 10: Global Market Volume (Tons) Forecast by By Industry Application, 2018 & 2033
Table 11: North America Market Value (US$ Million) Forecast by Country, 2018 & 2033
Table 12: North America Market Volume (Tons) Forecast by Country, 2018 & 2033
Table 13: North America Market Value (US$ Million) Forecast by By System Type, 2018 & 2033
Table 14: North America Market Volume (Tons) Forecast by By System Type, 2018 & 2033
Table 15: North America Market Value (US$ Million) Forecast by By Capacity, 2018 & 2033
Table 16: North America Market Volume (Tons) Forecast by By Capacity, 2018 & 2033
Table 17: North America Market Value (US$ Million) Forecast by By Vehicle type, 2018 & 2033
Table 18: North America Market Volume (Tons) Forecast by By Vehicle type, 2018 & 2033
Table 19: North America Market Value (US$ Million) Forecast by By Industry Application, 2018 & 2033
Table 20: North America Market Volume (Tons) Forecast by By Industry Application, 2018 & 2033
Table 21: Latin America Market Value (US$ Million) Forecast by Country, 2018 & 2033
Table 22: Latin America Market Volume (Tons) Forecast by Country, 2018 & 2033
Table 23: Latin America Market Value (US$ Million) Forecast by By System Type, 2018 & 2033
Table 24: Latin America Market Volume (Tons) Forecast by By System Type, 2018 & 2033
Table 25: Latin America Market Value (US$ Million) Forecast by By Capacity, 2018 & 2033
Table 26: Latin America Market Volume (Tons) Forecast by By Capacity, 2018 & 2033
Table 27: Latin America Market Value (US$ Million) Forecast by By Vehicle type, 2018 & 2033
Table 28: Latin America Market Volume (Tons) Forecast by By Vehicle type, 2018 & 2033
Table 29: Latin America Market Value (US$ Million) Forecast by By Industry Application, 2018 & 2033
Table 30: Latin America Market Volume (Tons) Forecast by By Industry Application, 2018 & 2033
Table 31: Western Europe Market Value (US$ Million) Forecast by Country, 2018 & 2033
Table 32: Western Europe Market Volume (Tons) Forecast by Country, 2018 & 2033
Table 33: Western Europe Market Value (US$ Million) Forecast by By System Type, 2018 & 2033
Table 34: Western Europe Market Volume (Tons) Forecast by By System Type, 2018 & 2033
Table 35: Western Europe Market Value (US$ Million) Forecast by By Capacity, 2018 & 2033
Table 36: Western Europe Market Volume (Tons) Forecast by By Capacity, 2018 & 2033
Table 37: Western Europe Market Value (US$ Million) Forecast by By Vehicle type, 2018 & 2033
Table 38: Western Europe Market Volume (Tons) Forecast by By Vehicle type, 2018 & 2033
Table 39: Western Europe Market Value (US$ Million) Forecast by By Industry Application, 2018 & 2033
Table 40: Western Europe Market Volume (Tons) Forecast by By Industry Application, 2018 & 2033
Table 41: Eastern Europe Market Value (US$ Million) Forecast by Country, 2018 & 2033
Table 42: Eastern Europe Market Volume (Tons) Forecast by Country, 2018 & 2033
Table 43: Eastern Europe Market Value (US$ Million) Forecast by By System Type, 2018 & 2033
Table 44: Eastern Europe Market Volume (Tons) Forecast by By System Type, 2018 & 2033
Table 45: Eastern Europe Market Value (US$ Million) Forecast by By Capacity, 2018 & 2033
Table 46: Eastern Europe Market Volume (Tons) Forecast by By Capacity, 2018 & 2033
Table 47: Eastern Europe Market Value (US$ Million) Forecast by By Vehicle type, 2018 & 2033
Table 48: Eastern Europe Market Volume (Tons) Forecast by By Vehicle type, 2018 & 2033
Table 49: Eastern Europe Market Value (US$ Million) Forecast by By Industry Application, 2018 & 2033
Table 50: Eastern Europe Market Volume (Tons) Forecast by By Industry Application, 2018 & 2033
Table 51: East Asia Market Value (US$ Million) Forecast by Country, 2018 & 2033
Table 52: East Asia Market Volume (Tons) Forecast by Country, 2018 & 2033
Table 53: East Asia Market Value (US$ Million) Forecast by By System Type, 2018 & 2033
Table 54: East Asia Market Volume (Tons) Forecast by By System Type, 2018 & 2033
Table 55: East Asia Market Value (US$ Million) Forecast by By Capacity, 2018 & 2033
Table 56: East Asia Market Volume (Tons) Forecast by By Capacity, 2018 & 2033
Table 57: East Asia Market Value (US$ Million) Forecast by By Vehicle type, 2018 & 2033
Table 58: East Asia Market Volume (Tons) Forecast by By Vehicle type, 2018 & 2033
Table 59: East Asia Market Value (US$ Million) Forecast by By Industry Application, 2018 & 2033
Table 60: East Asia Market Volume (Tons) Forecast by By Industry Application, 2018 & 2033
Table 61: South Asia Market Value (US$ Million) Forecast by Country, 2018 & 2033
Table 62: South Asia Market Volume (Tons) Forecast by Country, 2018 & 2033
Table 63: South Asia Market Value (US$ Million) Forecast by By System Type, 2018 & 2033
Table 64: South Asia Market Volume (Tons) Forecast by By System Type, 2018 & 2033
Table 65: South Asia Market Value (US$ Million) Forecast by By Capacity, 2018 & 2033
Table 66: South Asia Market Volume (Tons) Forecast by By Capacity, 2018 & 2033
Table 67: South Asia Market Value (US$ Million) Forecast by By Vehicle type, 2018 & 2033
Table 68: South Asia Market Volume (Tons) Forecast by By Vehicle type, 2018 & 2033
Table 69: South Asia Market Value (US$ Million) Forecast by By Industry Application, 2018 & 2033
Table 70: South Asia Market Volume (Tons) Forecast by By Industry Application, 2018 & 2033
Table 71: MEA Market Value (US$ Million) Forecast by Country, 2018 & 2033
Table 72: MEA Market Volume (Tons) Forecast by Country, 2018 & 2033
Table 73: MEA Market Value (US$ Million) Forecast by By System Type, 2018 & 2033
Table 74: MEA Market Volume (Tons) Forecast by By System Type, 2018 & 2033
Table 75: MEA Market Value (US$ Million) Forecast by By Capacity, 2018 & 2033
Table 76: MEA Market Volume (Tons) Forecast by By Capacity, 2018 & 2033
Table 77: MEA Market Value (US$ Million) Forecast by By Vehicle type, 2018 & 2033
Table 78: MEA Market Volume (Tons) Forecast by By Vehicle type, 2018 & 2033
Table 79: MEA Market Value (US$ Million) Forecast by By Industry Application, 2018 & 2033
Table 80: MEA Market Volume (Tons) Forecast by By Industry Application, 2018 & 2033
Figure 1: Global Market Value (US$ Million) by By System Type, 2023 & 2033
Figure 2: Global Market Value (US$ Million) by By Capacity, 2023 & 2033
Figure 3: Global Market Value (US$ Million) by By Vehicle type, 2023 & 2033
Figure 4: Global Market Value (US$ Million) by By Industry Application, 2023 & 2033
Figure 5: Global Market Value (US$ Million) by Region, 2023 & 2033
Figure 6: Global Market Value (US$ Million) Analysis by Region, 2018 & 2033
Figure 7: Global Market Volume (Tons) Analysis by Region, 2018 & 2033
Figure 8: Global Market Value Share (%) and BPS Analysis by Region, 2023 & 2033
Figure 9: Global Market Y-o-Y Growth (%) Projections by Region, 2023 to 2033
Figure 10: Global Market Value (US$ Million) Analysis by By System Type, 2018 & 2033
Figure 11: Global Market Volume (Tons) Analysis by By System Type, 2018 & 2033
Figure 12: Global Market Value Share (%) and BPS Analysis by By System Type, 2023 & 2033
Figure 13: Global Market Y-o-Y Growth (%) Projections by By System Type, 2023 to 2033
Figure 14: Global Market Value (US$ Million) Analysis by By Capacity, 2018 & 2033
Figure 15: Global Market Volume (Tons) Analysis by By Capacity, 2018 & 2033
Figure 16: Global Market Value Share (%) and BPS Analysis by By Capacity, 2023 & 2033
Figure 17: Global Market Y-o-Y Growth (%) Projections by By Capacity, 2023 to 2033
Figure 18: Global Market Value (US$ Million) Analysis by By Vehicle type, 2018 & 2033
Figure 19: Global Market Volume (Tons) Analysis by By Vehicle type, 2018 & 2033
Figure 20: Global Market Value Share (%) and BPS Analysis by By Vehicle type, 2023 & 2033
Figure 21: Global Market Y-o-Y Growth (%) Projections by By Vehicle type, 2023 to 2033
Figure 22: Global Market Value (US$ Million) Analysis by By Industry Application, 2018 & 2033
Figure 23: Global Market Volume (Tons) Analysis by By Industry Application, 2018 & 2033
Figure 24: Global Market Value Share (%) and BPS Analysis by By Industry Application, 2023 & 2033
Figure 25: Global Market Y-o-Y Growth (%) Projections by By Industry Application, 2023 to 2033
Figure 26: Global Market Attractiveness by By System Type, 2023 to 2033
Figure 27: Global Market Attractiveness by By Capacity, 2023 to 2033
Figure 28: Global Market Attractiveness by By Vehicle type, 2023 to 2033
Figure 29: Global Market Attractiveness by By Industry Application, 2023 to 2033
Figure 30: Global Market Attractiveness by Region, 2023 to 2033
Figure 31: North America Market Value (US$ Million) by By System Type, 2023 & 2033
Figure 32: North America Market Value (US$ Million) by By Capacity, 2023 & 2033
Figure 33: North America Market Value (US$ Million) by By Vehicle type, 2023 & 2033
Figure 34: North America Market Value (US$ Million) by By Industry Application, 2023 & 2033
Figure 35: North America Market Value (US$ Million) by Country, 2023 & 2033
Figure 36: North America Market Value (US$ Million) Analysis by Country, 2018 & 2033
Figure 37: North America Market Volume (Tons) Analysis by Country, 2018 & 2033
Figure 38: North America Market Value Share (%) and BPS Analysis by Country, 2023 & 2033
Figure 39: North America Market Y-o-Y Growth (%) Projections by Country, 2023 to 2033
Figure 40: North America Market Value (US$ Million) Analysis by By System Type, 2018 & 2033
Figure 41: North America Market Volume (Tons) Analysis by By System Type, 2018 & 2033
Figure 42: North America Market Value Share (%) and BPS Analysis by By System Type, 2023 & 2033
Figure 43: North America Market Y-o-Y Growth (%) Projections by By System Type, 2023 to 2033
Figure 44: North America Market Value (US$ Million) Analysis by By Capacity, 2018 & 2033
Figure 45: North America Market Volume (Tons) Analysis by By Capacity, 2018 & 2033
Figure 46: North America Market Value Share (%) and BPS Analysis by By Capacity, 2023 & 2033
Figure 47: North America Market Y-o-Y Growth (%) Projections by By Capacity, 2023 to 2033
Figure 48: North America Market Value (US$ Million) Analysis by By Vehicle type, 2018 & 2033
Figure 49: North America Market Volume (Tons) Analysis by By Vehicle type, 2018 & 2033
Figure 50: North America Market Value Share (%) and BPS Analysis by By Vehicle type, 2023 & 2033
Figure 51: North America Market Y-o-Y Growth (%) Projections by By Vehicle type, 2023 to 2033
Figure 52: North America Market Value (US$ Million) Analysis by By Industry Application, 2018 & 2033
Figure 53: North America Market Volume (Tons) Analysis by By Industry Application, 2018 & 2033
Figure 54: North America Market Value Share (%) and BPS Analysis by By Industry Application, 2023 & 2033
Figure 55: North America Market Y-o-Y Growth (%) Projections by By Industry Application, 2023 to 2033
Figure 56: North America Market Attractiveness by By System Type, 2023 to 2033
Figure 57: North America Market Attractiveness by By Capacity, 2023 to 2033
Figure 58: North America Market Attractiveness by By Vehicle type, 2023 to 2033
Figure 59: North America Market Attractiveness by By Industry Application, 2023 to 2033
Figure 60: North America Market Attractiveness by Country, 2023 to 2033
Figure 61: Latin America Market Value (US$ Million) by By System Type, 2023 & 2033
Figure 62: Latin America Market Value (US$ Million) by By Capacity, 2023 & 2033
Figure 63: Latin America Market Value (US$ Million) by By Vehicle type, 2023 & 2033
Figure 64: Latin America Market Value (US$ Million) by By Industry Application, 2023 & 2033
Figure 65: Latin America Market Value (US$ Million) by Country, 2023 & 2033
Figure 66: Latin America Market Value (US$ Million) Analysis by Country, 2018 & 2033
Figure 67: Latin America Market Volume (Tons) Analysis by Country, 2018 & 2033
Figure 68: Latin America Market Value Share (%) and BPS Analysis by Country, 2023 & 2033
Figure 69: Latin America Market Y-o-Y Growth (%) Projections by Country, 2023 to 2033
Figure 70: Latin America Market Value (US$ Million) Analysis by By System Type, 2018 & 2033
Figure 71: Latin America Market Volume (Tons) Analysis by By System Type, 2018 & 2033
Figure 72: Latin America Market Value Share (%) and BPS Analysis by By System Type, 2023 & 2033
Figure 73: Latin America Market Y-o-Y Growth (%) Projections by By System Type, 2023 to 2033
Figure 74: Latin America Market Value (US$ Million) Analysis by By Capacity, 2018 & 2033
Figure 75: Latin America Market Volume (Tons) Analysis by By Capacity, 2018 & 2033
Figure 76: Latin America Market Value Share (%) and BPS Analysis by By Capacity, 2023 & 2033
Figure 77: Latin America Market Y-o-Y Growth (%) Projections by By Capacity, 2023 to 2033
Figure 78: Latin America Market Value (US$ Million) Analysis by By Vehicle type, 2018 & 2033
Figure 79: Latin America Market Volume (Tons) Analysis by By Vehicle type, 2018 & 2033
Figure 80: Latin America Market Value Share (%) and BPS Analysis by By Vehicle type, 2023 & 2033
Figure 81: Latin America Market Y-o-Y Growth (%) Projections by By Vehicle type, 2023 to 2033
Figure 82: Latin America Market Value (US$ Million) Analysis by By Industry Application, 2018 & 2033
Figure 83: Latin America Market Volume (Tons) Analysis by By Industry Application, 2018 & 2033
Figure 84: Latin America Market Value Share (%) and BPS Analysis by By Industry Application, 2023 & 2033
Figure 85: Latin America Market Y-o-Y Growth (%) Projections by By Industry Application, 2023 to 2033
Figure 86: Latin America Market Attractiveness by By System Type, 2023 to 2033
Figure 87: Latin America Market Attractiveness by By Capacity, 2023 to 2033
Figure 88: Latin America Market Attractiveness by By Vehicle type, 2023 to 2033
Figure 89: Latin America Market Attractiveness by By Industry Application, 2023 to 2033
Figure 90: Latin America Market Attractiveness by Country, 2023 to 2033
Figure 91: Western Europe Market Value (US$ Million) by By System Type, 2023 & 2033
Figure 92: Western Europe Market Value (US$ Million) by By Capacity, 2023 & 2033
Figure 93: Western Europe Market Value (US$ Million) by By Vehicle type, 2023 & 2033
Figure 94: Western Europe Market Value (US$ Million) by By Industry Application, 2023 & 2033
Figure 95: Western Europe Market Value (US$ Million) by Country, 2023 & 2033
Figure 96: Western Europe Market Value (US$ Million) Analysis by Country, 2018 & 2033
Figure 97: Western Europe Market Volume (Tons) Analysis by Country, 2018 & 2033
Figure 98: Western Europe Market Value Share (%) and BPS Analysis by Country, 2023 & 2033
Figure 99: Western Europe Market Y-o-Y Growth (%) Projections by Country, 2023 to 2033
Figure 100: Western Europe Market Value (US$ Million) Analysis by By System Type, 2018 & 2033
Figure 101: Western Europe Market Volume (Tons) Analysis by By System Type, 2018 & 2033
Figure 102: Western Europe Market Value Share (%) and BPS Analysis by By System Type, 2023 & 2033
Figure 103: Western Europe Market Y-o-Y Growth (%) Projections by By System Type, 2023 to 2033
Figure 104: Western Europe Market Value (US$ Million) Analysis by By Capacity, 2018 & 2033
Figure 105: Western Europe Market Volume (Tons) Analysis by By Capacity, 2018 & 2033
Figure 106: Western Europe Market Value Share (%) and BPS Analysis by By Capacity, 2023 & 2033
Figure 107: Western Europe Market Y-o-Y Growth (%) Projections by By Capacity, 2023 to 2033
Figure 108: Western Europe Market Value (US$ Million) Analysis by By Vehicle type, 2018 & 2033
Figure 109: Western Europe Market Volume (Tons) Analysis by By Vehicle type, 2018 & 2033
Figure 110: Western Europe Market Value Share (%) and BPS Analysis by By Vehicle type, 2023 & 2033
Figure 111: Western Europe Market Y-o-Y Growth (%) Projections by By Vehicle type, 2023 to 2033
Figure 112: Western Europe Market Value (US$ Million) Analysis by By Industry Application, 2018 & 2033
Figure 113: Western Europe Market Volume (Tons) Analysis by By Industry Application, 2018 & 2033
Figure 114: Western Europe Market Value Share (%) and BPS Analysis by By Industry Application, 2023 & 2033
Figure 115: Western Europe Market Y-o-Y Growth (%) Projections by By Industry Application, 2023 to 2033
Figure 116: Western Europe Market Attractiveness by By System Type, 2023 to 2033
Figure 117: Western Europe Market Attractiveness by By Capacity, 2023 to 2033
Figure 118: Western Europe Market Attractiveness by By Vehicle type, 2023 to 2033
Figure 119: Western Europe Market Attractiveness by By Industry Application, 2023 to 2033
Figure 120: Western Europe Market Attractiveness by Country, 2023 to 2033
Figure 121: Eastern Europe Market Value (US$ Million) by By System Type, 2023 & 2033
Figure 122: Eastern Europe Market Value (US$ Million) by By Capacity, 2023 & 2033
Figure 123: Eastern Europe Market Value (US$ Million) by By Vehicle type, 2023 & 2033
Figure 124: Eastern Europe Market Value (US$ Million) by By Industry Application, 2023 & 2033
Figure 125: Eastern Europe Market Value (US$ Million) by Country, 2023 & 2033
Figure 126: Eastern Europe Market Value (US$ Million) Analysis by Country, 2018 & 2033
Figure 127: Eastern Europe Market Volume (Tons) Analysis by Country, 2018 & 2033
Figure 128: Eastern Europe Market Value Share (%) and BPS Analysis by Country, 2023 & 2033
Figure 129: Eastern Europe Market Y-o-Y Growth (%) Projections by Country, 2023 to 2033
Figure 130: Eastern Europe Market Value (US$ Million) Analysis by By System Type, 2018 & 2033
Figure 131: Eastern Europe Market Volume (Tons) Analysis by By System Type, 2018 & 2033
Figure 132: Eastern Europe Market Value Share (%) and BPS Analysis by By System Type, 2023 & 2033
Figure 133: Eastern Europe Market Y-o-Y Growth (%) Projections by By System Type, 2023 to 2033
Figure 134: Eastern Europe Market Value (US$ Million) Analysis by By Capacity, 2018 & 2033
Figure 135: Eastern Europe Market Volume (Tons) Analysis by By Capacity, 2018 & 2033
Figure 136: Eastern Europe Market Value Share (%) and BPS Analysis by By Capacity, 2023 & 2033
Figure 137: Eastern Europe Market Y-o-Y Growth (%) Projections by By Capacity, 2023 to 2033
Figure 138: Eastern Europe Market Value (US$ Million) Analysis by By Vehicle type, 2018 & 2033
Figure 139: Eastern Europe Market Volume (Tons) Analysis by By Vehicle type, 2018 & 2033
Figure 140: Eastern Europe Market Value Share (%) and BPS Analysis by By Vehicle type, 2023 & 2033
Figure 141: Eastern Europe Market Y-o-Y Growth (%) Projections by By Vehicle type, 2023 to 2033
Figure 142: Eastern Europe Market Value (US$ Million) Analysis by By Industry Application, 2018 & 2033
Figure 143: Eastern Europe Market Volume (Tons) Analysis by By Industry Application, 2018 & 2033
Figure 144: Eastern Europe Market Value Share (%) and BPS Analysis by By Industry Application, 2023 & 2033
Figure 145: Eastern Europe Market Y-o-Y Growth (%) Projections by By Industry Application, 2023 to 2033
Figure 146: Eastern Europe Market Attractiveness by By System Type, 2023 to 2033
Figure 147: Eastern Europe Market Attractiveness by By Capacity, 2023 to 2033
Figure 148: Eastern Europe Market Attractiveness by By Vehicle type, 2023 to 2033
Figure 149: Eastern Europe Market Attractiveness by By Industry Application, 2023 to 2033
Figure 150: Eastern Europe Market Attractiveness by Country, 2023 to 2033
Figure 151: East Asia Market Value (US$ Million) by By System Type, 2023 & 2033
Figure 152: East Asia Market Value (US$ Million) by By Capacity, 2023 & 2033
Figure 153: East Asia Market Value (US$ Million) by By Vehicle type, 2023 & 2033
Figure 154: East Asia Market Value (US$ Million) by By Industry Application, 2023 & 2033
Figure 155: East Asia Market Value (US$ Million) by Country, 2023 & 2033
Figure 156: East Asia Market Value (US$ Million) Analysis by Country, 2018 & 2033
Figure 157: East Asia Market Volume (Tons) Analysis by Country, 2018 & 2033
Figure 158: East Asia Market Value Share (%) and BPS Analysis by Country, 2023 & 2033
Figure 159: East Asia Market Y-o-Y Growth (%) Projections by Country, 2023 to 2033
Figure 160: East Asia Market Value (US$ Million) Analysis by By System Type, 2018 & 2033
Figure 161: East Asia Market Volume (Tons) Analysis by By System Type, 2018 & 2033
Figure 162: East Asia Market Value Share (%) and BPS Analysis by By System Type, 2023 & 2033
Figure 163: East Asia Market Y-o-Y Growth (%) Projections by By System Type, 2023 to 2033
Figure 164: East Asia Market Value (US$ Million) Analysis by By Capacity, 2018 & 2033
Figure 165: East Asia Market Volume (Tons) Analysis by By Capacity, 2018 & 2033
Figure 166: East Asia Market Value Share (%) and BPS Analysis by By Capacity, 2023 & 2033
Figure 167: East Asia Market Y-o-Y Growth (%) Projections by By Capacity, 2023 to 2033
Figure 168: East Asia Market Value (US$ Million) Analysis by By Vehicle type, 2018 & 2033
Figure 169: East Asia Market Volume (Tons) Analysis by By Vehicle type, 2018 & 2033
Figure 170: East Asia Market Value Share (%) and BPS Analysis by By Vehicle type, 2023 & 2033
Figure 171: East Asia Market Y-o-Y Growth (%) Projections by By Vehicle type, 2023 to 2033
Figure 172: East Asia Market Value (US$ Million) Analysis by By Industry Application, 2018 & 2033
Figure 173: East Asia Market Volume (Tons) Analysis by By Industry Application, 2018 & 2033
Figure 174: East Asia Market Value Share (%) and BPS Analysis by By Industry Application, 2023 & 2033
Figure 175: East Asia Market Y-o-Y Growth (%) Projections by By Industry Application, 2023 to 2033
Figure 176: East Asia Market Attractiveness by By System Type, 2023 to 2033
Figure 177: East Asia Market Attractiveness by By Capacity, 2023 to 2033
Figure 178: East Asia Market Attractiveness by By Vehicle type, 2023 to 2033
Figure 179: East Asia Market Attractiveness by By Industry Application, 2023 to 2033
Figure 180: East Asia Market Attractiveness by Country, 2023 to 2033
Figure 181: South Asia Market Value (US$ Million) by By System Type, 2023 & 2033
Figure 182: South Asia Market Value (US$ Million) by By Capacity, 2023 & 2033
Figure 183: South Asia Market Value (US$ Million) by By Vehicle type, 2023 & 2033
Figure 184: South Asia Market Value (US$ Million) by By Industry Application, 2023 & 2033
Figure 185: South Asia Market Value (US$ Million) by Country, 2023 & 2033
Figure 186: South Asia Market Value (US$ Million) Analysis by Country, 2018 & 2033
Figure 187: South Asia Market Volume (Tons) Analysis by Country, 2018 & 2033
Figure 188: South Asia Market Value Share (%) and BPS Analysis by Country, 2023 & 2033
Figure 189: South Asia Market Y-o-Y Growth (%) Projections by Country, 2023 to 2033
Figure 190: South Asia Market Value (US$ Million) Analysis by By System Type, 2018 & 2033
Figure 191: South Asia Market Volume (Tons) Analysis by By System Type, 2018 & 2033
Figure 192: South Asia Market Value Share (%) and BPS Analysis by By System Type, 2023 & 2033
Figure 193: South Asia Market Y-o-Y Growth (%) Projections by By System Type, 2023 to 2033
Figure 194: South Asia Market Value (US$ Million) Analysis by By Capacity, 2018 & 2033
Figure 195: South Asia Market Volume (Tons) Analysis by By Capacity, 2018 & 2033
Figure 196: South Asia Market Value Share (%) and BPS Analysis by By Capacity, 2023 & 2033
Figure 197: South Asia Market Y-o-Y Growth (%) Projections by By Capacity, 2023 to 2033
Figure 198: South Asia Market Value (US$ Million) Analysis by By Vehicle type, 2018 & 2033
Figure 199: South Asia Market Volume (Tons) Analysis by By Vehicle type, 2018 & 2033
Figure 200: South Asia Market Value Share (%) and BPS Analysis by By Vehicle type, 2023 & 2033
Figure 201: South Asia Market Y-o-Y Growth (%) Projections by By Vehicle type, 2023 to 2033
Figure 202: South Asia Market Value (US$ Million) Analysis by By Industry Application, 2018 & 2033
Figure 203: South Asia Market Volume (Tons) Analysis by By Industry Application, 2018 & 2033
Figure 204: South Asia Market Value Share (%) and BPS Analysis by By Industry Application, 2023 & 2033
Figure 205: South Asia Market Y-o-Y Growth (%) Projections by By Industry Application, 2023 to 2033
Figure 206: South Asia Market Attractiveness by By System Type, 2023 to 2033
Figure 207: South Asia Market Attractiveness by By Capacity, 2023 to 2033
Figure 208: South Asia Market Attractiveness by By Vehicle type, 2023 to 2033
Figure 209: South Asia Market Attractiveness by By Industry Application, 2023 to 2033
Figure 210: South Asia Market Attractiveness by Country, 2023 to 2033
Figure 211: MEA Market Value (US$ Million) by By System Type, 2023 & 2033
Figure 212: MEA Market Value (US$ Million) by By Capacity, 2023 & 2033
Figure 213: MEA Market Value (US$ Million) by By Vehicle type, 2023 & 2033
Figure 214: MEA Market Value (US$ Million) by By Industry Application, 2023 & 2033
Figure 215: MEA Market Value (US$ Million) by Country, 2023 & 2033
Figure 216: MEA Market Value (US$ Million) Analysis by Country, 2018 & 2033
Figure 217: MEA Market Volume (Tons) Analysis by Country, 2018 & 2033
Figure 218: MEA Market Value Share (%) and BPS Analysis by Country, 2023 & 2033
Figure 219: MEA Market Y-o-Y Growth (%) Projections by Country, 2023 to 2033
Figure 220: MEA Market Value (US$ Million) Analysis by By System Type, 2018 & 2033
Figure 221: MEA Market Volume (Tons) Analysis by By System Type, 2018 & 2033
Figure 222: MEA Market Value Share (%) and BPS Analysis by By System Type, 2023 & 2033
Figure 223: MEA Market Y-o-Y Growth (%) Projections by By System Type, 2023 to 2033
Figure 224: MEA Market Value (US$ Million) Analysis by By Capacity, 2018 & 2033
Figure 225: MEA Market Volume (Tons) Analysis by By Capacity, 2018 & 2033
Figure 226: MEA Market Value Share (%) and BPS Analysis by By Capacity, 2023 & 2033
Figure 227: MEA Market Y-o-Y Growth (%) Projections by By Capacity, 2023 to 2033
Figure 228: MEA Market Value (US$ Million) Analysis by By Vehicle type, 2018 & 2033
Figure 229: MEA Market Volume (Tons) Analysis by By Vehicle type, 2018 & 2033
Figure 230: MEA Market Value Share (%) and BPS Analysis by By Vehicle type, 2023 & 2033
Figure 231: MEA Market Y-o-Y Growth (%) Projections by By Vehicle type, 2023 to 2033
Figure 232: MEA Market Value (US$ Million) Analysis by By Industry Application, 2018 & 2033
Figure 233: MEA Market Volume (Tons) Analysis by By Industry Application, 2018 & 2033
Figure 234: MEA Market Value Share (%) and BPS Analysis by By Industry Application, 2023 & 2033
Figure 235: MEA Market Y-o-Y Growth (%) Projections by By Industry Application, 2023 to 2033
Figure 236: MEA Market Attractiveness by By System Type, 2023 to 2033
Figure 237: MEA Market Attractiveness by By Capacity, 2023 to 2033
Figure 238: MEA Market Attractiveness by By Vehicle type, 2023 to 2033
Figure 239: MEA Market Attractiveness by By Industry Application, 2023 to 2033
Figure 240: MEA Market Attractiveness by Country, 2023 to 2033
In 2023, the market is expected to be worth USD 2,818.0 million.
From 2018 to 2022, the global market thrived at a 5% CAGR.
The market is expected to continue growth at a 5.5% CAGR until 2033.
By 2033, the United States to possess a market share of USD 2,327.5 million, advancing at a 6.0% CAGR.
The market is expected to be around USD 4,813.6 million by 2033.
Explore Automotive Chassis System Insights
Thank you!
You will receive an email from our Business Development Manager. Please be sure to check your SPAM/JUNK folder too.